Sample Category Title
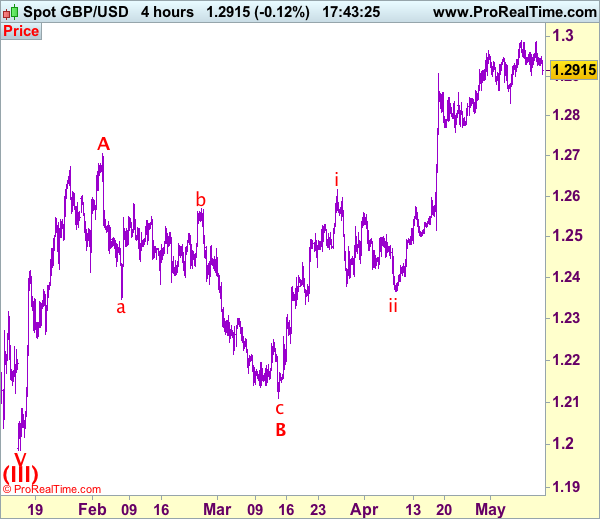
Trade Idea: GBP/USD – Hold short entered at 1.2955
GBP/USD – 1.2915
Recent wave: Wave V of larger degree wave (III) has ended at 1.1986 and major correction has commenced from there for gain to 1.3000 and 1.3140-50
Trend: Near term up
Original strategy :
Sold at 1.2955, Target: 1.2775, Stop: 1.3000
Position: - Short at 1.2955
Target: - 1.2775
Stop: - 1.3000
New strategy :
Hold short entered at 1.2955, Target: 1.2775, Stop: 1.3000
Position: - Short at 1.2955
Target: - 1.2775
Stop:- 1.3000
As cable has retreated after faltering below indicated resistance at 1.2991-00, retaining our view that further consolidation would be seen with mild downside bias for another test of 1.2900-03 support, break there would suggest a temporary top is possibly formed, bring weakness to 1.2831 support, however, a break below this level is needed to add credence to this view, bring retracement of recent rise to 1.2770-75 but previous support at 1.2757 should hold from here. We are keeping our view that the wave c as well as larger degree wave B has ended at 1.2109, hence impulsive wave C has commenced from there with wave i of C ended at 1.2616, follow by a correction to 1.2365 (end of wave ii) and wave iii rally is unfolding.
Our preferred count on the daily chart is that cable's rebound from 1.3500 (wave (A) trough) is unfolding as a wave (B) with A ended at 1.7043, followed by triangle wave B and wave C as well as wave (B) has ended at 1.7192, the subsequent selloff is the larger degree wave (C) which is still unfolding with minor wave (III) of larger degree wave 3 ended at 1.1986, hence wave (IV) correction is in progress which could either be a triangle wave (IV) of a complex formation but upside should be limited to 1.3500 and price should falter well below 1.4000, bring another decline in wave (V) of 3 for weakness to 1.1500, then 1.1200.
On the upside, expect recovery to be limited to 1.2950 and bring another retreat later. Above said resistance at 1.2995 would extend recent upmove to 1.3040-50 but overbought condition should limit upside to 1.3075-80 and price should falter below 1.3100.
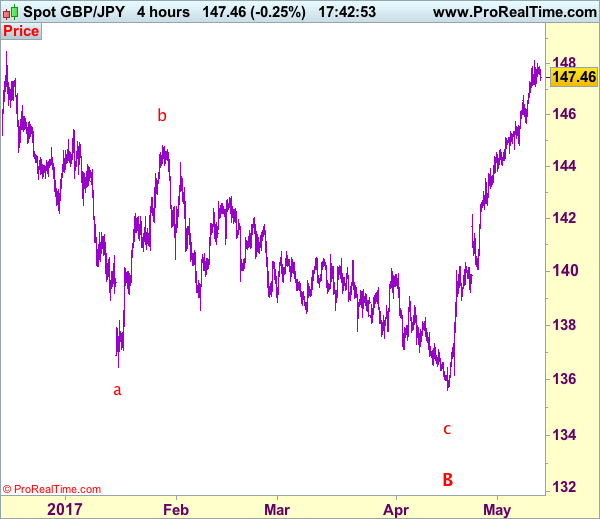
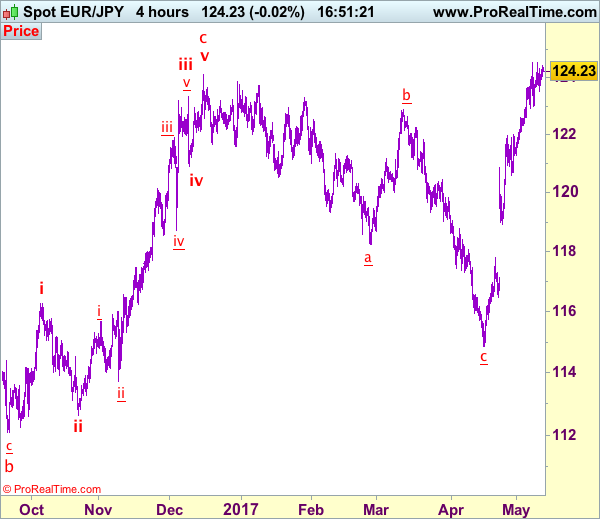
Trade Idea: GBP/JPY – Buy at 145.75
GBP/JPY - 147.45
Recent wave: Medium term low formed at 120.50 and (A)-(B)-(C) major correction has commenced with (A) leg ended at 148.45, hence wave (B) is unfolding for retreat to 131.00-10.
Trend: Near term up
Original strategy:
Buy at 145.75, Target: 148.75, Stop: 145.15
Position: -
Target: -
Stop: -
New strategy :
Buy at 145.75, Target: 148.75, Stop: 145.15
Position: -
Target: -
Stop:-
Sterling’s near term sideways trading below resistance at 148.10 is expected to continue and pullback to 146.50-60 cannot be ruled out, however, reckon downside would be limited to 145.70-75 and bring another upmove later, above said resistance at 148.10 would extend recent upmove from 135.60 to previous chart resistance at 148.45, then towards 148.90-00 but near term overbought condition should prevent sharp move beyond 149.50, bring retreat later.
In view of this, would not chase this rise here and would be prudent to buy sterling on subsequent pullback as 145.65-70 should limit downside, bring another rise later. Below said support at 145.15-20 would defer and suggest a temporary top is possibly formed, bring correction to 144.80-85 but only break there would provide confirmation, bring correction to 144.50 first.
Our preferred count is that larger degree wave V with circle is unfolding from 251.12 with wave (I) 219.34, (II): 241.38 and wave (III) is subdivided into 1: 192.60, 2: 215.89 (23 Jul 2008) and wave 3 ended at 118.87 earlier in 2009. The correction from there to 162.60 is wave 4 which itself is a double three and is labeled as first a-b-c ended at 151.53, followed by wave x at 139.03, 2nd a ended at 162.60, 2nd b at 146.75 and 2nd c leg of wave 4 ended at 163.00. Therefore, the decline from 163.00 to 116.85 is now treated as wave 5 which also marked the end of larger degree wave (III), hence wave (IV) major correction has commenced for retracement of the wave (III) from 241.38 and upside target at 183.95-00 (50% Fibonacci retracement of the wave (II) from 241.38) had been met, a drop below 160.00 would suggest wave (IV) has ended at 195.85, bring decline in wave (V) for initial weakness to 130 (already met) and 120.
EUR/GBP Elliott Wave Analysis
EUR/GBP – 0.8422
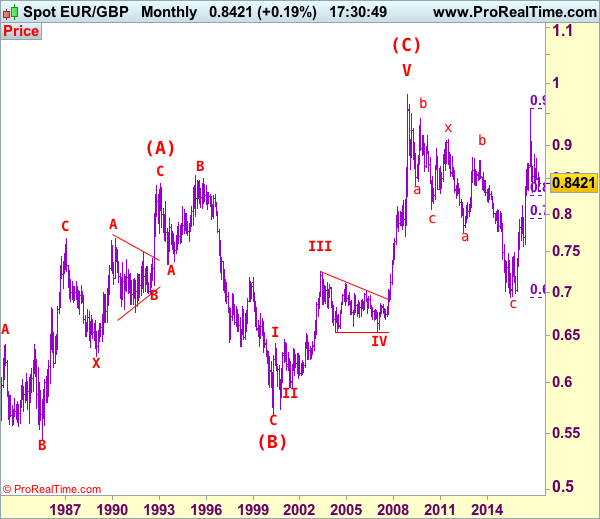
EUR/GBP – The major (A)(B)(C)-(X)-(A)(B)(C) correction from 0.9805 is unfolding and 2nd (A) has possibly ended at 0.6936.
As the single currency retreated after meeting resistance at 0.8531 late last month, suggesting consolidation with mild downside bias would be seen and initial weakness to 0.8360-65 cannot be ruled out, however, as long as support at 0.8312 holds, prospect of another rebound remains, above 0.8509 (last week’s high) would bring test of 0.8531 but break there is needed to retain bullishness and signal low is formed at 0.8312, bring a stronger rebound to 0.8592, break there would signal the fall from 0.8857 has ended instead, bring further subsequent gain to 0.8650-60 and possibly towards resistance at 0.8735 but price should falter well below resistance at 0.8788.
Our latest preferred count is that the wave V of a 5-wave series from 0.5682 ended at 0.9805 earlier and major from there has possibly ended at 0.8067 as A-B-C-X-A-B-C. We are keeping our view that the entire correction from 0.9805 has possibly ended at 0.7756 and as labeled as the attached daily chart and impulsive move from 0.9084 has ended at 0.7756 as a 5-waver which marked either the (C) wave or the A leg of (C), a daily close above resistance at 0.8831 would suggest (C) leg has ended and headway towards 0.9084.
On the downside, whilst the pullback from 0.8531 may bring initial weakness to 0.8360-65, reckon downside would be limited and said support at 0.8312 should hold, bring another rebound later. A drop below 0.8351 support would signal the rebound from 0.8312 has ended but only break of said support at 0.8304 would revive bearishness and indicate early decline from 0.9576 top (2016 high) has resumed for weakness to 0.8251 support, then 0.8200.
Recommendation: Stand aside for this week.
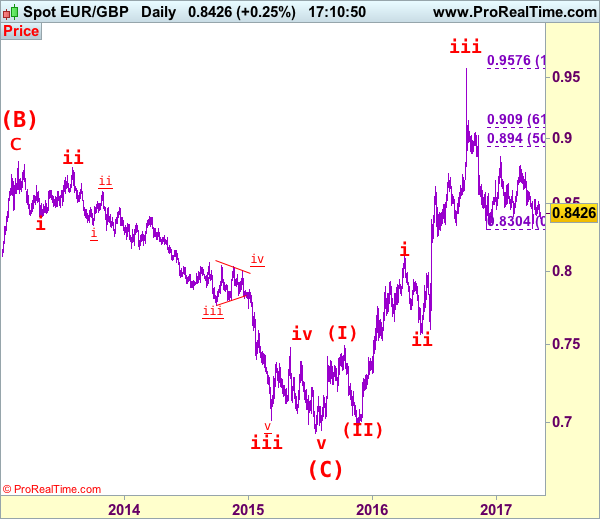
Euro's long term uptrend started in Feb 1981 at 0.5039 and is unfolding as a (A)-(B)-(C) move with (A): 0.8433 (Feb 1993), (B): 0.5682 (May 2000) and impulsive wave (C) should have ended at 0.9805 with wave III ended at 0.7254 (May 2003), triangle wave IV at 0.6536 (23 Jan 2007) and wave V as well as wave (C) has ended at 0.9805.
We are keeping an alternate count that only wave III ended at 0.9805 and the correction from there is the wave IV and may extend weakness to 0.7700, however, it is necessary to see a daily close above resistance at 0.9143 would change this to be the preferred count.
NZD Falls To 11-Month Low, BoE In Focus
NZD tumbles amid dovish RBNZ
The New Zealand dollar tumbled 1.20% during the Asian session after the RBNZ surprised the market with a dovish statement. The Kiwi slid to 0.6718 against the greenback, its lowest level since June 3rd last year. The central bank held the Official Cash Rate (OCR) at record low 1.75%, as broadly expected by market participants. The disappointment stems from the fact that Governor Wheeler failed to acknowledge the recent positive developments in both inflation levels and the Kiwi trade-weighted value (-5% since the February meeting).
Inflation forecast was revised to the upside with the headline measure expected to hit 2.1%y/y in the third quarter before easing toward 1.1% in the first quarter of 2018. The RBNZ justified its decision by stating that the recent pick-up in consumer prices “was mainly due to higher tradable inflation, particularly petrol and food prices” and added that “the level of core inflation has generally remained low”. Those elements suggest that the RBNZ is in no hurry to increase borrowing cost.
In our view, the central bank is simply playing for time, waiting for the Fed to tighten further its monetary policy before making a move. Historically, as a commodity producer country, New Zealand is used to deal with stronger inflationary pressure - remember the RBNZ has a target band of 2% +/-1%. Looking at the current inflation picture, it is obvious that the RBNZ as time to see it coming. Meanwhile, it will continue to emphasize the strength of the Kiwi, which is weighting on tradable inflation.
NZD/USD is currently testing the key support area at around 0.6800-80 (previous lows). A clear break of this area is needed to trigger a sell-off in the Kiwi. We do not rule further NZD weakness, especially given the recent pick-up in US treasury yields, while Kiwi’s ones have been moving lower consistently since the beginning of the year.
HKD weakens further
The long USD short HKD trade continues uninterrupted, clearly having no fears of preemptive official intervention at this point. USDHKD increased to 7.7891 in Asian trading well below the Hong Kong Monetary Authority’s 7.85 upper band (7.75 to 7.85 convertibility range). HKMA has expressed commitment to the USD linked exchange rate (expected to intervene at 7.8), yet the rapid HKD deprecations spawn questions about the sustainability of the peg. The widening US-HK interest rate differential makes borrowing cheap in HK and buying in US a tempting candidate for carry traders. Concerns over Hong Kong’s attempt to slow house price appreciations on tighter lending practices and increase in purchase tax has pushed Hibor (1-month Hibor 0.38 from 0.75 in Jan) below the US equivalent while high levels of interbank liquidy lower demand for HKD.
In addition, China’s is also in the process of tightening of financial conditions and expectations of gradual Fed interest rate increases and reduction in balance sheet are all generating excessive outflows. However, the hazard of waiting is that speculative short selling of HKD could complicate the HKMA objective and even threaten the stability of the banking system. Waiting could force the HKMA to intervene but possibly raise interest rates. Given the high level of leverage in Hong Kong house holds a sharp rate increase would pressure debt holder and constrict consumptions, a dangerous spiral. Currently give the manageable fundamental backdrop and the HKMA massive $3.5 trillion reserves we see no threat to the USD peg.
BoE to keep rates unchanged today
Today the Bank of England will decide about its interest rate that should likely remain around 0.25% against the backdrop of political uncertainties. Indeed, the 8th of June New General Election will take place, after Theresa May asked the Queen Elizabeth to dissolve the parliament. UK Prime Minister is attempting to gain a stronger majority before negotiation on the article 50 with the EU.
This is why the British central bank should favour today the wait-and-see mode. Political uncertainties regarding the 2-year negotiation period prevail. Anyway, the BoE has gained some time since last year as the UK economy had clearly benefited from pound devaluation after the Brexit vote. The inflation is now standing at 2.3% y/y. Yet the growth seems still a bit slow (0.3% for Q1 GDP). The unemployment rate keeps declining and is now standing at a 12-year low.
However, there is one important thing to be said, the UK trade deficit is still very large despite the weak pound. The trend is clearly negative and amounts for £3.6 billion. We believe that, even though the weak pound is helping the economy, it also means that the overseas demand is falling for UK goods certainly on fears that the trade relations with the UK are unclear at the moment.
USD/CAD Elliott Wave Analysis
USD/CAD – 1.3709
USD/CAD – Wave v ended at 0.9407 and a-b-c correction may extend gain to 1.4700
As the greenback has maintained a firm undertone after recent rally, suggesting the erratic rise from 1.2461 low is still in progress and bullishness remains for this move to bring at least a strong correction of the fall from 1.4690 (2016 high) to 1.3800 and later 1.3835-40 (61.8% Fibonacci retracement of 1.4690-1.2461), however, near term overbought condition would limit upside to 1.3890-00 and reckon upside would be limited and price should falter well below psychological resistance at 1.4000, bring retreat later.
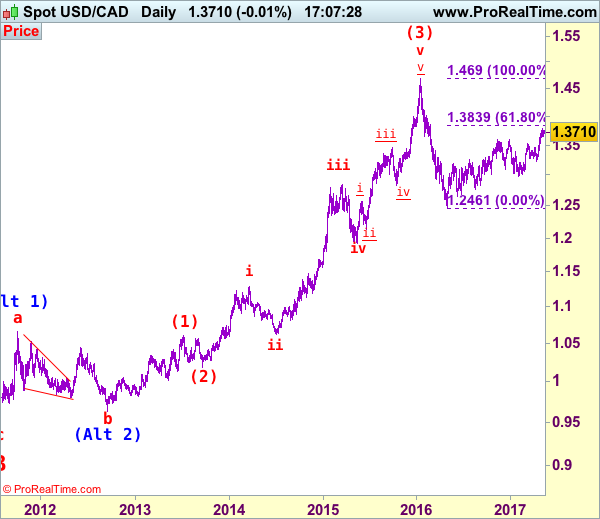
We are keeping our view that the wave b from 1.0657 (a leg top) has possibly ended at 0.9633 with (a): 0.9800, wave (b): 1.0447 and wave c at 0.9633, the subsequent rise from there is now treated as wave c exceeded indicated upside target at 1.3770-80 and 1.4000 and wave (3) has possibly ended at 1.4690 and wave (4) correction has commenced for retracement back to 1.2832 support, then 1.2410-20.
On the daily chart, our latest preferred count remains that the A of (B) rally from 0.9059 low (7 Nov 2007) unfolded into an impulsive wave with i: 0.9059-1.0380, ii ended at 0.9819, iii at 1.3019 followed by triangle wave iv at 1.2026 , then wave v formed a top at 1.3066 and also ended the wave A. The wave B is unfolding as an double three a-b-c-x-a-b-c and is sub-divided as a: 1.2192, b: 1.2716 and wave c at 1.0784, followed by wave x at 1.1725, another set of a-b-c unfolded with 2nd a at 0.9931, 2nd b at 1.0674. the 2nd c has possibly ended at 0.9407, therefore, consolidation with upside bias is seen for major correction, indicated target at 1.3900 had been met and gain to 1.4700 would follow.
On the downside, whilst pullback to 1.3650 cannot be ruled out, reckon downside would be limited and support at 1.3530 should remain intact, bring another rise later. A daily close below 1.3530 would defer and suggest top is possibly formed, risk weakness to 1.3450-60 but break of indicated support at 1.3411 is needed to add credence to this view, bring further fall to 1.3380-85, then 1.3335-40.
Recommendation: Buy at 1.3650 for 1.3850 with stop below 1.3550.
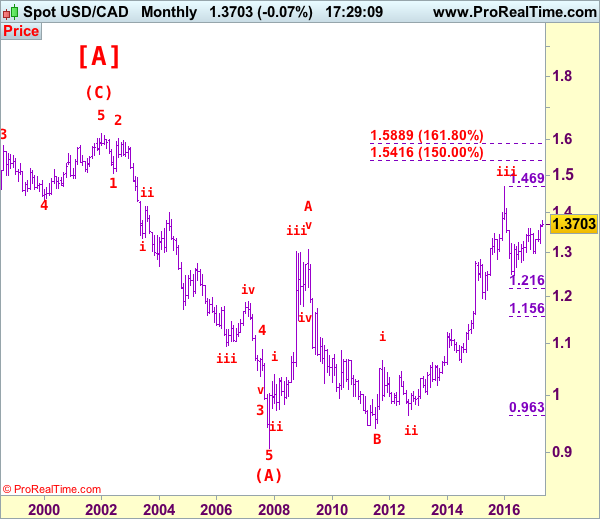
Longer term - The selloff from 1.6194 (21 Jan 2002) to 0.9059 (07 Nov 2007) is viewed as (A) wave which is a 5-waver as labeled on the monthly chart as below, the subsequently rally is labeled as (B) with impulsive A leg of (B) ended at 1.3066, wave B of (B) is unfolding which has either ended at 0.9407 or would extend one more fall but downside should be limited to 0.9200 and 0.9000 should hold.
Euro Subdued, German Inflation Beats Estimate
The euro is quiet in the Thursday session, as EUR/USD trades at 1.0880. On the release front, German WPI posted a gain of 0.3%, beating the estimate of 0.1%. The EU released its Spring 2017 Economic Forecast, which presented a generally optimistic picture of the economies of EU members. In the US, PPI is expected to show a slight gain of 0.2%, and unemployment claims is forecast to climb to 245 thousand. On Friday, Germany releases Preliminary GDP. It will be a busy day in the US, which will publish retail sales, CPI and consumer confidence.
The eurozone received its semi-annual report card on Thursday, as the European Commission released its Spring 2017 Economic Forecast. The report noted that the European economy is in its fifth year of recovery, and forecast eurozone GDP growth of 1.7% in 2017 and 1.8% in 2018. On the inflation front, the report stated that inflation had risen in recent months, but this was mainly due to an increase in oil prices. Still, inflation was expected to reach 1.6% in 2017 and 1.3% in 2018, compared to just 0.2% in 2016. Stronger growth has led to lower unemployment, and the report projected that eurozone unemployment rate would drop to 9.4% in 2017 and 8.9% in 2018. The report reiterated what ECB president Mario Draghi has long been saying, namely, that risks to the eurozone economy remain tilted to the downside. These risks include US economic and trade policy under President Trump, the banking sector in Europe and the UK’s exit from the EU. This forecast is considerably more optimistic than the Winter 2017 forecast, as is apparent from the captions in the press releases for these two reports: The Winter forecast was entitled “Navigating through choppy waters”, while the caption for the Spring forecast reads “Steady growth ahead”.
Donald Trump has been embroiled in a number of controversies in his short presidency, but the political earthquake he has now stirred could become political quicksand for the new president. Trump abruptly fired FBI director James Comey on Tuesday, stunning lawmakers on both sides of the aisle in Congress. Comey, who has been conducting an investigation into possible collusion between Trump and Russia during the presidential campaign, clearly has been a thorn in Trump’s side. The White House has claimed that it fired Comey over his handling of an email scandal involving Hillary Clinton, but the move has been roundly condemned by the Democrats, and some key Republicans have also voiced opposition as well. The firestorm could heat up further, with calls in Congress to appoint a special prosecutor into Trump’s connections with Russia. Has Trump gone one step to far? This latest controversy could cause some jitters among investors and hurt the US dollar.
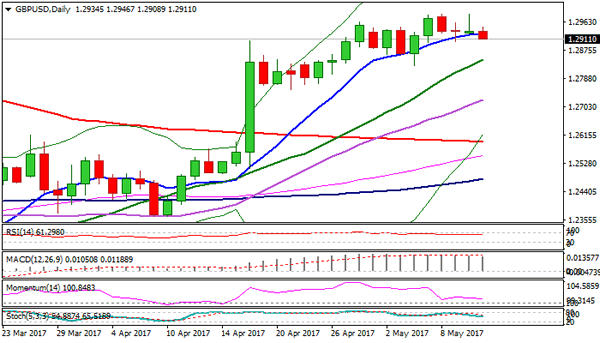
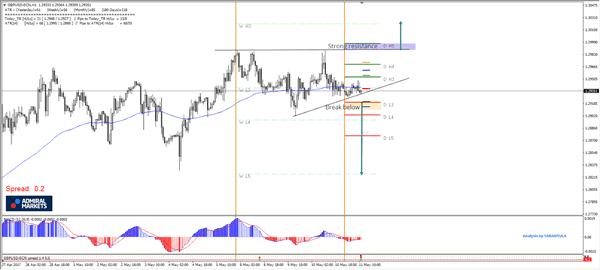
Technical Outlook: Cable – Break Of 1.2900/1.3000 Pivots To Signal Fresh Direction, BoE Reports Seen As A Trigger
Cable is holding within 1.2900/87 congestion for the third day, awaiting the outcome from BoE’s super Thursday on policy decision and inflation report.
Markets are widely expected the central bank to stay unchanged today, but focus will turn on the minutes of the previous meeting. Lat time, one MPC member voted for rate hike towards the end of the year and markets will be closely watching for today’s minutes’ numbers.
If number of voters for early rate hike increases that would be good support for the pound.
Inflation remains steady above 2% and unemployment is holding ant multi-year lows, which are supportive factors.
On the other side GDP fell below expectations in Q1 that weighs on sentiment.
Traders are also focusing on the press conference of BoE’s Governor Carney for more hints.
From the technical point of view, cable remains bullish overall, with recent dips being contained by daily Tenkan-sen line (1.2908) which marks initial support.
Strong indecision was signaled by long shadows of past two days’ candles, as the pair faced strong headwinds at psychological 1.3000 barrier.
Indication of fresh downside comes from daily RSI and slow stochastic that turned south after touching overbought zone boundary.
Initial bearish signal could be expected on loss of 1.2900 handle which may trigger bearish acceleration towards next pivots at 1.2830 (04 May trough) and 1.2750 (Fibo 38.2% of 1.2363/1.2986 rally).
Alternative scenario needs sustained break through 1.3000 barrier for attack at next strong barrier at 1.3088 (base of falling weekly Ichimoku cloud).
Res: 1.3000, 1.3050, 1.3088, 1.3146
Sup: 1.2900, 1.2830, 1.2770, 1.2750
Trade Idea: EUR/JPY – Hold short entered at 124.00
EUR/JPY - 124.20
Recent wave: wave v of (C) ended at 94.12 and major correction in wave A has ended at 149.79
Trend: Near term up
Original strategy:
Sold at 124.00, Target: 122.20, Stop: 124.55
Position: - Short at 124.00
Target: - 122.20
Stop: - 124.55
New strategy :
Hold short entered at 124.00, Target: 122.20, Stop: 124.55
Position: - Short at 124.00
Target: - 122.20
Stop:- 124.55
Although the single currency has rebounded again after finding support at 123.50 yesterday, as long as indicated resistance at 124.55 holds, further consolidation would take place with mild downside bias for a test of support at 122.92-98, break there would suggest a temporary top is possibly formed, bring further fall to 122.60 but break of 122.00-10 is needed to add credence to this view, bring retracement of recent upmove to 121.50 first.
In view of this, we are holding on to our short position entered at 124.00. Above said resistance at 124.55 would abort and signal recent upmove is still in progress and may extend further gain towards 125.00 level but loss of upward momentum should prevent sharp move beyond 125.40-50, risk from there is seen for another retreat later.
Our latest preferred count is that wave (ii) is ABC-X-ABC which ended at 123.33 and wave (iii) is unfolding with wave iii ended at 100.77, followed by wave iv at 111.57 and wave v as well as the wave (iii) has ended at 97.04, followed by wave (iv) at 111.43 and wave (v) has ended at 94.12 which is also the end of the larger degree v, this also implied the major wave (C) has also ended there, hence major correction has commenced from there with (A) leg unfolding in its lower degree wave c which has possibly ended at 145.69. Under this count, A-B-C wave (B) has commenced with A leg ended at 136.23, wave B at 143.79 and wave C has possibly ended at 149.79.
Our larger degree count is that the decline from 139.26 is wave (C) and is sub-divided into a diagonal triangle i-ii-iii-iv-v with wave i - 105.44, wave ii- 123.33, wave iii - 97.03, wave iv - 111.43, followed by the final wave v as well as the end of wave (C) at 94.12, this also mark the bottom of larger degree wave B. Under this count, major rise in wave C has commenced as an impulsive wave with minor wave III ended at 145.69, wave V is still in progress for further gain to 150.00. Having said that, this so-called wave V could well be the first leg of larger degree 5-waver wave C and this wave C should bring at least a retest of wave A top at 169.97 (July 2008).
Daily Technical Analysis: GBP/USD Super Thursday Event – Running Flat Top Ascending Pattern
The main focus today is BOE interest rate decision with monetary policy summary. This is called Super Thursday event and I expect it to be very volatile. The event is scheduled for 11 AM GMT. The BOE will also present its quarterly inflation report which has been updated. We might see two-way price movement.
The pattern that is formed is called - running flat top ascending triangle. It is a running pattern because the apex of the triangle has not been established yet. This suggest two way price movement, that could be also fueled with Balance of Trade date today. There are two zones traders should focus on at this point.1.2995 is a strong resistance and a break of 1.2995 (D H5, ATR high) may target 1.3025 to 1.3050 - Weekly H3 camarilla pivot and round number resistance. Break of lower zone (D L3, ATR pivot) 1.2916 might target even 1.2825 level - Weekly L5 camarilla. I suggest you use VPS tool in the case you want to trade GBP/USD today.
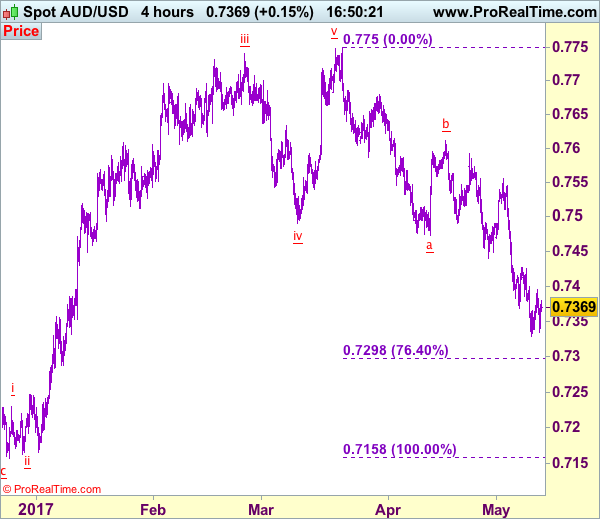
Trade Idea: AUD/USD – Buy at 0.7300
AUD/USD – 0.7368
Recent wave: Wave 5 ended at 1.1081 and major correction has commenced for fall to 0.7000 and then towards 0.6500-10
Trend: Near term down
Original strategy :
Buy at 0.7300, Target: 0.7500, Stop: 0.7240
Position: -
Target: -
Stop: -
New strategy :
Buy at 0.7300, Target: 0.7500, Stop: 0.7240
Position: -
Target: -
Stop:-
Although aussie’s recovery from 0.7329 suggests minor consolidation above this level would be seen, reckon 0.7400 would limit upside and bring another decline later, below said support at 0.7329 would extend one more fall to 0.7295-00 (76.4% retracement of 0.7158-0.7750), however, loss of downward momentum should prevent sharp fall below there and bring rebound later, above 0.7425-30 would bring subsequent gain to 0.7490-00 but break of 0.7510 is needed to signal low is formed, then test of resistance at 0.7556 would follow.
In view of this, we are inclined to turn long on next decline. Below 0.7245-50 would risk weakness to 0.7200-10, however, reckon previous support 0.7158 would contain downside and aussie may stage another strong rebound from there later this week.
On the 4-hour chart, the move from 0.8066 is the wave 5 with i: 0.8860, ii: 0.8315, wave iii is an extended move ended at 1.0183, iv: 0.9706 and wave v has ended at 1.1081 (also the top of entire wave 5). The subsequent selloff is the major correction which is unfolding as ABC-X-ABC and 2nd A leg has ended at 0.8848, followed by a-b-c wave B which ended at 0.9758, hence, 2nd C wave is now in progress and indicated downside target at 0.7000 and 0.6950 had been met, so further fall to 0.6710-20 cannot be ruled out.