
Sample Category Title
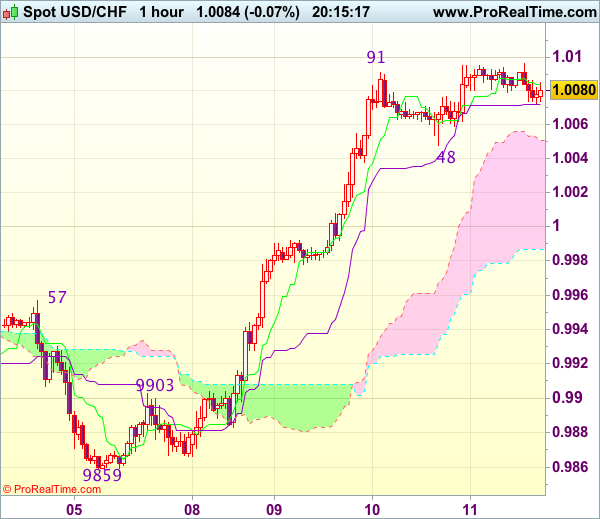
Trade Idea Update: USD/CHF – Buy at 1.0015
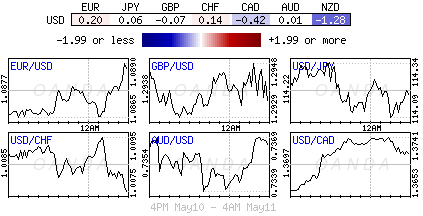
USD/CHF - 1.0088
Original strategy :
Buy at 1.0015, Target: 1.0115, Stop: 0.9980
Position : -
Target : -
Stop : -
New strategy :
Buy at 1.0015, Target: 1.0115, Stop: 0.9980
Position : -
Target : -
Stop : -
As the greenback has continued trading with a firm undertone after this week’s rally, adding credence to our view that recent upmove is still in progress and may extend further gain to previous resistance at 1.0108, break there would confirm resumption of early rise and encourage for headway to 1.0130 and then 1.0150-55 which is likely to hold from here due to loss of near term upward momentum.
In view of this, would not chase this rise here and we are looking to buy dollar on pullback as 1.0010-15 should limit downside. Only below previous resistance at 0.9957 would defer and suggest top is possibly formed, bring test of 0.9920-25 but break of previous resistance at 0.9903 is needed to add credence to this view, bring further fall to 0.9880-85.
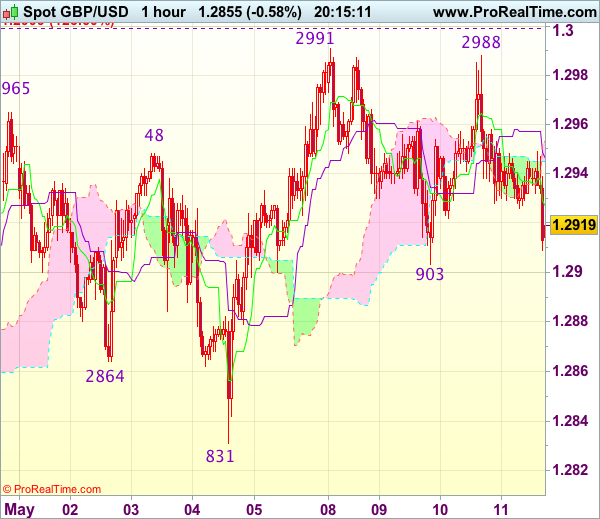
Trade Idea Update: GBP/USD – Sell at 1.2900
GBP/USD - 1.2858
New strategy :
Sell at 1.2900, Target: 1.2800, Stop: 1.2935
Position : -
Target : -
Stop : -
As cable has dropped below support at 1.2903 (now resistance) on dovish BOE, signaling top is formed at 1.2991 earlier and consolidation with downside bias is seen for further fall to 1.2831 support, break there would add credence to this view and extend the fall from 1.2991 top to 1.2805 and later towards 1.2770 but reckon previous support at 1.2757 would hold from here.
In view of this, we are looking to sell cable on recovery as said resistance at 1.2903 should limit upside and bring another decline. Above 1.2930-35 would risk test of 1.2950-60 but break there is needed to signal low is formed, bring another bounce towards 1.2988-91 resistance but break of 1.2999-00 (1.236 times projection of 1.2109-1.2616 measuring from 1.2365 and psychological resistance) is needed to revive bullishness.
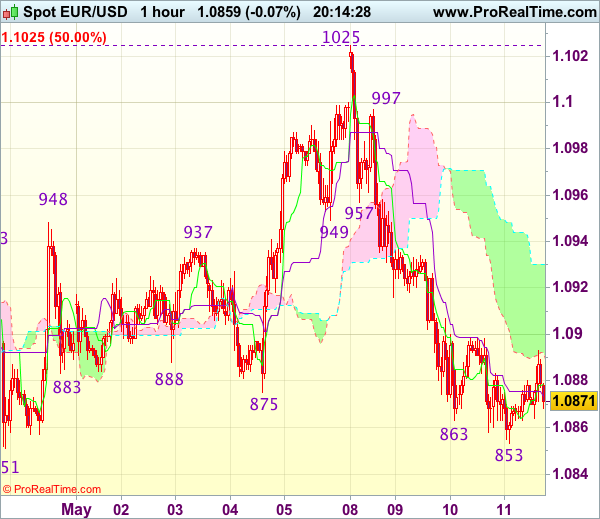
Trade Idea Update: EUR/USD – Sell at 1.0930
EUR/USD - 1.0850
Original strategy :
Sell at 1.0955, Target: 1.0855, Stop: 1.0990
Position : -
Target : -
Stop : -
New strategy :
Sell at 1.0930, Target: 1.0820, Stop: 1.0965
Position : -
Target : -
Stop : -
As the single currency has remained under pressure after this week’s selloff, adding credence to our view that the fall from 1.1025 top is still in progress, hence bearishness remains for this decline to bring at least a strong retracement of early upmove towards 1.0825-30, then 1.0800 but reckon 1.0770-75 would hold from here due to near term overbought condition.
In view of this, we are looking to sell euro on recovery as 1.0930-35 should limit upside. Above 1.0955-60 would defer and risk a stronger rebound but still reckon upside would be limited to resistance at 1.0997 and price should falter below this week’s high at 1.1025.
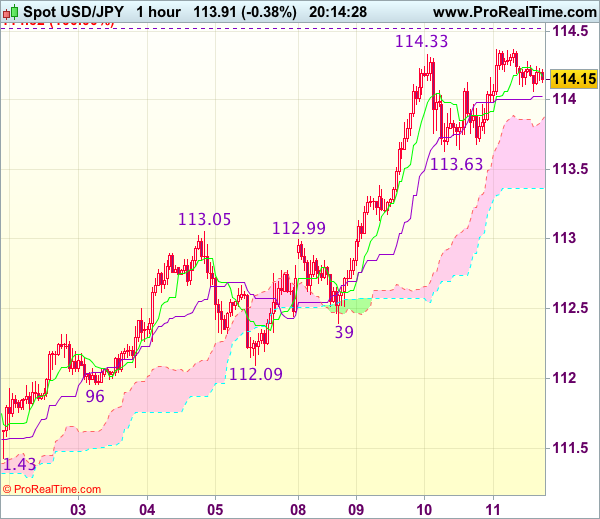
Trade Idea Update: USD/JPY – Buy at 113.40
USD/JPY - 113.92
Original strategy :
Buy at 113.40, Target: 114.45, Stop: 113.05
Position : -
Target : -
Stop : -
New strategy :
Buy at 113.40, Target: 114.45, Stop: 113.05
Position : -
Target : -
Stop : -
As the greenback has maintained a firm undertone after this week’s rally, suggesting recent upmove is still in progress and may extend further gain to 114.50-55 (100% projection of 108.13-111.78 measuring from 110.87), however, near term overbought condition should limit upside to 114.75-80 and price should falter below 115.00, risk from there has increased for a retreat to take place later.
In view of this, would not chase this rise here and would be prudent to buy dollar on pullback as 113.35-40 should contain downside. Only below previous resistance at 113.05 would defer and suggest top is formed, bring correction of recent upmove to 112.70-80 but reckon support at 112.39 would remain intact.
CAC Flat Ahead of French Nonfarm Payrolls, German GDP
The CAC is unchanged in the Thursday session, as the index is trading at 5,396.80. On the release front, there are no eurozone or French economic releases on the schedule. The EU released its Spring 2017 Economic Forecast, which presented a generally optimistic picture of the economies of eurozone members. In the US, PPI is expected to show a slight gain of 0.2%. On Friday, Germany releases Preliminary GDP. It will be a busy day in the US, which will publish retail sales and CPI reports.
The eurozone economy received a passing grade on Thursday, as the European Commission released its Spring 2017 Economic Forecast. The report noted that the European economy is in its fifth year of recovery, and forecast eurozone GDP growth of 1.7% in 2017 and 1.8% in 2018. On the inflation front, the report stated that inflation had risen in recent months, but this was mainly due to an increase in oil prices. Still, inflation was expected to reach 1.6% in 2017 and 1.3% in 2018, compared to just 0.2% in 2016. Stronger growth has led to lower unemployment, and the report projected that eurozone unemployment rate would drop to 9.4% in 2017 and 8.9% in 2018. The report reiterated what ECB president Mario Draghi has long been saying, namely, that risks to the eurozone economy remain tilted to the downside. These risks include US economic and trade policy under President Trump, the banking sector in Europe and the UK's exit from the EU. This forecast is considerably more optimistic than the Winter 2017 forecast, as is apparent from the captions in the press releases for these two reports: The Winter forecast was entitled "Navigating through choppy waters", while the caption for the Spring forecast reads "Steady growth ahead".
Anytime Mario Draghi is talking, the markets are all ears. The ECB president spoke about monetary policy before a Dutch parliamentary committee, but there was nothing new in his remarks. Draghi reiterated that the ECB continues to monitor growth and inflation levels, but has no plans at present to modify its monetary policy. Draghi said that that central bank would tighten its policy once the "tail risks" of a drop in inflation receded and growth improved. Currently, the ECB is making monthly purchases of EUR 60 billion under its asset-purchase scheme, which is scheduled to expire in December. Inflation levels were higher in the first quarter, which led to calls for Draghi to tighten policy. However, the ECB was reluctant to make any moves during the French election campaign, and this aversion could continue, with Germany holding elections in September. The central bank appears satisfied with the status quo, and can be expected to hold course, unless eurozone growth and inflation levels climb sharply.
Donald Trump has been embroiled in a number of controversies in his short presidency, but the political earthquake he has now stirred could become political quicksand for the new president. Trump abruptly fired FBI director James Comey on Tuesday, stunning lawmakers on both sides of the aisle in Congress. Comey, who has been conducting an investigation into possible collusion between Trump and Russia during the presidential campaign, clearly has been a thorn in Trump's side. The White House has claimed that it fired Comey over his handling of an email scandal involving Hillary Clinton, but the move has been roundly condemned by the Democrats, and some key Republicans have also voiced opposition as well. The firestorm could heat up further, with calls in Congress to appoint a special prosecutor into Trump's connections with Russia. Has Trump gone one step to far? This latest controversy could cause some jitters among investors and hurt the US dollar.
NZ Dollar Struggles after Reserve Bank of New Zealand Holds Rates
- NZ Dollar struggles after Reserve Bank of New Zealand holds rates
- Markets await Bank of England interest rate decisions
The New Zealand Dollar depreciated against its major counterparts after the Reserve Bank of New Zealand (RBNZ) held rates unchanged in May as widely expected. While that was priced in, recent positive economic news flow out of the nation has helped build interest rate hike expectations. In particular, the unemployment rate fell to 4.9% in the first quarter and Consumer Price Index (CPI) reached 2.2% year-on-year in the fourth quarter of 2016. The central bank practically dismissed those hopes, mentioning recent CPI gains as temporary. Central Bank Governor Wheeler stated that wages had not risen significantly and that he did not see inflationary pressures as being a concern. He stated that the RBNZ remains neutral and that interest rates should stay at current levels for the foreseeable future.
The Pound will be in focus this morning, with the release of the May quarterly inflation report and the Monetary Policy Committee's (MPC) policy decision. Analysts expect policy to remain unchanged, however, there is growing chatter that another member of the MPC may vote for a hike in rates. A 6-2 vote would not be a surprise, with Saunders expected to have joined Forbes in voting for a hike. Consumer Spending and Gross Domestic Product (GDP) data have been disappointing, however, recent Purchasing Managers' Index (PMI) data has been encouraging, helping Sterling along, which has been gently squeezing higher since the call for a snap election. If the Bank of England is remotely hawkish in the press conference, expect Sterling to continue its rise.
Later this afternoon, there is a smattering of US data, including Producer Price Index (PPI) and Jobless Claims, which are unlikely to be market moving. Attention will then turn to tomorrow's important retails sales data.
Films plots badly explained
Inception
A series of naps
Shrek
A guy learns to love a girl without her Instagram filters
The Martian
Billions of Dollars in subsidies for a potato farmer
Batman Versus Superman
Paranoid billionaire afraid of immigrant
(BOE) Bank Rate Held at 0.25%, Government Bond Purchases at £435bn and Corporate Bond Purchases at up to £10bn
The Bank of England's Monetary Policy Committee (MPC) sets monetary policy to meet the 2% inflation target, and in a way that helps to sustain growth and employment. At its meeting ending on 10 May 2017, the Committee voted by a majority of 7-1 to maintain Bank Rate at 0.25%. The Committee voted unanimously to maintain the stock of sterling non-financial investment-grade corporate bond purchases, financed by the issuance of central bank reserves, at £10 billion. The Committee also voted unanimously to maintain the stock of UK government bond purchases, financed by the issuance of central bank reserves, at £435 billion.
As the MPC observed at the time of the United Kingdom's referendum on EU membership, the appropriate path for monetary policy depends on the evolution of demand, potential supply, the exchange rate, and therefore inflation. Aggregate demand slowed markedly in 2017 Q1, and the MPC's central projection contained in the May Inflation Report is now for quarterly growth to remain around current rates, and close to trend. The slowdown appears to be concentrated in consumer-facing sectors, partly reflecting the impact of sterling's past depreciation on household income and spending. The Committee judges that consumption growth will be slower in the near term than previously anticipated before recovering in the latter part of the forecast period as real income picks up.
In the MPC's central forecast, weaker consumption this year is largely balanced by rising net trade and investment. The outlook for global activity continues to improve. Business surveys and Bank Agents' reports imply that business investment growth is likely to be higher in 2017 than previously projected. The stronger global outlook and the level of sterling are providing incentives for many exporters to renew and increase capacity.
Sterling appreciated by 2.5% between the February and May Inflation Reports, although it remained 16% below its November 2015 peak. Over the same time period, shorter-term UK interest rates fell, with the sterling yield curve used to condition the forecast close to its lowest level since the start of the year.
CPI inflation has risen above the MPC's 2% target as the depreciation of sterling has begun to feed through to consumer prices. This impact has been offset to some extent by continued subdued growth in domestic costs. In particular, wage growth has been notably weaker than expected. The MPC expects inflation to rise further above the target in the coming months, peaking a little below 3% in the fourth quarter. Conditioned on the market yield curve underlying the May projections, inflation is forecast to remain above the MPC's target throughout the forecast period. The projected overshoot entirely reflects the effects of the falls in sterling since late November 2015 on import prices. This effect is expected to diminish towards the end of the forecast period. With unemployment falling to its estimated equilibrium rate, however, wage growth is expected to recover significantly, and the drag from domestic costs to lessen, over the same period.
Monetary policy cannot prevent either the necessary real adjustment as the United Kingdom moves towards its new international trading arrangements or the weaker real income growth that is likely to accompany that adjustment over the next few years. Attempting to offset fully the effect of weaker sterling on inflation would be achievable only at the cost of higher unemployment and, in all likelihood, even weaker income growth. For this reason, the MPC's remit specifies that, in such exceptional circumstances, the Committee must balance any trade-off between the speed at which it intends to return inflation sustainably to the target and the support that monetary policy provides to jobs and activity.
In the MPC's latest projections there is such a trade-off through most of the forecast period, with a degree of spare capacity and inflation remaining above the 2% target. In the final year of the forecast, however, the output gap closes and inflation rises slightly further above the target. This is conditioned on the assumptions that the adjustment to the United Kingdom's new relationship with the European Union is smooth, and that Bank Rate follows the market-implied path for interest rates. At its May meeting, seven members thought that the current monetary policy setting remained appropriate to balance the demands of the Committee's remit. Kristin Forbes considered it appropriate to increase Bank Rate by 25 basis points.
As the Committee has previously noted, there are limits to the extent to which above-target inflation can be tolerated. The continuing suitability of the current policy stance depends on the trade-off between above-target inflation and slack in the economy, as well as the prospects for inflation to return sustainably to target. These projections depend importantly on three main judgements: that the lower level of sterling continues to boost consumer prices broadly as projected, and without adverse consequences for inflation expectations further ahead; that regular pay growth remains modest in the near term but picks up significantly over the forecast period; and that more subdued household spending growth is largely balanced by a pickup in other components of demand.
In judging the appropriate policy stance, the Committee will be monitoring closely the incoming evidence regarding these and other factors. Monetary policy can respond in either direction to changes to the economic outlook as they unfold to ensure a sustainable return of inflation to the 2% target. On the whole, the Committee judges that, if the economy follows a path broadly consistent with the May central projection, then monetary policy could need to be tightened by a somewhat greater extent over the forecast period than the very gently rising path implied by the market yield curve underlying the May projections.
Kiwi Dollar Crash Lands, Loonie Burnt
Global equities have continued their upward momentum as volatility takes a back seat after Macron victory in France's Presidential election, corporate earnings and U.S data has maintained positive sentiment about economic growth.
Amongst signs of a strengthening U.S labor force, investors are paying closer attention to comments from Fed officials for clues on the path for interest rates this year. The odds for a June hike are already baked in, but where to from there?
The Kiwi dollar crashed, falling more than -1.5% as the Reserve Bank of New Zealand (RBNZ) fails to live up to expectations, while Canada's loonie lost some of its shine after Moody's cut its credit ratings on six Canadian banks.
It's show time for the BoE – will sterling's double top £1.30 handle be penetrated today?
1. Global bourses hover near highs
Global stocks continue their advance, trading atop of their multi-year highs, supported mostly by a rebound in oil boosted energy producers.
In Japan, the broader Topix index rose +0.1%, while the Nikkei 225 climbed +0.3% aided by a weaker yen (¥114.11) helping exporters.
In China, the Shanghai Composite Index rallied +0.3%, the first positive day in seven sessions – investors continue to evaluate regulatory intervention in their financial markets.
In Hong Kong, the Hang Seng added +0.5%, while in New Zealand, the S&P/NZX 50 surged +0.9% to its highest level in 10-months on an unexpected ‘dovish' RBNZ (see below).
In Europe, the Stoxx Europe 600 fell -0.1%, after gaining +0.2% yesterday to its highest level in two-years. The FTSE is seeking guidance from today's BoE rate announcement.
U.S stocks are set to open in the red (-0.1%).
Indices: Stoxx50 -0.1% at 3641, FTSE flat at 7386, DAX flat at 12763, CAC-40 +0.1% at 5404, IBEX-35 -0.7% at 10961, FTSE MIB +0.2% at 21603, SMI +0.2% at 9107, S&P 500 Futures -0.1%.
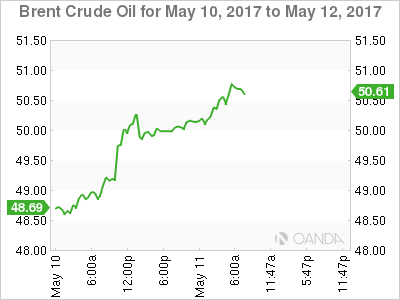
2. Oil up on falling U.S inventories, Saudi cuts to Asia
Ahead of the U.S open, oil prices remain better bid after yesterday's U.S data recorded a larger than expected fall in inventories and as the Saudi's announced a bigger than expected cut in supplies to Asia.
Brent futures are up +30c at +$50.52 a barrel, while U.S light crude (WTI) is up +35c at +$47.68.
U.S EIA data showed that crude inventories fell -5.2m barrels in the week to May 5, and at +522.5m barrels, crude stocks were the lowest since February.
Also tightening the market is Saudi Aramco announcement that they will reduce supplies to Asian customers by about -7m barrels in June.
Capping price gains is higher crude output from the U.S, particularly shale producers.
Note: OPEC meets on May 25 to decide on production policy for H2, 2017. The market expects the group to extend cuts until at least the end of the year.
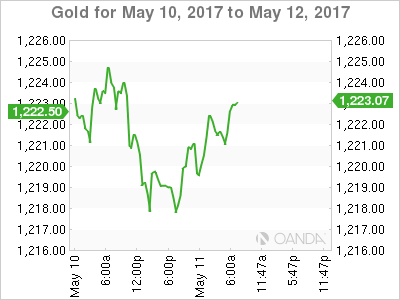
Gold (+0.2% to +$1,222.02) is steady ahead of the open, holding just above its two month low (+$1,2212) hit earlier this week, as the U.S dollar and stocks firm on expectations of a June rate hike.
3. BoE's 'Super Thursday'
It's the trifecta of events from the BoE today – rate announcement, quarterly inflation report and minutes (07:00 am GMT). Thirty minutes later (07:30 am GMT), Governor Carney will give a press conference.
The market consensus expects the BoE to revise higher its inflation outlook for the year and keep the benchmark rate unchanged at +0.25%. However, Governor Carney is bound to talk down expectations for a rate increase anytime soon. Fixed income dealers will be focusing on whether more than one person among those voting calls for a rate increase.
Elsewhere, Fed member turned ‘hawk' Eric Rosengren has warned that the central bank was in danger of lifting its foot off the policy accelerator too slowly, and called for more aggressive action to prevent the economy from overheating.
Dallas President Kaplan said his base-case for rate hikes this year is still three, but indicated that he's 'very cognizant' of the fact inflation pressures have been more muted.
The yield on U.S 10's has fallen -2 bps to +2.40%, after rising for the past three sessions. In New Zealand, its equivalent benchmark yield slipped -5bps to +3.02% on a ‘dovish' RBNZ (see below).
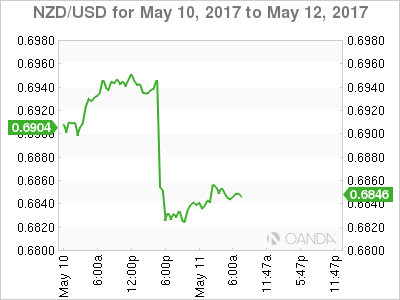
4. Kiwi Dollar Crash Lands, loonie burnt
NZD (N$0.6844) was ‘burnt' overnight, falling -1.5% outright, its lowest print in 11-months, when the RBNZ failed to promote the idea that it will raise interest rates this year (+1.75%).
Governor Wheeler suggested that the next move would be up, but not until the end of 2019. Markets had been pricing in tightening commencing in early 2018. The Governor cited 'extensive political uncertainty' around U.S trade and economic policy among reasons for holding rates steady.
Elsewhere, the loonie has lost its way in the overnight session with USD/CAD rallying +70 pips to a high print of C$1.3740 after Moody's cut its rating on Canada's top banks. However, CAD has found some support from the energy sector, capping those gains (C$1.3702) ahead of the U.S open.
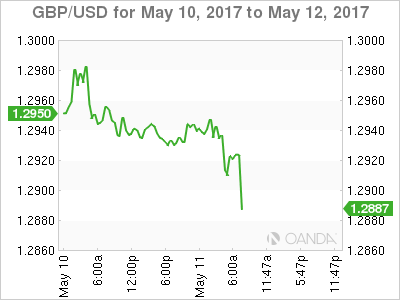
Ahead of the BoE rate announcement, the GBP (£1.2911) is weaker following data misses for March production data and wider trade deficits (see below). Next move depends on how ‘hawkish' members are.
5. U.K Industrial output disappoints, trade deficit widens
U.K. industrial production contracted in March (-0.5% vs. -0.4e m/m) as manufacturing output declined unexpectedly and unseasonably warm temperatures reduced demand for energy. Compared with the same month last year, industrial output was up +1.4%, missing market expectations of +1.9% growth.
Manufacturing output also disappointed, it declined by -0.6% versus market consensus of no change. Annual growth in manufacturing also missed expectations, with factory output growing by +2.3% vs. +2.5%e.
Other data also showed that the U.K's trade deficit (-£5.7B in Q1) with the world widened in March.
Daily Technical Analysis: EURUSD, GBPUSD, USDJPY, USDCHF
EURUSD
The EURUSD was indecisive yesterday. The bias remains bearish in nearest term testing 1.0850 key support which is a good place to buy with a tight stop loss as a clear break below that area would expose the pre-gap level at 1.0730 and the trend line support area as you can see on my H1 chart below. Immediate resistance remains around 1.0905 (H1 EMA 200). A clear break back above that area would give another chance to the bullish scenario testing 1.0950 or higher. Overall I remain neutral.
GBPUSD
The GBPUSD had another indecisive movement yesterday. The bias remains neutral in nearest term. Overall I still prefer a bullish scenario at this phase, but we have a triple top formation as you can see on my H1 chart below, which is not a good sign for the bullish trend. We need a clear break above 1.2985 to continue the bullish scenario. Immediate support is seen around 1.2900. A clear break below that area could trigger further bearish pressure testing 1.2865 – 1.2830 support area which remains a good place to buy with a tight stop loss.
USDJPY
The USDJPY attempted to push lower yesterday bottomed at 113.62 but closed higher at 114.28. The bias remains bullish in nearest term testing 115.00 area. Immediate support is seen around 114.00. A clear break below that area could lead price to neutral zone in nearest term testing 113.60 which is a good place to buy with a tight stop loss. Overall I still prefer a bullish scenario at this phase as a part of the bullish continuation scenario after broke above the trend line resistance as you can see on my H4 chart below.
USDCHF
The USDCHF was indecisive yesterday but overall still able to maintain its bullish bias since broke above the trend line resistance as you can see on my H4 chart below. The bias remains bullish in nearest term testing 1.0170 area. Immediate support is seen around 1.0050. A clear break below that area could lead price to neutral zone in nearest term as direction would become unclear. Overall I remain neutral.
DAX Shrugs Off Stronger German Inflation Report, German GDP Next
The DAX index continues to have a quiet week and is almost unchanged in the Thursday session. Currently, the DAX is trading at 12,765.00. On the release front, there are only a few events on the schedule. German WPI posted a gain of 0.3%, beating the estimate of 0.1%. The EU released its Spring 2017 Economic Forecast, which presented a generally optimistic picture of the economies of EU members. In the US, PPI is expected to show a slight gain of 0.2%, and unemployment claims is forecast to climb to 245 thousand. On Friday, Germany releases Preliminary GDP. It will be a busy day in the US, which will publish retail sales, CPI and consumer confidence.
ECB President Mario Draghi addressed a Dutch parliamentary committee on Tuesday, and reiterated that the ECB continues to monitor growth and inflation levels, but has no plans at present to modify its monetary policy. Draghi said that that central bank would tighten its policy once the “tail risks” of a drop in inflation receded and growth improved. Currently, the ECB is making monthly purchases of EUR 60 billion under its asset-purchase scheme, which is scheduled to expire in December. Inflation levels were higher in the first quarter, which led to calls for Draghi to tighten policy. However, the ECB was reluctant to make any moves during the French election campaign, and this aversion could continue, with Germany holding elections in September. Bottom line? We can expect the ECB to hold course, unless eurozone growth and inflation levels climb sharply.
The eurozone has posted stronger numbers in the first quarter, and this has included industrial better production and manufacturing numbers in Germany. Industrial production in March declined 0.4%, but this was just a blip, as industrial production in the first quarter posted a respectable gain of 1.6%. German Factory Orders came in at 1.0%, above the forecast of 0.7%. An improvement in global economic conditions has boosted the demand for German exports, notably cars and machinery. A weak euro has made European exports more attractive and helped boost the manufacturing sector. Germany releases Preliminary GDP for the first quarter on Friday, with the markets predicting a gain of 0.6%. A better than expected GDP report could shake the DAX out of its slumber and push the index to higher levels.
ECB Study Shows Eurozone Unemployment Higher than Official Data
Donald Trump's firing of FBI director James Comey has stunned political Washington. Trump has been embroiled in a number of controversies in his short presidency, but the political earthquake he has now stirred could become political quicksand. Comey, who has been conducting an investigation into possible collusion between Trump and Russia during the presidential campaign, clearly has been a thorn in Trump's side. The White House has claimed that it fired Comey over his handling of an email scandal involving Hillary Clinton, but the move has been roundly condemned by the Democrats, and some key Republicans have also voiced opposition as well. The firestorm could heat up further, with calls in Congress to appoint a special prosecutor into Trump's connections with Russia. Has Trump gone one step to far? If this controversy continues, jittery investors could send stock markets to lower levels.