
Sample Category Title
EUR/CHF Daily Outlook
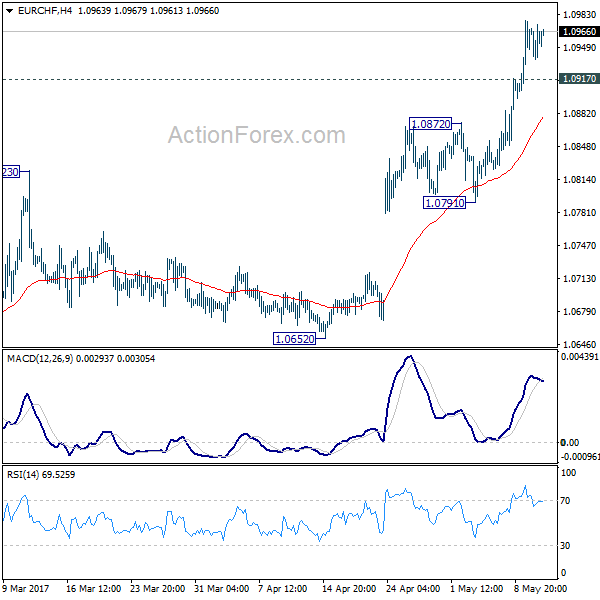
Daily Pivots: (S1) 1.0942; (P) 1.0958; (R1) 1.0978; More...
Intraday bias in EUR/CHF remains on the upside for 1.0999 resistance first. As noted before, the consolidative pattern from 1.1198 should be completed. Break of 1.0999 will pave the way for a retest on 1.1198 high. On the downside, below 1.0917 minor support will turn bias neutral and bring consolidation. But retreat should be contained by 1.0791/0872 support zone to bring rise resumption.
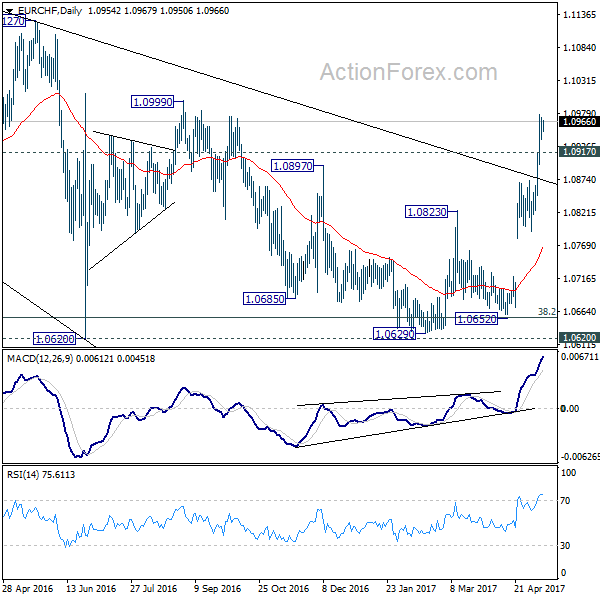
In the bigger picture, the price actions from 1.1198 are seen as a corrective move. Current strong rebound is raising the chance that it's completed after defending 38.2% retracement of 0.9771 to 1.1198 at 1.0653. Decisive break of 1.0999 resistance will target a test on 1.1198 high. For now, this will be the preferred case as long as 1.0791 support holds.
AUD/USD Daily Outlook
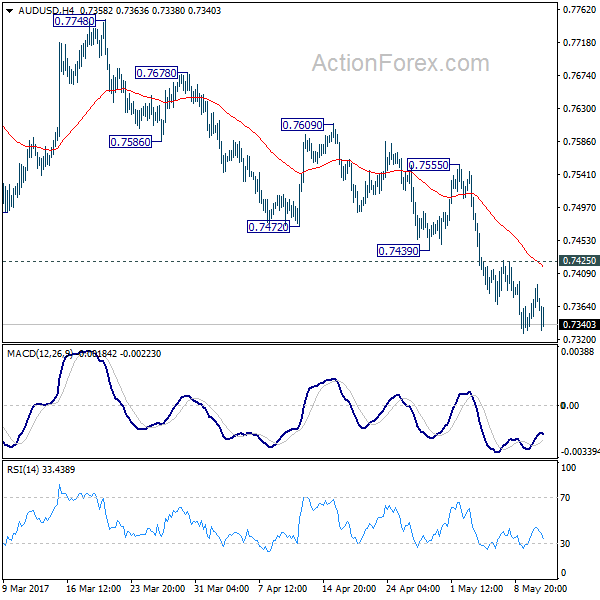
Daily Pivots: (S1) 0.7336; (P) 0.7365; (R1) 0.7393; More...
With 0.7425 minor resistance intact, intraday bias in AUD/USD remains on the downside. Current fall from 0.7748 is expected to target a test on 0.7144/7158 support zone. We'll be cautious on bottoming there as there is no clear sign of larger down trend resumption yet. On the upside, above 0.7425 minor resistance will turn bias neutral and bring consolidations first.
In the bigger picture, we're still treating price actions from 0.6826 low as a correction pattern. And, as long as 38.2% retracement of 0.9504 to 0.6826 at 0.7849 holds, long term down trend from 1.1079 is expected to resume sooner or later. Break of 0.6826 low will target 0.6008 key support level. However, firm break of 0.7849 will indicate that rise from 0.6826 is developing into a medium term rebound, rather than a sideway pattern. In such case, stronger rise should be seen to 55 month EMA (now at 0.8115) and above.
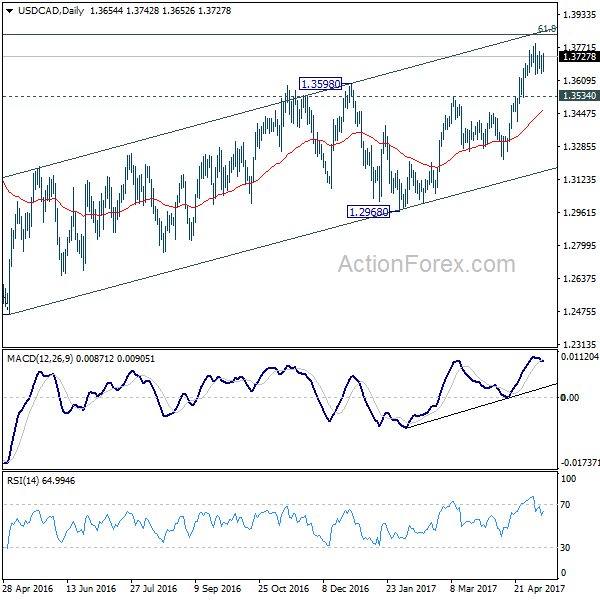
USD/CAD Daily Outlook
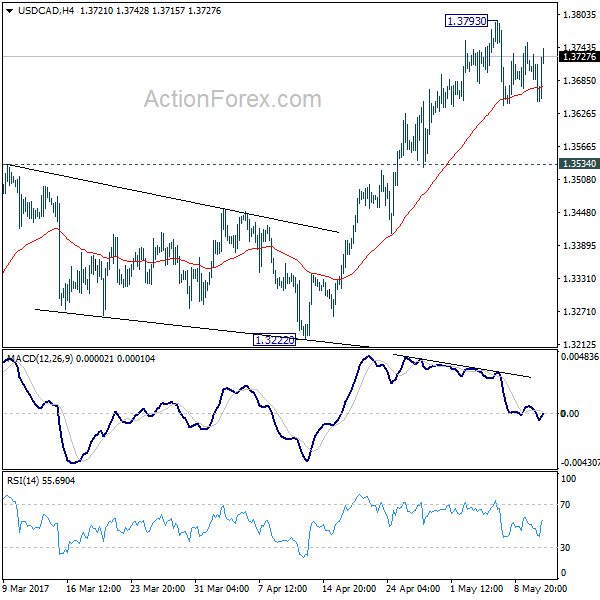
Daily Pivots: (S1) 1.3623; (P) 1.3677; (R1) 1.3708; More....
USD/CAD is trying to draw support from 4 hour 55 EMA and stays well above 1.3534 support. Intraday bias remains neutral and further rise cannot be ruled out yet. But rise from 1.2460 is seen as a corrective pattern. Hence, in case of another rally, we'll be cautious on topping at around 1.3838 fibonacci level. Meanwhile, consider bearish divergence condition in 4 hour MACD, break of 1.3534 support will argue that rise from 1.2968 is already completed. In such case, intraday bias will be turned back to the downside for 1.3222 support.
In the bigger picture, price actions from 1.4689 medium term top are seen as a correction pattern. The first leg has completed at 1.2460. Rise from 1.2460 is seen as the second leg and would end at around 61.8% retracement of 1.4689 to 1.2460 at 1.3838. Break of 1.3222 should indicate the start of the third leg while further break of 1.2968 should confirm. Nonetheless, sustained trading above 1.3838 would pave the way to retest 1.4689 high.
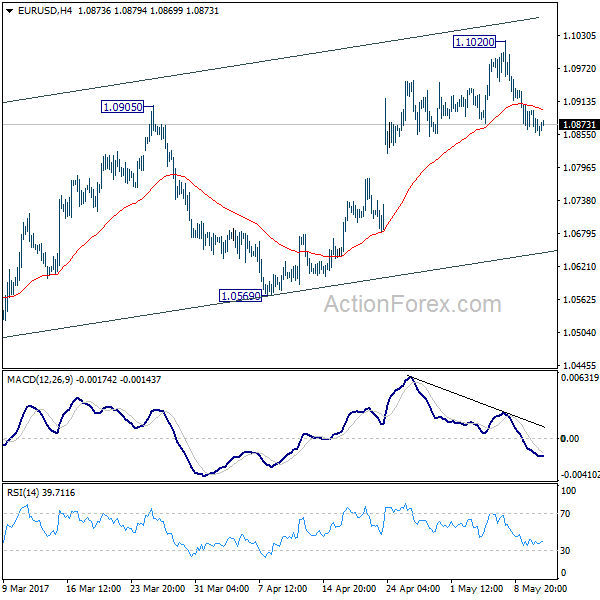
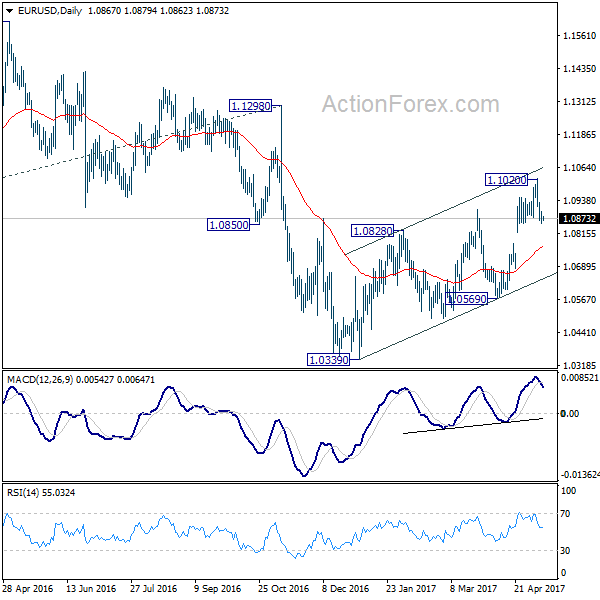
EUR/USD Daily Outlook
Daily Pivots: (S1) 1.0847; (P) 1.0873 (R1) 1.0892; More....
Intraday bias in EUR/USD stays on the downside at this point. With a short term top formed at 1.1020 on bearish divergence condition in 4 hour MACD, deeper decline should be seen to 55 day EMA (now at 1.0760) first. As noted before, rise from 1.0339 is seen as a corrective move. Break of 55 day EMA will affirm the case that such correction is completed and bring deeper decline to 1.0569 for confirmation. Above 1.1020 will extend such corrective rise instead.
In the bigger picture, as long as 1.1298 key resistance holds, whole down trend from 1.6039 (2008 high) is still expected to continue. Break of 1.0339 low will send EUR/USD through parity to 61.8% projection of 1.3993 to 1.0461 from 1.1298 at 0.9115. However, considering bullish convergence condition in weekly MACD, break of 1.1298 will indicate long term reversal.
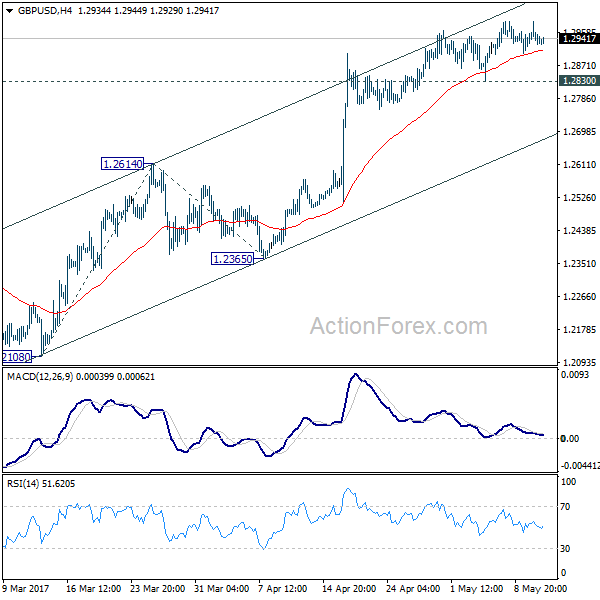
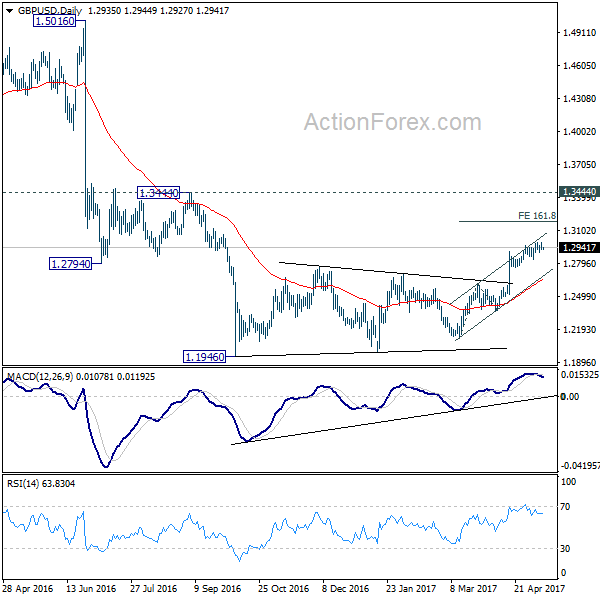
GBP/USD Daily Outlook
Daily Pivots: (S1) 1.2913; (P) 1.2950; (R1) 1.2974; More...
GBP/USD continues to lose upside moment as seen in 4 hour MACD. But there is no sign of topping yet. With 1.2830 minor support intact, further rise is still in favor to 161.8% projection of 1.2108 to 1.2614 from 1.2365 at 1.3184. At this point, price actions from 1.1946 are still interpreted as a correction pattern. Therefore, we'd expect strong resistance below 1.3444 to bring larger down trend resumption. On the downside, break of 1.2830 support will indicate short term topping. In such case, intraday bias will be turned back to the downside for 1.2614 support.
In the bigger picture, fall from 1.7190 is seen as part of the down trend from 2.1161. There is no sign of medium term reversal yet. Sustained trading below 61.8% projection of 2.1161 to 1.3503 from 1.7190 at 1.2457 will target 100% projection at 0.9532. Overall, break of 1.3444 resistance is needed to confirm medium term bottoming. Otherwise, outlook will remain bearish.
Market Morning Briefing: Dollar Strength
STOCKS
Dow (20943.11,-0.16%) has come off as expected and could test levels near 20780 in the near term before bouncing back from there. A test of higher levels near 21000 may be delayed for now.
Dax (12757.46, +0.07%) is all set to test 13000 as soon as possible. It is almost stable just now but could continue to move up in the coming sessions.
Shanghai (3043.97, -0.29%) is coming off as expected and could soon test 3000 on the downside. Near term looks bearish.
Nikkei (19929.27, +0.15%) has slowed down as it is heading towards important resistance levels near 20010. A rejection is expected in the next week.
Nifty (9407.30, +0.97%) made an intra-day high of 9415 yesterday, closing the day on a higher note. The 9400 resistance has shifted to 9500 and the 9460-9500 would be crucial levels to watch in the near term.
COMMODITIES
Muted price action has been seen in Gold (1220) as it is trading within the narrow trading band of 1220-31. If these levels hold on a closing basis then sideways consolidation within 1220-1260 continues. Need to keep a close watch on the price action in Dollar Index (99.47) which could give some cue on further Gold direction. We will remain bearish while it is trading below 1256-60 levels and a close below 1220 could open up 1186 levels as well.
Similar kind of trading pattern has been formed in Silver (16.23) also with a strong bearish bias. But as the scrip is highly oversold in near term chart, a possibility of a rise towards 17 levels can’t be ruled out.
Copper (2.50) is hovering around its crucial support of 2.48-50 and if these levels hold then we might see a bounce towards 2.60 regions. But we will remain bearish on copper while t is trading below 2.67-72 levels.
As we have mentioned in our yesterday’s morning briefing, a decrease (-5.2M Barrel) in U.S crude oil inventory had helped Brent (50.42) and WTI (47.53) to close higher. The current trading ranges for Brent and WTI are 49.50 – 51.40 and 47 – 49 respectively.
FOREX
Dollar strength prevails with the weakness in majors expected to continue.
Dollar Index (99.60) is gradually advancing towards our target of 100.00-50 with support coming up at 99.35-25.
This Dollar strength keeps the Yen (114.16) weak as Dollar Yen enjoys the higher levels without much selling pressure. As long as the pair trades above 113.30-10, the possibility of further rally towards 114.60-115.00 remains open.
Euro (1.0877) is yet to find its floor as the decline may extend to 1.0800 levels with the immediate upside capped at 1.0940-60.
Pound (1.2942) stands very quiet as it waits for the BOE interest rate decision today. Immediate resistance and support are modified to 1.3040 and 1.2860. Larger trend in the medium term remains up.
Aussie (0.7347) is finding it difficult to rise above 0.7400 as the trend remains firmly down. With the resistance of 0.7400-30 limiting the upside, the lower target of 0.7300 may be achieved in the next few sessions.
Dollar Rupee (64.62) met our near term target of 64.70-75 in the previous session. While a pause can be expected in the range of 64.40-75 digesting the recent gains, the pause may be followed by further rise towards 65.10-25 if a sustained move above 64.75 is seen.
INTEREST RATES
The US yields have moved up a bit. The 5Yr (1.93%), 10Yr (2.40%) and the 30Yr (3.03%) are up from levels near 1.90%, 2.38% and 3.00% respectively.
The German-US 2yr (-2.03%) has broken above the immediate support and may head lower indicating a fall in euro in the near term. In case this proves to be a false break, we would see an immediate rise back above -2% in the next couple of sessions.
The Japan-US 10Yr (2.35%) is slowly inching up and is pulling up Dollar yen along with itself. A rise towards 2.40% is possible leading Dollar-Yen towards 115 levels in the medium term.
The Japanese yields are all in a short term rally and looks bullish for the coming sessions
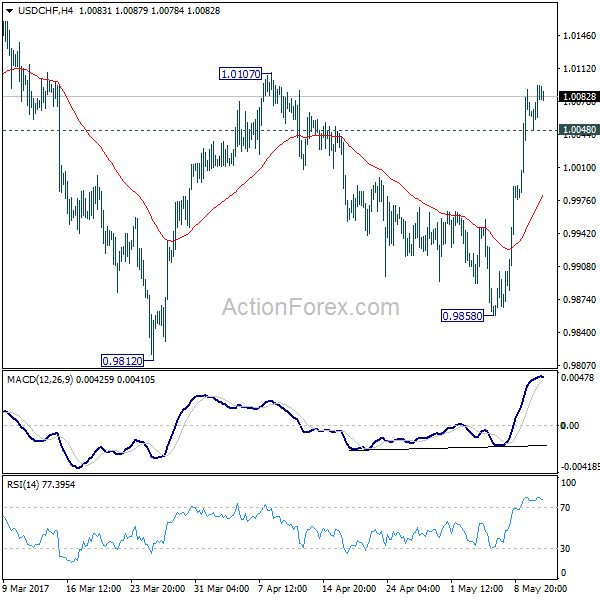
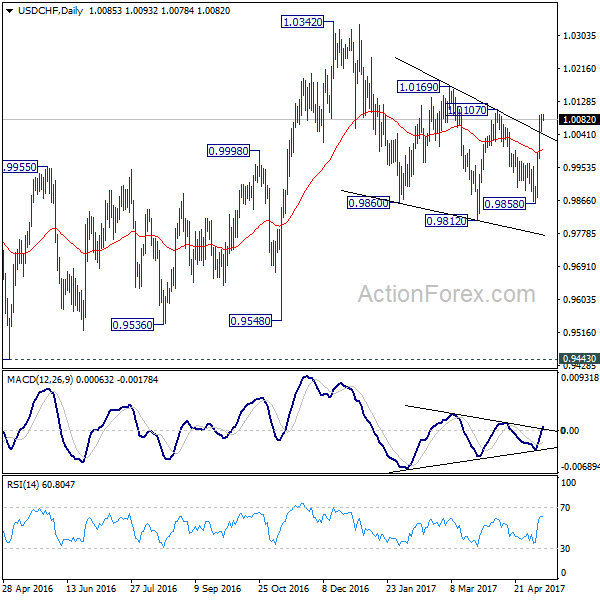
USD/CHF Daily Outlook
Daily Pivots: (S1) 1.0059; (P) 1.0077; (R1) 1.0105; More.....
Intraday bias in USD/CHF remains on the upside for the moment. Current rise from 0.9858 should target 1.0107 resistance next. As noted before, correction from 1.0342 should have completed at 0.9812. Break of 1.0107 should pave the way to retest 1.0342 high. On the downside, below 1.0048 minor support will turn bias neutral and bring consolidation first before staging another rise.
In the bigger picture, we're still maintaining that firm break of 1.0342 key resistance is needed to confirm underlying bullish momentum in the pair. However, the corrective nature of the fall from 1.0342 is starting to give the medium term outlook a bullish favor. Hence, in stead of looking for topping signal around 1.0342, we'd now pay closer attention to upside acceleration as USD/CHF approaches this level again.
Elliott Wave View: SPX Near Pullback
Short Term Elliott Wave view in SPX suggests the rally from 3/27 low (2322.2) is unfolding as a leading diagonal Elliott Wave structure where Minute wave ((i)) ended at 2378.36, Minute wave ((ii)) ended at 2328.95, Minute wave ((iii)) ended at 2398.16, and Minute wave ((iv)) ended at 2379.75. The Index has broken above previous Minute wave ((iii)) and thus it has met the minimum requirement in the number of swing to end cycle from 3/27 low as a leading diagonal. Although the cycle from 3/27 low is already mature, another leg higher can’t be ruled out as far as pullbacks stay above 2380. Near term, Minute wave (v) is proposed to be unfolding as a zigzag Elliott Wave structure where Minutte wave (a) ended at 2403.8 and Minutte wave (b) ended at 2392.4. While pullbacks stay above 2392.4, and more importantly above 2380, Index has scope to extend one more leg higher. We don’t like selling the Index and chasing the last leg higher here is also a bit risky. Expect cycle from 3/27 low to end soon with or without one more leg higher and Index to do larger degree pullback in 3, 7, or 11 swing to correct cycle from 3/27 low before the rally resumes.
SPX 1 Hour Elliott Wave Chart
USD/JPY Daily Outlook
Daily Pivots: (S1) 113.81; (P) 114.09; (R1) 114.56; More...
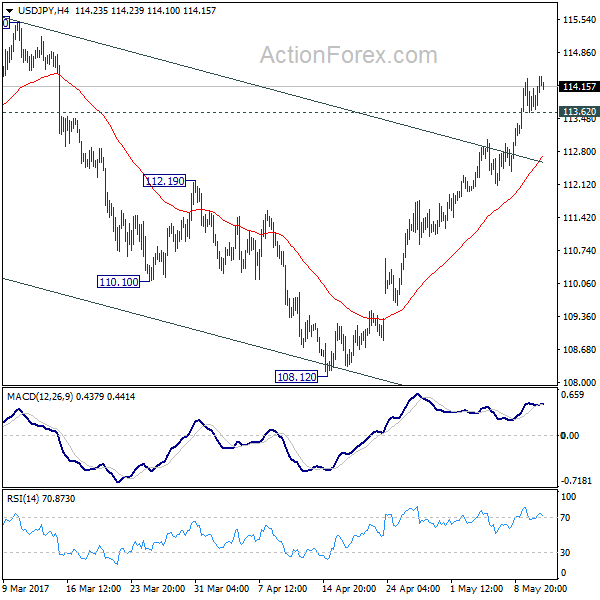
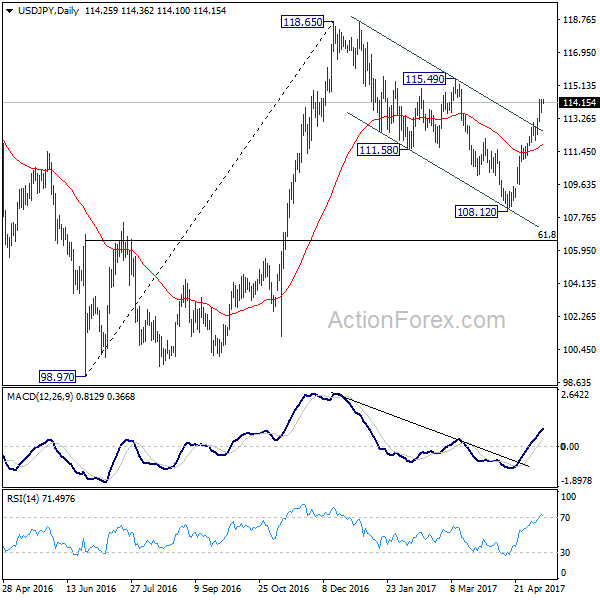
While upside momentum in USD/JPY remains unconvincing, there is no sign of topping yet. Intraday bias stays on the upside as current rise would target 115.49 resistance next. Outlook remains unchanged that correction from 118.65 has completed with three waves down to 108.12. Break of 115.49 will resume larger rally from 98.97 to 125.85 high. On the downside, below 113.62 minor support will turn bias neutral and bring consolidations before staging another rally.
In the bigger picture, price actions from 125.85 high are seen as a corrective pattern. It's uncertain whether it's completed yet. But in case of another fall, downside should be contained by 61.8% retracement of 75.56 to 125.85 at 94.77 to bring rebound. Meanwhile, break of 115.49 resistance will extend the rise from 98.97 to retest 125.85. Overall, rise from 75.56 is still expected to resume later after the correction from 125.85 completes.
New Zealand Dollar Dives Broadly on Dovish RBNZ, British Pound Firm ahead of BoE Super Thursday
New Zealand Dollar tumbles sharply today after RBNZ left official cash unchanged at 1.75% but issued a dovish statement. There were anticipations that the central bank would raise the outlook on inflation after Q1's figure. But instead, RBNZ Governor Graeme Wheeler said in the statement that the increase in headline inflation in Q1 was "temporary", mainly due to "higher tradables inflation, particularly petrol and food prices." Meanwhile, "non-tradables and wage inflation remain moderate but are expected to increase gradually." That will bring future headline inflation to midpoint of target band "over the medium term". And, longer-term inflation expectation remained "well anchored at around 2 percent". The OCR outlook was basically unchanged from the February MPS. And the implication is that OCR will be unchanged till at least early 2019 with chance of a rate hike later in that year.
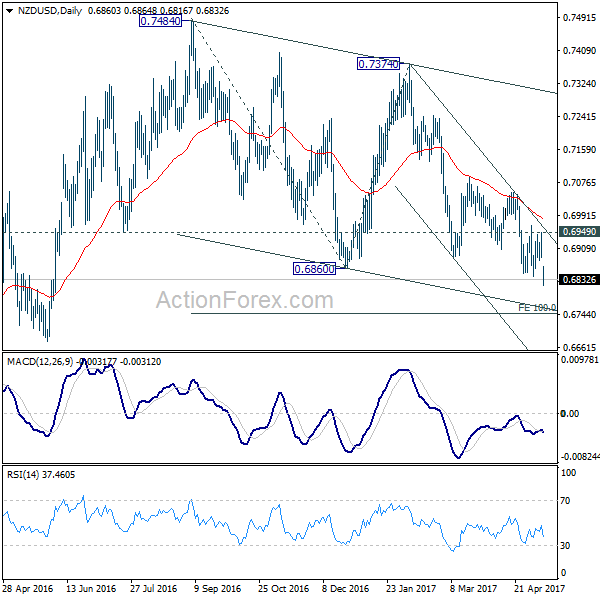
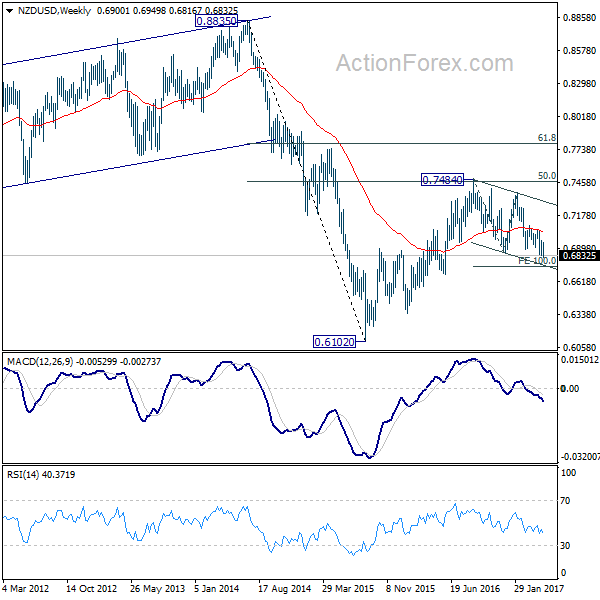
NZD/USD's drops to as low as 0.6816 so far and resumed recent decline from 0.7374 and 0.7484. Near term outlook will now stay bearish as long as 0.6949 resistance holds. Further fall should be seen to 100% projection of 0.7484 to 0.6860 from 0.7374 at 0.6750. At this point, we're slightly favoring the case that price actions from 0.6102 medium term bottom (2015 low) are developing into a corrective pattern. Hence, firm break of 0.6750 projection level will show downside acceleration and would pave the way back to retest 0.6102. We'll assess the outlook again when NZD/USD hits 0.6750.
Sterling firm ahead of BoE
Sterling is so far the second strongest major currency for the week, next to Dollar, as markets await BoE rate decision. Markets are speculating a mild hawkish twist in BoE's inflation outlook as CPI was back in target rate at 2.3% yoy in March. However, on the other hand, weaker than expected Q1 growth and uncertainties surrounding Brexit negotiation would keep policy makers on guard. The National Institute of Economic and Social Research said earlier that BoE won't change its monetary policies before conclusion of Brexit negotiation with EU. But it should be noted again that Sterling launched this round of rally against Dollar and Euro after Kristin Forbes surprised the markets by voting for a rate hike back in March. Currently, markets are pricing in less than 60% chance of any move by BoE before end of 2018. The pound would be given another boost if there is anything in today's announcements that suggests BoE would act earlier than that.
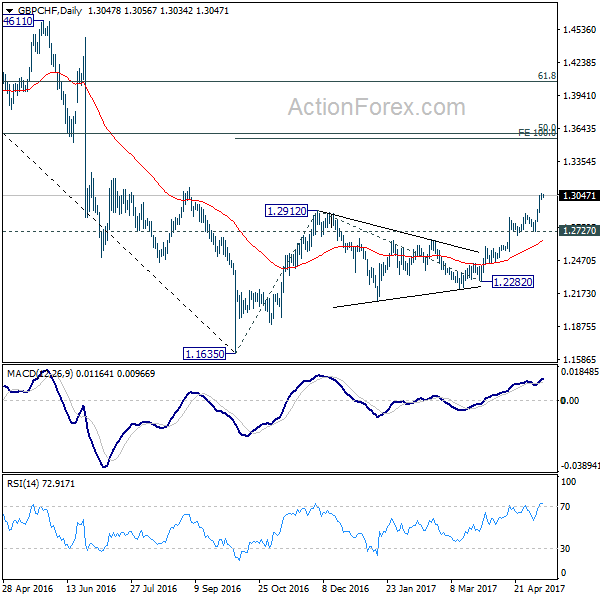
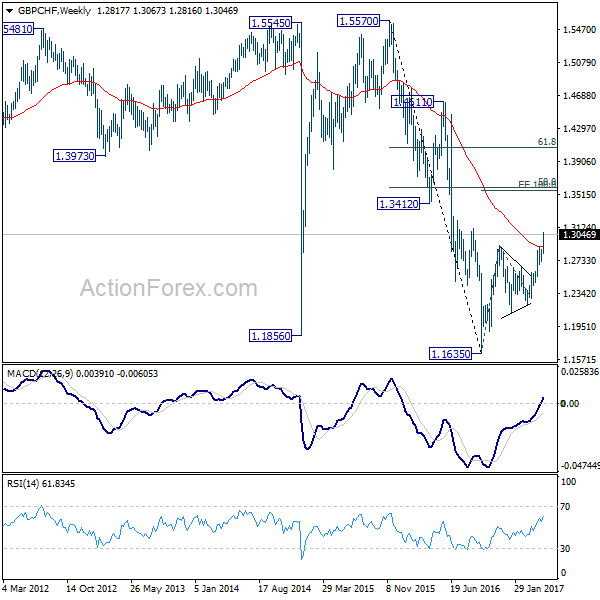
GBP/CHF is one of the top movers this week thanks to receding political risks in Europe after French election. The strong break of 1.2912 resistance confirmed resumption of the rebound from 1.1635 medium term bottom. The decisive break of 55 week EMA also indicates underlying strength. near term outlook will remain bullish as long as 1.2727 support holds. Current rise should target cluster level at 100% projection of 1.1635 to 1.2912 from 1.2282 at 1.3559 and 50% retracement of 1.5570 to 1.1635 at 1.3603. We'll look at the reaction from this 1.3559/3603 cluster level, and the structure of the rise from 1.1635, later to determine whether it's corrective of impulsive.
Boston Fed Rosengren mapped out more hawkish path
Boston Fed President Eric Rosengren mapped out a more hawkish policy path for Fed this year. He noted that Fed should hike three more times this year. In parallel, Fed should also start shrinking the balance sheet. That is, he doesn't advocate a "brief pause". Rosengren said that "along with a gradual reduction in the level of the balance sheet, it would still be reasonable to have three rate increases over the remainder of this year." And "I do not regard the weakness in first quarter data as a harbinger of softness in the underlying economy, and the strength of the labor market report on Friday provides some strong confirmation of that view."
On the data front...
UK RICS house price balance was unchanged at 22 in April. Swiss will release CPI in European session. UK will also release industrial and manufacturing production and trade balance. Canada will release new housing price index later in the day. US will release PPI and jobless claims.
USD/JPY Daily Outlook
Daily Pivots: (S1) 113.81; (P) 114.09; (R1) 114.56; More...
While upside momentum in USD/JPY remains unconvincing, there is no sign of topping yet. Intraday bias stays on the upside as current rise would target 115.49 resistance next. Outlook remains unchanged that correction from 118.65 has completed with three waves down to 108.12. Break of 115.49 will resume larger rally from 98.97 to 125.85 high. On the downside, below 113.62 minor support will turn bias neutral and bring consolidations before staging another rally.
In the bigger picture, price actions from 125.85 high are seen as a corrective pattern. It's uncertain whether it's completed yet. But in case of another fall, downside should be contained by 61.8% retracement of 75.56 to 125.85 at 94.77 to bring rebound. Meanwhile, break of 115.49 resistance will extend the rise from 98.97 to retest 125.85. Overall, rise from 75.56 is still expected to resume later after the correction from 125.85 completes.
Economic Indicators Update
| GMT | Ccy | Events | Actual | Forecast | Previous | Revised |
|---|---|---|---|---|---|---|
| 21:00 | NZD | RBNZ Rate Decision | 1.75% | 1.75% | 1.75% | |
| 23:01 | GBP | RICS House Price Balance Apr | 22% | 20% | 22% | |
| 05:00 | JPY | Eco Watchers Survey Current Apr | 47.8 | 47.4 | ||
| 06:00 | EUR | German Wholesale Price Index M/M Apr | 0.00% | |||
| 07:15 | CHF | CPI M/M Apr | 0.20% | 0.20% | ||
| 07:15 | CHF | CPI Y/Y Apr | 0.50% | 0.60% | ||
| 08:00 | EUR | ECB Economic Bulletin | ||||
| 08:30 | GBP | Industrial Production M/M Mar | -0.40% | -0.70% | ||
| 08:30 | GBP | Industrial Production Y/Y Mar | 1.90% | 2.80% | ||
| 08:30 | GBP | Manufacturing Production M/M Mar | -0.20% | -0.10% | ||
| 08:30 | GBP | Manufacturing Production Y/Y Mar | 3.00% | 3.30% | ||
| 08:30 | GBP | Construction Output M/M Mar | 0.30% | -1.70% | ||
| 08:30 | GBP | Visible Trade Balance (GBP) Mar | -11.6B | -12.5B | ||
| 09:00 | EUR | European Commission Economic Forecasts | ||||
| 11:00 | GBP | BoE Rate Decision | 0.25% | 0.25% | ||
| 11:00 | GBP | BoE Asset Purchase Target May | 435B | 435B | ||
| 11:00 | GBP | MPC Official Bank Rate Votes | 1--0--8 | 1--0--8 | ||
| 11:00 | GBP | MPC Asset Purchase Facility Votes | 0--0--9 | 0--0--9 | ||
| 11:00 | GBP | BoE Inflation Report | ||||
| 12:00 | GBP | NIESR GDP Estimate Apr | 0.40% | 0.50% | ||
| 12:30 | CAD | New Housing Price Index M/M Mar | 0.30% | 0.40% | ||
| 12:30 | USD | PPI M/M Apr | 0.20% | -0.10% | ||
| 12:30 | USD | PPI Y/Y Apr | 2.20% | 2.30% | ||
| 12:30 | USD | PPI Core M/M Apr | 0.20% | 0.00% | ||
| 12:30 | USD | PPI Core Y/Y Apr | 1.70% | 1.60% | ||
| 12:30 | USD | Initial Jobless Claims (MAY 06) | 245K | 238K | ||
| 14:30 | USD | Natural Gas Storage | 67B |