Sample Category Title
Trade Idea Wrap-up: GBP/USD – Stand aside
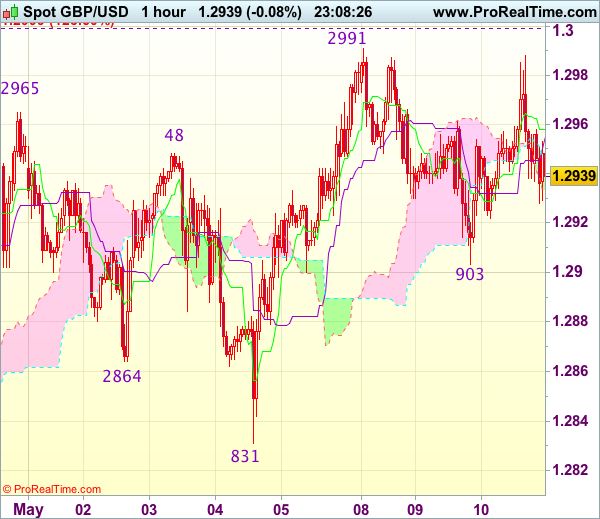
GBP/USD - 1.2943
Most recent candlesticks pattern : N/A
Trend : Near term up
Tenkan-Sen level : 1.2958
Kijun-Sen level : 1.2955
Ichimoku cloud top : 1.2947
Ichimoku cloud bottom : 1.2933
New strategy :
Stand aside
Position : -
Target : -
Stop : -
Although cable rebounded to 1.2988 in London morning, the subsequent retreat has retained our view that further consolidation below resistance at 1.2991 would be seen and weakness to 1.2920 cannot be ruled out, however, reckon downside would be limited to support at 1.2903 and bring another rise to 1.2999-00 (1.236 times projection of 1.2109-1.2616 measuring from 1.2365 and psychological resistance), break there would signal recent upmove has resumed and extend further rise to 1.3040-50, then towards 1.3075-80 which is likely to hold from here due to near term overbought condition.
In view of this, would be prudent to stand aside in the meantime. Below said support at 1.2903 would revive near term bearishness and suggest a temporary top has been formed at 1.2991, bring correction to 1.2875-80 but price should stay well above last week’s low at 1.2831.
Trade Idea Wrap-up: EUR/USD – Sell at 1.0955
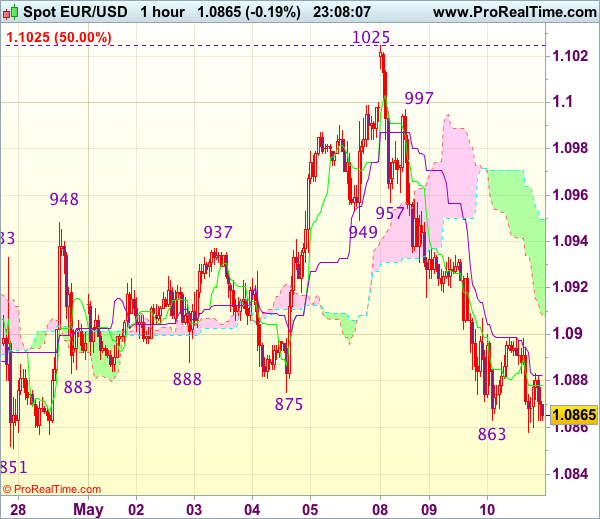
EUR/USD - 1.0869
Most recent candlesticks pattern : N/A
Trend : Near term down
Tenkan-Sen level : 1.0878
Kijun-Sen level : 1.0883
Ichimoku cloud top : 1.0950
Ichimoku cloud bottom : 1.0908
Original strategy :
Sell at 1.0955, Target: 1.0855, Stop: 1.0990
Position : -
Target : -
Stop : -
New strategy :
Sell at 1.0955, Target: 1.0855, Stop: 1.0990
Position : -
Target : -
Stop : -
As the single currency has remained under pressure, suggesting the fall from 1.1025 top is still in progress and bearishness remains for this decline to extend weakness to 1.0851 support, break there would bring at least a strong retracement of early upmove towards 1.0825-30 but reckon 1.0800 would hold from here due to near term overbought condition.
In view of this, we are looking to sell euro on recovery as 1.0960-70 should limit upside. Above resistance at 1.0997 would bring retest of said resistance at 1.1025, however, break there is needed to signal recent upmove from 1.0340 low has resumed for headway to 1.1050 but reckon upside would be limited to 1.1065-70 (61.8% projection of 1.0602-1.0951 measuring from 1.0851).
Yen Steady as Political Storm Engulfs Washington
USD/JPY has ticked higher in the Wednesday session. In North American trade, the pair is trading just below the 114 line. On the release front, the Bank of Japan published its summary of opinions. There are no major releases out of the US. On Thursday, PPI is expected to show a slight gain of 0.2%, and unemployment claims is forecast to climb to 245 thousand.
The BoJ released its summary of opinions from its April policy meeting. BoJ board members recommended that the central bank maintain its ultra-loose accommodative policy due to global downside risks. At the same time, the economy had improved, boosted by stronger exports and production. The summary stated that the BoJ should upgrade its economic assessment to state that the economy "has been turning towards a moderate expansion". On the inflation front, policymakers predicted that inflationary pressures would increase, but that the inflation target of 2 percent would not be attained before 2018. The summary reiterates the cautious optimism that characterized the BoJ rate statement in April – global demand has boosted the economy, but it's too early too make any changes to the BoJ's current quantitative easing program.
The yen continues to slide, and has lost 4.7% since April 17. The dollar pushed above the 114 line on Tuesday, as a soft Japanese wage growth report weighed on the yen. Wage growth declined 0.4% in March, marking the sharpest decline since June 2015. Prime Minister Abe's government has urged businesses to raise worker's wages, but the message has largely fallen on deaf ears, even with a tight labor market. A sluggish economy and weak consumer spending have dampened business confidence, so businesses are showing little appetite for raising wages and thus incurring more expenses.
Donald Trump's unconventional style has caused consternation and uneasiness in the markets, but the political earthquake he has now stirred could become political quicksand for the new president. Trump abruptly fired FBI director James Comey on Tuesday, stunning lawmakers on both sides of the aisle. Comey, who has been conducting an investigation into possible collusion between Trump and Russia during the presidential campaign, clearly has been a thorn in Trump's side. The White House has claimed that it fired Comey over his handling of an email scandal involving Hillary Clinton, but the move has been roundly condemned by the Democrats, and some key Republicans have also voiced opposition as well. The firestorm could heat up further, with calls in Congress to appoint a special prosecutor into Trump's connections with Russia. Has Trump gone one step to far? This latest controversy could cause some jitters among investors and send the greenback lower against the safe-haven Japanese yen.
Trade Idea Wrap-up: USD/JPY – Buy at 113.25
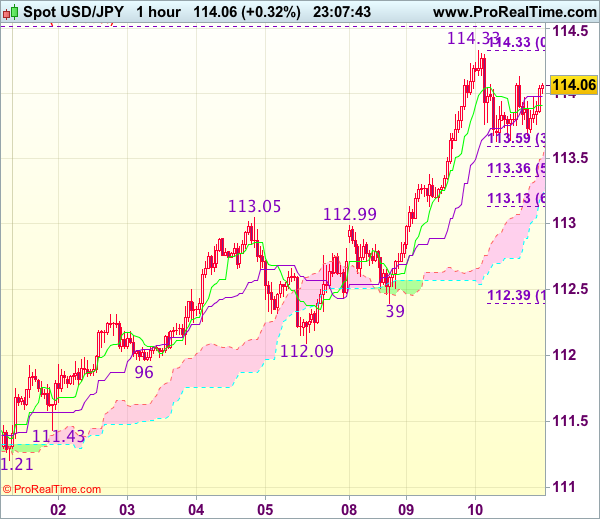
USD/JPY - 114.13
Most recent candlesticks pattern : N/A
Trend : Near term up
Tenkan-Sen level : 113.92
Kijun-Sen level : 113.98
Ichimoku cloud top : 113.50
Ichimoku cloud bottom : 113.22
Original strategy :
Buy at 113.25, Target: 114.45, Stop: 112.90
Position : -
Target : -
Stop : -
New strategy :
Buy at 113.25, Target: 114.45, Stop: 112.90
Position : -
Target : -
Stop : -
Dollar’s retreat after rising to 114.33 suggests consolidation below this level would be seen and pullback to 113.50 cannot be ruled out, however, reckon 113.30-35 would limit downside and bring another rise later, above said resistance at 114.33 would extend recent upmove to 114.50-55 (100% projection of 108.13-111.78 measuring from 110.87), however, near term overbought condition should limit upside to 114.75-80 and price should falter below 115.00, bring retreat later.
In view of this, would not chase this rise here and would be prudent to buy dollar on pullback as 113.25-35 should contain downside. Only below previous resistance at 113.05 would defer and suggest top is formed, bring correction of recent upmove to 112.70-80 but reckon support at 112.39 would remain intact.
Technical Outlook: Oil Price Accelerated Higher
Oil price accelerated higher on Wednesday and is attempting to break above two-day congestion top at $47.00.
Firm break higher is needed to generate stronger direction signal after the price initially broke above daily Tenkan-sen line ($46.74) which capped past two-day action.
Oil received fresh boost from Tuesday's API oil report which showed inventories falling by 5.8 million barrels last week, well above forecasted draw of 1.8 million barrels. This is seen as initial result of oil production cut, as major oil producers are looking for extension of initial output cut agreement for the next six months in order to support falling oil prices.
EIA weekly crude stocks report, released on Wednesday, showed unexpected fall in oil inventories, showing draw of 5.2 million barrels last week, compared to forecasted 2 million barrels fall and previous week's 0.9 million barrels draw.
Oil price received strong support from data, with fresh bullish acceleration looking for minimum requirement - close above daily Tenkan-sen, to generate reversal signal which would get confirmation on break above next pivotal barriers at $47.46/56 (Fibo 38.2% of $53.74/$43.74 downleg / falling daily 10SMA).
Broken daily Tenkan-sen now acts as initial support at $46.74, followed by daily low at $46.00.
Res: 47.46; 47.56; 48.00; 48.74
Sup: 47.00; 46.74; 46.00; 45.51
Currencies: Dollar Holding Up Well, But Rebound Slows
Headlines
European equity markets traded lacklustre as strong drivers were missing. Currently most indices show minimal to modest losses. US equities opened with small losses too.
Czech, Hungarian and Norwegian inflation slowed in April. Slower inflation in these regions reduces the odds that central bank monetary tightening could start any time soon after years of interest rate cuts and measures to boost market liquidity.
It looks like the International Monetary Fund (IMF) will take part in the financing of Greece's third bailout, Slovakia's finance minister Peter Kazimir said at the EBRD's annual meeting in Nicosia. The Greek 10-yr yield dropped to the lowest level since the 2012 debt restructuring.
The stability of Austria's coalition government has been thrown into doubt following the resignation of the country's vice chancellor and leader of the centre-right People's Party. Early elections are possible. Austria's far-right Freedom Party has led recent opinion polls, and came close to having its candidate elected as Austrian president.
Euro zone unemployment is higher than official data suggest, continuing to keep wage growth muted, a European Central Bank study showed, raising fresh doubts about whether the bank can start rolling back its stimulus measures soon.
The European Central Bank's reluctance to raise interest rates is putting pressure on Sweden's central bank to keep its own stimulus measures in place, the Riksbank has acknowledged, making it harder for policymakers to respond to rapid growth in the local economy.
Rates
Bonds gain ground in uneventful trading
Global core bonds eked out some gains today. Markets focussed on Trump's latest policy move – sacking FBI boss Comey – amid an empty eco calendar. European stock markets started on a weak footing, but managed to limit losses. ECB president Draghi held the line of the April ECB meeting in his appearance before Dutch parliament and didn't raise speculation about the ECB's exit policy going into the June meeting.. An ECB study which states that the EMU unemployment rate is higher than officially reported and prevents upward wage pressure, caught some headlines and supported the Bund's intraday momentum. Oil prices remain stuck below the $50/barrel level ahead of API inventory data. Yesterday's EIA data suggest a drop in inventories after weeks of increases.
At the time of writing, the German yield curve flattened with yield changes ranging between +0.3 bps (2-yr) and -3.2 bps (30-yr). US yields decline by 0.6 bps (2-yr) to 2.2 bps (10-yr). On intra-EMU bond markets, 10-yr yield spread changes versus Germany 10-yr yield spread narrow up to 2 bps with Portugal outperforming (-4 bps) and Greece underperforming (+3 bps). Austrian bonds don't feel pressure following the unexpected resignation of the vice-chancellor which puts the stability of the coalition government in doubt.
The German Finanzagentur tapped the on the run 5-yr Bobl (€3B 0% Apr2022). Total bids amounted only €3.41B, below the €4.2B average at the previous 4 Bobl auctions. The auction had a 1 cent tail and the Bundesbank set aside €0.57B for secondary market operations, resulting in an official bid cover of 1.4 (real bid cover: 1.1). Today, the US Treasury continues its refinancing operation with a $23B 10-yr Note auction. Currently, the WI trades around 2.36%.
Currencies
Dollar holding up well, but rebound slows
Today was an uneventful trading session in the major dollar cross rates. US and European equities didn't go anywhere. Yields declined marginally. The dollar rebounded since the start of this week and maintained a good bid. In technical trade, EUR/USD declined slightly further (currently around 1.0865/70). USD/JPY stabilized close to mostly slightly below 114.
Overnight, Asian equities traded mixed to mostly positive with Korea and China underperforming. The dollar traded marginally softer against the euro (EUR/USD high 1.08 area) and the yen (USD/JPY 113.80 area).
European equities opened in the red, but the decline was modest and soon a bottom was found. The moves in European equities and in yields were too small to give USD trading clear guidance. In technical, order driven trade, the EUR/USD cautiously extended the correction from Monday and Tuesday, but the pace slowed. USD/JPY hovered mostly in the high 113 area. The equity correction was also too small to have a meaningful negative impact on USD/JPY. In a speech before the Dutch Parliament ECB's Draghi maintained a balanced tone. EUR/USD held near the intraday lows in the 1.0860 area, as the Draghi headlines hit the screens, but the reaction was negligible. EUR/USD trades in the 1.0865/70 area. USD/JPY is changing hands in the 113.90 area.
Awaiting the BoE policy decision
Sterling trading also showed no clear trading pattern. The limited decline in EUR/USD initially weighed also slightly on EUR/GBP. EUR/GBP dropped temporary below 0.84 but tries to regain this level late in the European session. Cable was better bid this morning, but a real test of the 1.30 area didn't occur and the pair drifted back south later in the session. Maybe some squaring of positions ahead of tomorrow BoE policy decision (including inflation report) is in play. Cable trades currently in the 1.2935 area.
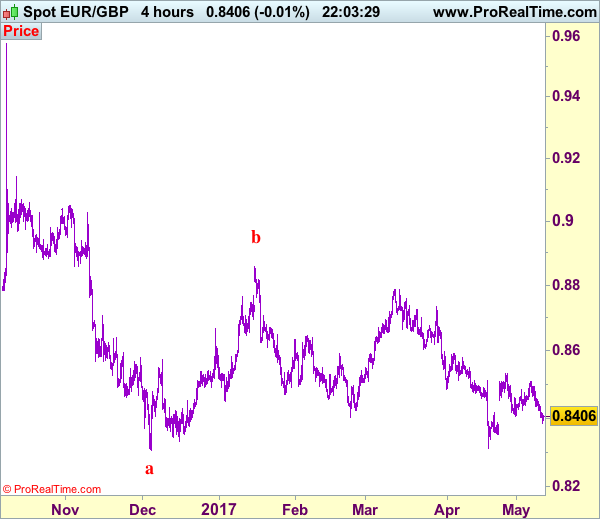
Trade Idea: EUR/GBP – Stand aside
EUR/GBP - 0.8405
Recent wave: Major double three (A)-(B)-(C)-(X)-(A)-(B)-(C) is unfolding and 2nd (A) has possibly ended at 0.6936.
Trend: Near term down
New strategy :
Stand aside
Position : -
Target : -
Stop : -
As the single currency has remained under pressure, suggesting the fall from 0.8531 is still in progress and near term downside risk remain for weakness towards support at 0.8351, however, break there is needed to signal the rebound from 0.8312 low has ended at 0.8531 and bring further fall towards this support at 0.8312 which is likely to hold from here.
On the upside, whilst recovery to 0.8430-35 cannot be ruled out, reckon 0.8455-60 would hold and bring further consolidation. Only above 0.8475-80 would suggest low is formed, bring a stronger rebound to resistance at 0.8509 but said resistance at 0.8531 should remain intact. Only a break of this level would add credence to our view that a temporary low has been formed at 0.8312 and extend the rebound from there for retracement of recent decline to 0.8550, however, reckon resistance at 0.8580 would limit upside and 0.8600-10 would hold from here. As near term outlook is mixed, would be prudent to stand aside in the meantime.
Our preferred count is that, after forming a major top at 0.9805 (wave V), (A)-(B)-(C) correction is unfolding with (A) leg ended at 0.8400 (A: 0.8637, B: 0.9491 and 5-waver C ended at 0.8400. Wave (B) has ended at 0.9413 and impulsive wave (C) has either ended at 0.8067 or may extend one more fall to 0.8000 before prospect of another rally. Current breach of indicated resistance at 0.9043 confirms our view that the (C) leg has ended and bring stronger rebound towards 0.9150/54, then towards 0.9240/50.
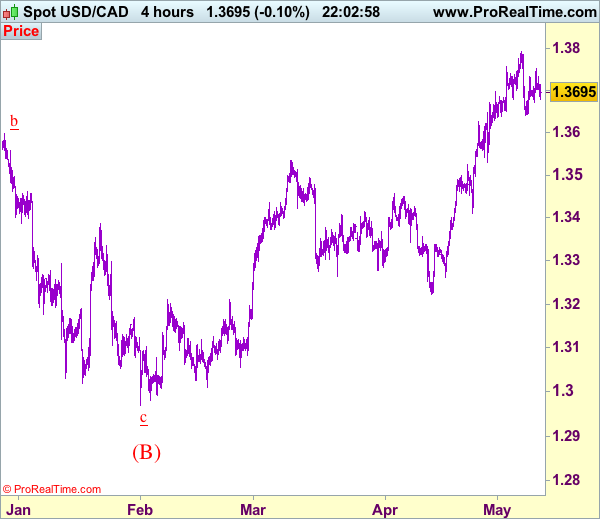
Trade Idea: USD/CAD – Buy at 1.3570
USD/CAD - 1.3695
Recent wave: Only wave v of c has ended at 0.9407 and wave C of major A-B-C correction is underway for headway to 1.4700
Trend: Near term up
Original strategy :
Buy at 1.3655, Target: 1.3850, Stop: 1.3595
Position: -
Target: -
Stop: -
New strategy :
Buy at 1.3570, Target: 1.3770, Stop: 1.3510
Position: -
Target: -
Stop:-
As the greenback has retreated after meeting resistance at 1.3753, retaining our view that further consolidation below resistance at 1.3794 (last week’s high) would be seen and another corrective fall to 1.3642 is likely, below there would bring correction to 1.3600 but reckon downside would be limited to 1.3570 and bring another rise later, above 1.3753 would suggest the pullback from 1.3794 has ended, bring retest of this level, break there would extend recent upmove to 1.3840-50 but overbought condition should prevent sharp move beyond 1.3890-00 and price should falter below 1.3950.
In view of this, would not chase this rise here and would be prudent to buy again on pullback as 1.3570 should limit downside and bring another rise later. Below 1.3530 would abort and suggest a temporary top is formed, bring retracement of recent upmove to 1.3500 and later towards 1.3450-60 but support at 1.3411 should remain intact, bring another upmove later.
To recap, wave B from 1.3066 is unfolding as an a-b-c and is sub-divided as a: 1.2192, b: 1.2716 and wave c is a 5-waver with i: 1.1983, ii: 1.2506, extended wave iii with minor iii at 1.0206, wave iv ended at 1.0781 and wave v as well as wave iii has ended at 0.9931, hence the subsequent choppy trading is the wave iv which is unfolding as (a)-(b)-(c) with (a) leg of iv ended at 1.0854, followed by (b) leg at 1.0108 and (c) leg as well as the wave iv ended at 1.0674. The wave v is sub-divided by minor wave (i): 0.9980, (ii): 1.0374, (iii): 0.9446, (iv): 0.9913 and (v) as well as v has possibly ended at 0.9407, therefore, consolidation with upside bias is seen for major correction, indicated target at 1.3700 and 1.4000 had been met and further gain to 1.4700 would be seen later.
Technical Outlook: FTSE Surged above Daily Cloud Top
FTSE surged above daily cloud top (7291) on Wednesday after Tuesday's action showed strong hesitation here on stronger pound. Fresh strength emerged after sterling repeatedly failed to clear psychological barrier and subsequent weakness. The index price hit fresh one-month high at 7333 so far and is looking for test of 7346 (11 Apr high) for full retracement of 7346/7032 downleg which may trigger fresh extension higher. The price is currently riding on the third wave of five-wave cycle from 7032, which eyes its 100% Fibo expansion at 7358 and may travel to 7408 (FE 123.6%) on sustained break. Meantime, the price may correct recent rally (bull-leg from 7143, 28 Apr trough), as slow stochastic is overbought on daily chart. Broken daily cloud top at 7291 now acts as good support, guarding 7264 (55SMA) and lower pivot at 7234 (daily cloud base) loss of which will be bearish. Tomorrow's releases from BoE are closely watched for stronger signals.
Res: 7333; 7346; 7358; 7374
Sup: 7307; 7291; 7273; 7264
Trade Idea Update: USD/CHF – Buy at 1.0005
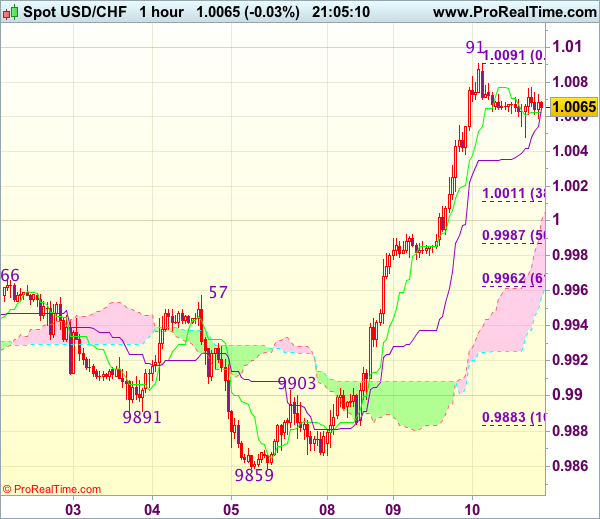
USD/CHF - 1.0070
Original strategy :
Buy at 1.0005, Target: 1.0105, Stop: 0.9970
Position : -
Target : -
Stop : -
New strategy :
Buy at 1.0005, Target: 1.0105, Stop: 0.9970
Position : -
Target : -
Stop : -
Although dollar has eased after rising to 1.0091 and consolidation below this level would be seen, reckon pullback would be limited to the Kijun-Sen (now at 1.0039) and renewed buying interest should emerge around 1.0000-05, bring another rise, above said resistance would add credence to our view that early upmove has resumed for retest of 1.0108 resistance, break there would confirm and encourage for headway to 1.0130 and then 1.0150-55.
In view of this, would not chase this rise here and we are looking to buy dollar on pullback as 1.0000-05 should limit downside. Only below previous resistance at 0.9957 would defer and suggest top is possibly formed, bring test of 0.9920-25 but break of previous resistance at 0.9903 is needed to add credence to this view, bring further fall to 0.9880-85.