
Sample Category Title
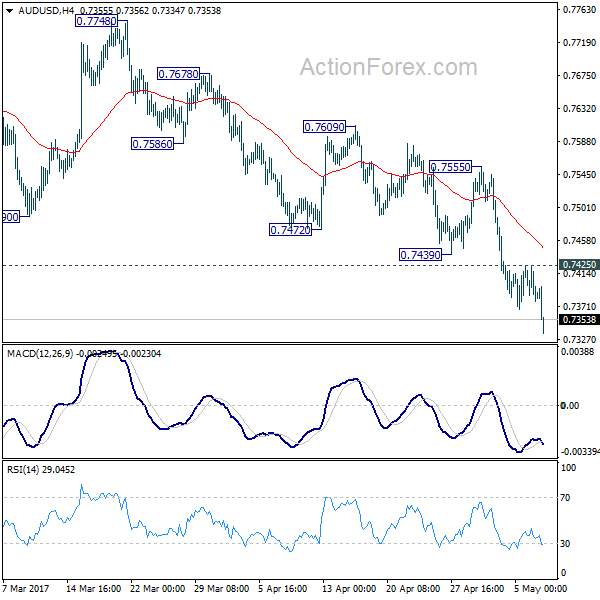
AUD/USD Daily Outlook
Daily Pivots: (S1) 0.7366; (P) 0.7395; (R1) 0.7413; More...
AUD/USD's fall resumed after brief consolidation and reaches as low as 0.7334 so far. Intraday bias is back on the downside. Current decline from 0.7748 should target 0.7144/7158 support zone. We'll be cautious on bottoming there as there is no clear sign of larger down trend resumption yet. On the upside, above 0.7425 minor resistance will turn bias neutral and bring consolidations first.
In the bigger picture, we're still treating price actions from 0.6826 low as a correction pattern. And, as long as 38.2% retracement of 0.9504 to 0.6826 at 0.7849 holds, long term down trend from 1.1079 is expected to resume sooner or later. Break of 0.6826 low will target 0.6008 key support level. However, firm break of 0.7849 will indicate that rise from 0.6826 is developing into a medium term rebound, rather than a sideway pattern. In such case, stronger rise should be seen to 55 month EMA (now at 0.8115) and above.
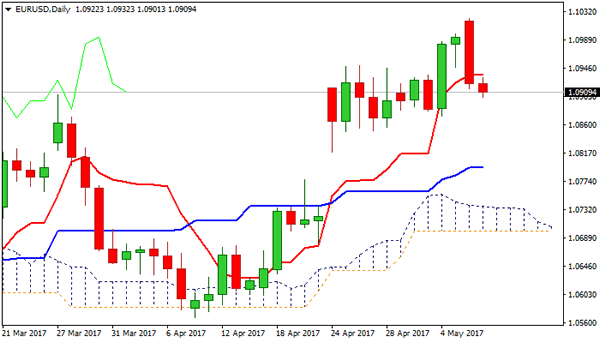
Technical Outlook: EURUSD – Bearish Outside Day Signals Reversal And Risks Further Downside
The Euro came under increased pressure after Monday's strong close in red that formed bearish outside day reversal pattern. Pullback from six-month high at 1.1020 broke below initial supports at 1.0935/19 (daily Tenkan-sen/10SMA) and looking for extension through another strong supports at 1.0904/ 1.0896 (top of thick 4-hr cloud/Fibo 61.8% of 1.0819/1.1020 upleg).
Further easing would challenge next pivotal supports at 1.0848 (Fibo 38.2% of 1.0568/1.1020 ascend) and 1.0828 (200SMA).
Fresh bearish acceleration may undermine broader longs on further extension lower and close below 1.0848/28 pivots, which may threaten of filling the gap from two weeks ago and confirm reversal.
Near-term studies turned into full bearish mode while slow stochastic reversed from overbought territory on daily chart and supports negative scenario. Broken daily Tenkan-sen now acts as initial resistance and so far caps today's action.
Res: 1.0935, 1.0950, 1.0998, 1.1020
Sup: 1.0896, 1.0873, 1.0866, 1.0848
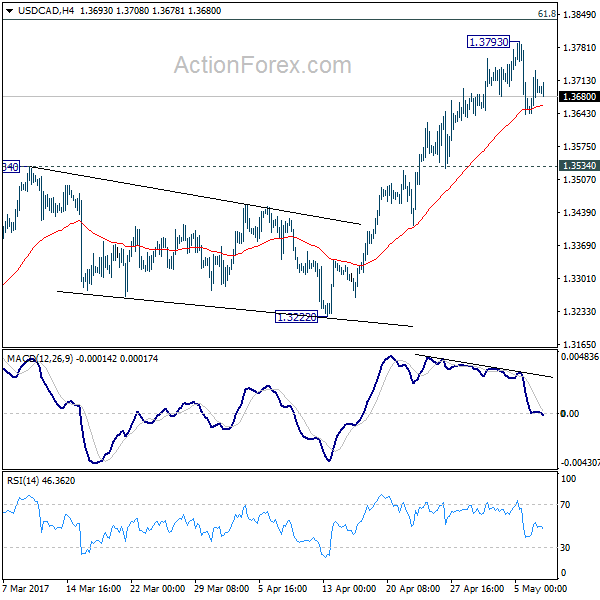
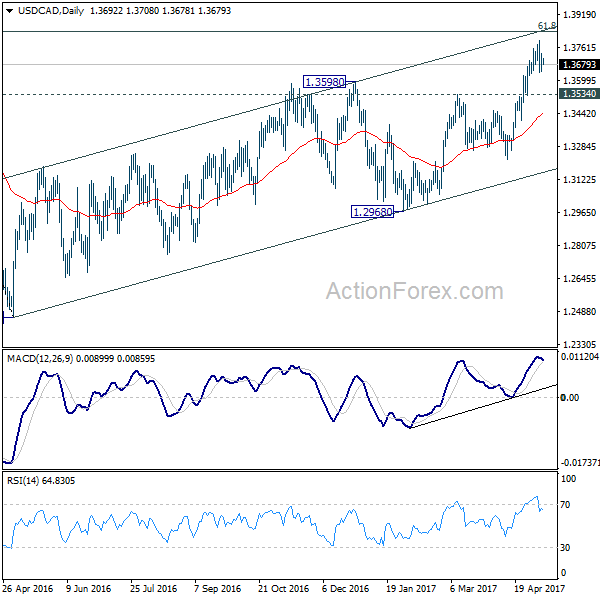
USD/CAD Daily Outlook
Daily Pivots: (S1) 1.3645; (P) 1.3689; (R1) 1.3736; More....
USD/CAD's consolidation from 1.3793 temporary top is still in progress. Intraday bias remains neutral for the moment. Rise from 1.2460 is seen as a corrective pattern. Hence, in case of another rally, we'll be cautious on topping at around 1.3838 fibonacci level. Meanwhile, consider bearish divergence condition in 4 hour MACD, break of 1.3534 support will argue that rise from 1.2968 is already completed. In such case, intraday bias will be turned back to the downside for 1.3222 support.
In the bigger picture, price actions from 1.4689 medium term top are seen as a correction pattern. The first leg has completed at 1.2460. Rise from 1.2460 is seen as the second leg and would end at around 61.8% retracement of 1.4689 to 1.2460 at 1.3838. Break of 1.3222 should indicate the start of the third leg while further break of 1.2968 should confirm. Nonetheless, sustained trading above 1.3838 would pave the way to retest 1.4689 high.
EUR/DKK Spiked Yesterday
Market movers today
It is set to be a very quiet day in terms of data releases. Worth keeping an eye on is German industrial production in March, which we expect declined modestly after two strong monthly increases. Note that German factory orders released yesterday surprised on the upside compared with our expectations and point to a strong end to Q1 for German business activity.
In the US, we get the NFIB small business optimism indicator for April. Business optimism soared after the election of Donald Trump as president . However, given the increased uncertainty about how much of his policies he will actually be able to carry out in practice, business optimism seems to have peaked and we expect it to fall further given the fall observed in, for example, ISM and PMI. This should not be a significant turn for the worse in the overall economy, but a correction in soft indicators to be more in line with the actual economic development .
Again today there are a few speeches by FOMC members including Rosengren (non -voter, hawkish) and Kaplan (voter, dovish). The focus remains on getting more insight about how the members' views differ after the less informative FOMC statement released last week.
Selected market news
Market reaction was quite muted yesterday after Macron's win but volatility (VIX index) fell to its lowest level since 1993, as European political uncertainty has diminished significantly. EUR/DKK spiked yesterday and we look for the cross spot to stay close to 7.4400 on 12M on strong DKK fundamentals not fully mitigated by the spread between DK and eurozone policy rates. With political risks fading, focus will now likely shift back to the business cycle, see also Strategy: With fading EU political risks, global business cycle back in focus, 5 May. China in part icular may soon come back into the spot light , as financial stress is on the rise again.
Yesterday, a couple of Fed speeches suggested that while the Fed's Mester (non-voter, hawk) supports a June hike, Bullard (non-voter, dovish) thinks the current policy rate is appropriate. Mester argues that the US labour market is strong and the Fed risks falling behind the curve if it does not tighten monetary policy. Markets have priced in around an 80% probability of a Fed hike at the meet ing next week, which is also the consensus among most analysts. We are more sceptical, as we think the Fed will take the opportunity to announce what will trigger a change in its reinvestment strategy ("quantitative tightening"), see also FOMC review: Fed thinks weak GDP growth in Q1 was 'transitory', 3 May. A total of three Fed hikes is priced in from now until year-end 2018.
Daily Technical Analysis: EURUSD, GBPUSD, USDJPY, USDCHF
EURUSD
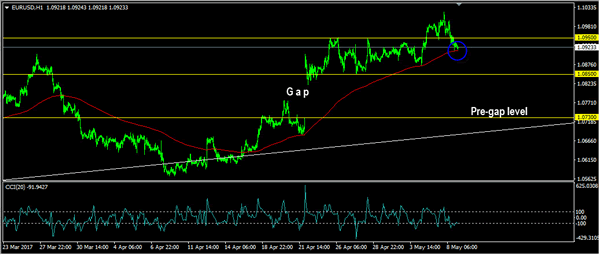
The EURUSD had a bearish momentum yesterday bottomed at 1.0916. The bias is bearish in nearest term. Price is now struggling around the H1 EMA 200 (1.0915) as you can see on my H1 chart below. A clear break below the EMA 200 would expose 1.0850 key support. A clear break and daily close below 1.0850 could trigger further bearish pullback testing the pre-gap level at 1.0730. Immediate resistance is seen around 1.0950. A clear break back above that area could lead price to neutral zone in nearest term but would keep the recent bullish phase targeting 1.1000/50 area.
GBPUSD
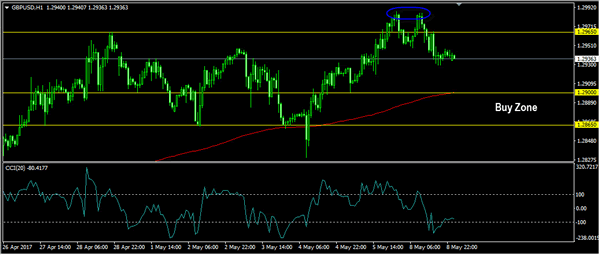
The GBPUSD was corrected lower yesterday bottomed at 1.2929. We have a double top formation as you can see on my H1 chart below suggests a potential bearish scenario, but overall I remain bullish. The bias is bearish in nearest term testing 1.2900 – 1.2865 support area which is a good place to buy with a tight stop loss. Immediate resistance is seen around 1.2965. A clear break above that area could lead price to neutral zone in nearest term testing 1.3000 – 1.3050 region.
USDJPY
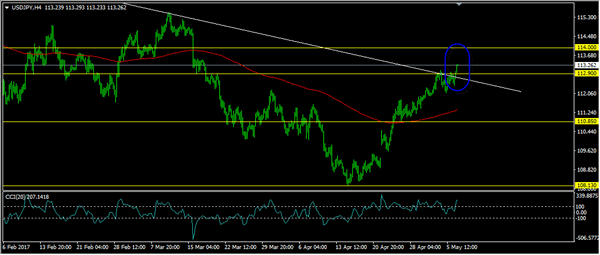
The USDJPY attempted to push lower yesterday bottomed at 112.39 but whipsawed to the upside and closed higher at 113.23, just above the trend line resistance as you can see on my H4 chart below. This fact suggests a bullish continuation scenario. The bias is bullish in nearest term testing 114.00 area. Immediate support is seen around 112.90. A clear break below that area could lead price to neutral zone in nearest term as direction would become unclear.
USDCHF
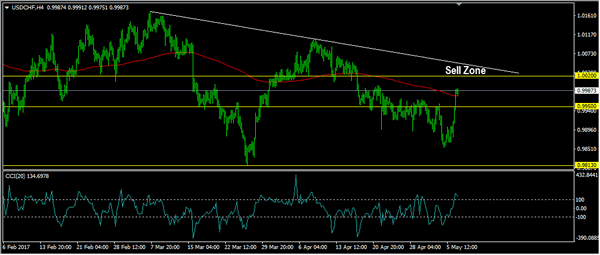
The USDCHF was corrected higher yesterday topped at 0.9990. The bias is bullish in nearest term testing 1.0020 key resistance and the trend line resistance as you can see o my H4 chart below, which is a good place to sell with a tight stop loss. Immediate support is seen around 0.9950. A clear break below that area could lead price to neutral zone in nearest term testing 0.9900 or lower. Overall I remain neutral.
Currencies: Dollar Rebounds
Sunrise Market Commentary
Rates: Core bonds lose ground, but be aware of risk sentiment
With French election risk out of the way, focus may shift to the potentially key June ECB and Fed meetings. Anticipation on hawkish outcomes could push the German and US yields back higher The fragile picture of commodity markets, historically low volatility, and record equity prices are a risk scenario which could lift safe haven assets in case of a risk-off correction.
Currencies: Dollar rebounds
Yesterday, the dollar captured a better bid. EUR/USD fell prey to profit taking after the Macron victory. USD/JPY profited from the resilience of US equities and a rise in US yields. Today, the eco calendar is thin. Some further pro-USD repositioning might be on the cards.
The Sunrise Headlines
- US stocks closed flat yesterday, after Apple shares surged to an all-time high and the Vix index closed at its lowest point since 1993. Overnight, Asian stock markets trade mixed.
- The Australian dollar eased to four-month lows after disappointing retail sales (-0.1% M/M) figures reinforced expectations of steady interest rates for months to come.
- German production fell a smaller-than-expected 0.4% in March (expected -0.7% M/M), but February production was slightly downwardly revised to 1.8% from 2.2%. It confirms strong activity in Germany. The trade surplus widened to €25.4B from 20B previously, even as exports lagged imports.
- Saudi Arabia's oil minister said that oil producers would "do whatever it takes" to rebalance the market and that he expected a global deal on cutting crude output to be extended to the end of 2017 or possibly longer.
- The former head of the US Department of Justice told Congress that she had warned the White House in January that Michael Flynn, the first national security adviser appointed by Donald Trump, could be blackmailed by Russia.
- South Koreans headed to voting stations today to elect a new leader, looking to move on from a corruption scandal that brought down former President Park Geun-hye and shook the political and business elite to the core.
- Today's eco calendar remains thin with only US NFIB small business optimism. Austria, the Netherlands, Germany (inflation-linked) and the US tap the market. Fed governors Kashkari, Rosengren and Kaplan are scheduled to speak.
Currencies: Dollar Rebounds
Dollar rebounds as euro rally runs into resistance
On Monday, a buy-the-rumour, sell-the-fact correction after Macron's victory caused a modest reversal on earlier EUR/USD, EUR/JPY and USD/JPY gains. EUR/USD tested the 1.10 level in Asia, but declined throughout the session and closed at 1.0924. The European equity correction initially also weighed on USD/JPY, but the pair found a better bid as US equities were very resilient and USD bond yields reversed an early decline. USD/JPY finished at 113.26 (from 112.76 on Friday).
Overnight, Asian equity markets trade narrowly mixed in the absence of new eco info. EUR/USD stabilizes in the 1.0930 area. USD/JPY maintains yesterday's gains and trades in the 113.30 area. Of late, price declines in several industrial commodities weighed on the Aussie dollar. Today, a domestic factor, disappointing retail sales, were to blame for a further AUD/USD to the 0.7355 area.
Today, the US calendar only contains the JOLTS Job Openings and the NFIB small business confidence, no market movers. We expect them to come out at healthy levels. Various Fed governors will speak on non-monetary policy themes. Ultrahawk George, on the contrary, speaks on the balance of economic risks and monetary policy. She might warn that the Fed risks to be behind the curve, but she's an outsider inside the FOMC and her comments shouldn't carry much weight. So, little guidance for USD trading today.
Yesterday, the euro fell prey to post-Macron profit taking. At the same time, the dollar was in good shape as US equities outperformed Europe and as US yields maintained an upward bias. The post-Macron equity correction shouldn't go far. This might continue to support USD/JPY. For EUR/USD the picture remains indecisive. Markets are still looking for signs that the ECB will change its communication at the June meeting. The euro recently already anticipated on such a scenario. If there is no additional news on this issue, the euro rally might (temporary) slow. At the same time, the downside of the dollar is becoming better protected. So, some further technical correction in EUR/USD toward to the 1.0821 (Spike higher after first round victory of Macron) is likely.
From a technical point of view, USD/JPY bottomed out in April and regained the 112.20 resistance last week. This improved the technical picture. The rebound continues in a gradual way, but looks quite robust. Next intermediate resistance comes in at 115.51. EUR/USD extensively tested the topside of the MT range (1.0874/1.0906 area) late March. The pair returned to the range top after the first round of the French election and broke above the 1.09/1.0950 resistance at the end of last week. However, the break isn't confirmed. A sustained break would improve the ST picture. Next resistance stands at 1.1129 (62% retracement) and at 1.1366 (correction top). A decline below 1.0821 would suggest that the dollar is regaining traction against the euro. A ST EUR/USD correction might occur as the pair is unwinding overbought conditions.
R/USD topside test again rejected. Some further post-Macron correction might be on the cards
EUR/GBP
EUR/GBP joins post-Macron euro correction
The global post-Macron reaction dominated UK trading yesterday. EUR/GBP corrected south and finished the session at 0.8442 (from 0.8473). The decline of EUR/USD (relative strength of the dollar) weighted slightly on cable. The pair dropped to the 1.2930 area and closed the session at 1.2940.
Overnight, the UK BRC like-for-like sales rebounded by an impressive 5.6% Y/Y (from -1.0% Y/Y in March). However, the figure was probably distorted by the timing of Easter. Sterling's reaction remained limited. There are no important eco data on the agenda today. Technical considerations will prevail for sterling trading. Markets will look forward to the BoE's policy meeting and the quarterly inflation report (Thursday). We don't expect the BoE to herald a big change before the Parliamentary election. Soft Q1 growth gives the BoE the room not to hurry to signal a rate hike anytime soon.
Two weeks ago, EUR/GBP dropped below EUR/GBP 0.84 support, (temporary) improving the sterling picture. The pair came within reach of key 0.8305 support (Dec low), but no real test occurred. After a late April EUR/GBP rebound, the range bottom is better protected. Longer term, Brexit-complications remain potentially negative for sterling. On technical considerations we slightly prefer a EUR/GBP buy-on-dips approach.
EUR/GBP: trading within a tight 0.83/0.85 range
Market Update – Asian Session: Aussie Retail Sales Disappoint While Japan Wage Inflation Shrinks
US Session Highlights
(US) Apr Labor Market Conditions Index Change: 3.5 v 1.0e
(US) April Conference Board Employment Trends: 132.64 v 131.58 in March
(US) Fed's Bullard (non-voter, dovish): Fed's current policy rate setting is appropriate; US economy looks like it's in a low growth state
(US) Fed’s Mester (hawkish, non-voter): actions must be taken before Fed policy goals are fully met; reiterates calls for further rate hikes and trimming balance
(US) New York Fed Consumer Expectations Apr survey: households expecting finances to improve rises to 44%; April inflation expectations 3 years ahead to 2.9% v 2.7% prior
The S&P touched new all-time highs before retreating and closing flat on the day. The VIX reached lows not seen since 1993, dropping 8% to 9.7. The outperforming S&P sector was energy, thanks to higher oil prices, rising 0.8%.
US markets on close: Dow flat, S&P500 flat, Nasdaq flat
Best Sector in S&P500: Energy
Worst Sector in S&P500: Materials
Biggest gainers: NWL +11.9%; CTL +5.1%; COH +4.8%
Biggest losers: TSN -6.1%; LYB -4.0%; INCY -3.8%
At the close: VIX 9.8 (-0.8pts); Treasuries: 2-yr 1.33% (flat), 10-yr 2.38% (+2bps), 30-yr 3.01% (+3bps)
US movers afterhours
MAR Reports Q1 $1.01 v $0.90e, R$5.56B v $4.91Be; +4.9% afterhours
BLDR Reports Q1 $0.11 v $0.05e, R$1.53B v $1.49Be; Adjusted EBITDA $76.1M v $61.8M y/y; gross margin 24.5% v 25.0% y/y; +4.8% afterhours
P Reports Q1 -$0.24 v -$0.34e, R$316M v $318Me; Announces $150M investment by KKR; Confirms ongoing strategic review; +3.2% afterhours
BKD Reports Q1 -$0.68 (GAAP*) v $0.48e, R$1.22B v $1.21Be; +2.9% afterhours
OTEX Reports Q3 $0.45 v $0.53e, R$593M v $608Me; raises dividend 15% to $0.132 from $0.115 (indicated yield 1.52%); Operating margin 29.1% v 31.4% y/y; -9.7% afterhours
NVRO Reports Q1 -$0.50 v -$0.26e, R$68.4M v $68.1Me- Affirms FY17 R$31-320M v $318Me (prior $310-320M); -14.5% afterhours
HTZ Reports Q1 -$1.61 v -$1.00e, R$1.92B v $1.89Be; International car rental rev $411M, -5% y/y; US car rental rev $1.35B, -4% y/y; -17.7% afterhours
Key economic data
(JP) JAPAN MAR LABOR CASH EARNINGS Y/Y: -0.4% (biggest decline in 21 months) V 0.5%E ; REAL EARNINGS (EX-INFLATION) Y/Y: -0.8% V 0.0% PRIOR
(AU) AUSTRALIA MAR RETAIL SALES M/M: -0.1% (2nd straight decline) V +0.3%E; Q/Q ex-inflation: +0.1% V 0.5%E
(NZ) ANZ: New Zealand Apr non-tradable inflation m/m 0.0% v 0.2% prior, y/y: 2.2% v 2.2% prior
Asia Session Notable Observations, Speakers and Press
Asia indices mixed after a flat day on Wall St where S&P500 hit record intraday high and Vix saw a multi-year low. Australia underperforming ahead of the release of its FY17/18 budget, with retailers slumping on much weaker than expected Aussie Retail Sales. CBA shares also trading lower following Q3 results. AUD/USD fell nearly 40pips toward 0.7350 on the release.
Japan wage inflation posted its biggest y/y decline in nearly 2 years, and BOJ Gov Kuroda noted central bank is prepared to do more policy adjustment if needed, sending USD/JPY pair to session highs near 113.40.
China press speculated Terms of Trade could turn to deficit this year on rising imports following overnight Apr Trade data. CASS researchers also warned new home prices may decline amid property curbs.
China
(CN) China's NDRC said to plan a meeting with power companies about coal quality - press
(CN) China Passenger Car Association (PCA): Jan-Apr vehicle sales 7.27M units, -1.7% y/y
(CN) China Academy of Social Sciences (CASS): New home prices may fall in 2017 - press
(CN) China may see Terms of Trade at a deficit this year amid growth in Imports - Chinese press
Japan
(JP) Moody's: Japan to become more sensitive to BOJ recalibrations
(JP) BOJ Gov Kuroda: Reiterates Japan’s virtuous economic cycle is strengthening
Australia/New Zealand
(AU) Australia Foreign Investment Review Board (FIRB): Investment gains mainly driven by real estate
(AU) Australia Govt considering a levy on big four banks under new budget - Australian press
(NZ) NZIER's Shadow Board: RBNZ should adopt tightening bias
Asian Equity Indices/Futures (01:00ET)
Nikkei -0.1%, Hang Seng +0.3%, Shanghai Composite flat, ASX200 -0.6%, Kospi closed
Equity Futures: S&P500 flat; Nasdaq flat, Dax -0.1%, FTSE100 -0.1%
FX ranges/Commodities/Fixed Income (01:00ET)
EUR 1.0920-1.0935; JPY 113.15-113.40; AUD 0.7352-0.7398; NZD 0.6900-0.6925
June Gold +0.1% at 1,228/oz; June Crude Oil +0.1% at $46.47/brl; July Copper -0.4% at $2.48/lb
SPDR Gold Trust ETF daily holdings fall 1.2 tonnes to 851.9 tonnes; 4th straight decline
(CN) PBOC SETS YUAN MID POINT AT 6.9037 V 6.8947 PRIOR
(CN) PBOC skips open market operations (3rd straight skip)
(JP) Japan MoF sells ¥2.08T v ¥2.3T offered in 10-year 0.1% JGBs; Avg yield: 0.030% v 0.064% prior; bid to cover: 3.76x v 3.96x prior
(AU) Australia MOF sells A$150M in 2030 bonds; avg yield 0.8288%; bid-to-cover 3.10x
Asia equities notable movers
Australia
Incitec Pivot (IPL) +2.9%; H1 result
Commonweath Bank (CBA) -3.6%: Q3 resut
Beach Energy (BPT) -0.7%; interest in AWE (AWE +5.6%)
JB Hi Fi (JBH) -4.8%, Harvey Norman (HVN) -3.7%; Australia retail sales
Japan
IHI (7013) +3.8%, FY16/17 result
Mitsubihi Heavy (7011) +0.5%, FY16/17 result
TEPCO (9501) +3.3%; To set retail gas prices as much as ~8% cheaper than Tokyo Gas f
Subaru (7270) -3.8%; FY16/17 result
United Arrows (7606) -5.8%; FY16/17 result
Hong Kong
Longfor Properties (960) +0.2%; Apr result
Great Wall Motor (2333) -0.1%; Apr sales
International Entertainment (1009) +0.6%; FY guidance
Daily Technical Outlook And Review: EUR/USD, GBP/USD, AUD/USD, USD/JPY, USD/CAD, USD/CHF, DOW 30, GOLD
A note on lower timeframe confirming price action...
Waiting for lower timeframe confirmation is our main tool to confirm strength within higher timeframe zones, and has really been the key to our trading success. It takes a little time to understand the subtle nuances, however, as each trade is never the same, but once you master the rhythm so to speak, you will be saved from countless unnecessary losing trades. The following is a list of what we look for:
- A break/retest of supply or demand dependent on which way you're trading.
- A trendline break/retest.
- Buying/selling tails ... essentially we look for a cluster of very obvious spikes off of lower timeframe support and resistance levels within the higher timeframe zone.
- Candlestick patterns. We tend to only stick with pin bars and engulfing bars as these have proven to be the most effective.
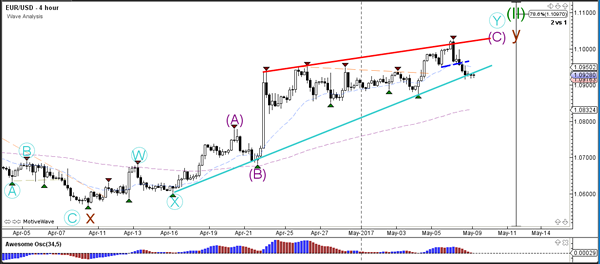
EUR/USD
As anticipated, the single currency shook hands with the large psychological number 1.10/ H4 161.8% Fib ext. at 1.1007 drawn from the low 1.0851 and sold off. Bolstering this area was not only two weekly 127.2% Fib extensions at 1.1016/1.0954 (red zone) taken from the lows 1.0340/1.0493, but also a daily trendline resistance extended from the high 1.1616. Well done to any of our readers who managed to jump aboard here!
With the H4 mid-level support at 1.0950 now out of the picture, price is currently seen teasing a H4 trendline support etched from the high 1.0947. Also of note is May’s opening level pegged just below at 1.0902/psychological handle 1.09.
Our suggestions: Attempting to join the bearish momentum seen from the above said higher-timeframe structures is chancy given we have the following supports (green area) in view:
- May’s opening level pegged just below at 1.0902/psychological handle 1.09.
- 2016 yearly opening level at 1.0873 (see weekly chart).
- Daily support at 1.0850.
On account of this, we now favor longs. However, we will not become buyers in this market UNTIL we witness a reasonably sized bullish rotation candle form within the noted green zone (preferably a full-bodied candle).
Data points to consider: FOMC member Kaplan speaks at 9.15pm GMT+1.
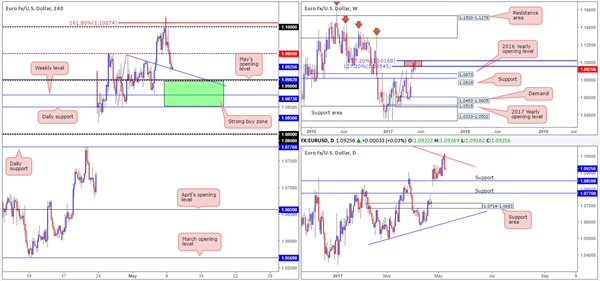
Levels to watch/live orders:
- Buys: 1.0850/1.09 ([waiting for a reasonably sized H4 bull candle [preferably a full-bodied candle] to form before pulling the trigger is advised] stop loss: ideally beyond the candle’s tail).
- Sells: Flat (stop loss: N/A).
GBP/USD
As can be seen from the H4 chart, price was unable to sustain gains beyond the mid-level resistance 1.2950 during yesterday’s segment. This move was likely influenced by the fact that both weekly and daily action are currently seen trading at the underside of supplies at the moment (1.3120-1.2957/1.3058-1.2979).
Despite this, the downside to this market looks incredibly limited. There’s a H4 trendline support extended from the high 1.2965, May’s opening level at 1.2927 and the nearby round number at 1.29 to contend with!
Our suggestions: In the absence of clearer price action, opting to stand on the sidelines may very well be the better path to take today.
Data points to consider: FOMC member Kaplan speaks at 9.15pm GMT+1.
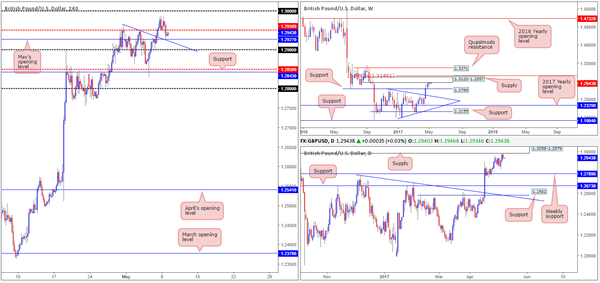
Levels to watch/live orders:
- Buys: Flat (stop loss: N/A).
- Sells: Flat (stop loss: N/A).
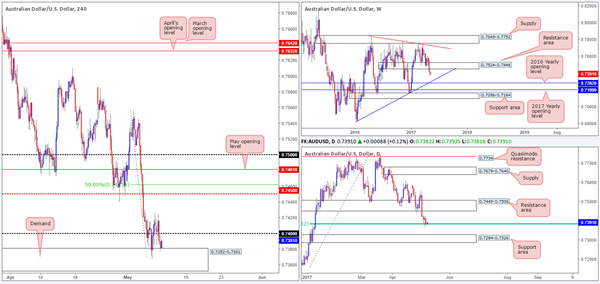
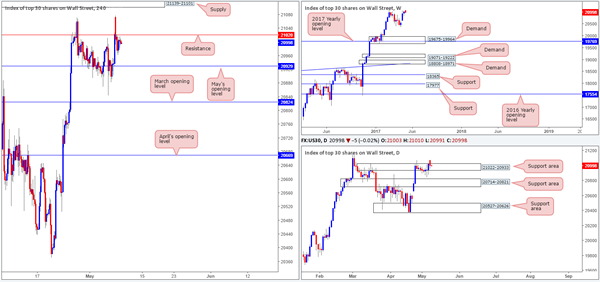
AUD/USD
Coming in from the top this morning, we can see that weekly bears continue to push this market lower after breaking through the support zone at 0.7524-0.7446. Should this momentum continue, it’s likely that the trendline support extended from the low 0.6827 and 2016 yearly opening level at 0.7282 will be brought into the picture.
Down on the daily candles, the long-term 61.8% Fib’ support at 0.7832 (drawn from the low 0.7159) appears to be on the verge of giving way. A violation of this hurdle will bring the support area at 0.7284-0.7326 into view, which intersects beautifully with the above noted weekly trendline support and sits just above the 2016 yearly opening level.
Jumping across to the H4 chart, the buyers and sellers have been seen battling for position around the 0.74 handle since Thursday last week. Also noteworthy here is the demand coming in at 0.7352-0.7381.
Our suggestions: Despite the H4 chart showing demand in play, the higher-timeframe structures suggest that this market may be headed lower. With that said, this places traders in a rather precarious position: sell into H4 demand or buy into potential higher-timeframe flow?
As far as we can see, technical elements are mixed at the moment leaving us with little choice but to remain flat for now.
Data points to consider: Aussie retail sales figures at 2.30am, Aussie Annual budget release at 10.30am. FOMC member Kaplan speaks at 9.15pm GMT+1.
Levels to watch/live orders:
- Buys: Flat (stop loss: N/A).
- Sells: Flat (stop loss: N/A).
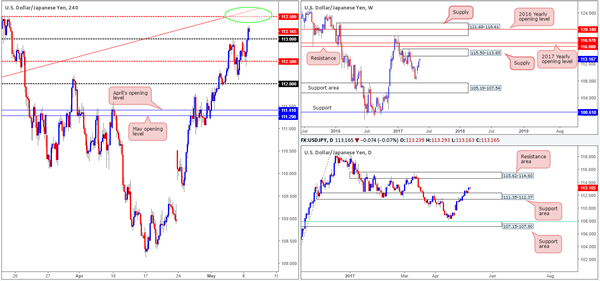
USD/JPY
USD/JPY bulls went on the offensive yesterday and pulled the H4 candles above the 113 handle. Consequent to this, the H4 mid-level resistance at 113.50 is now in sight, which happens to intersect nicely with a H4 trendline resistance pegged from the low 111.68 (green circle).
Although 113.50 is a possible sell zone, traders might want to take into consideration that the weekly candles show room to advance up to the supply area at 115.50-113.85. This – coupled with daily action also showing room to stretch up to a resistance area coming in at 115.62-114.60, signals potential weakness around 113.50!
Our suggestions: Instead of looking to short from 113.50, our team’s focus is on buying any retest seen off the 113 handle. Be that as it may, before our desk commits here, we’d need to see a reasonably sized H4 bull candle form following the retest – ideally a full-bodied candle. Frist take-profit target would, of course, be 113.50, followed by the underside of weekly supply at 113.85.
Data points to consider: FOMC member Kaplan speaks at 9.15pm GMT+1.
Levels to watch/live orders:
- Buys: 113 region ([waiting for a reasonably sized H4 bull candle [preferably a full-bodied candle] to form before pulling the trigger is advised] stop loss: ideally beyond the candle’s tail).
- Sells: Flat (stop loss: N/A).
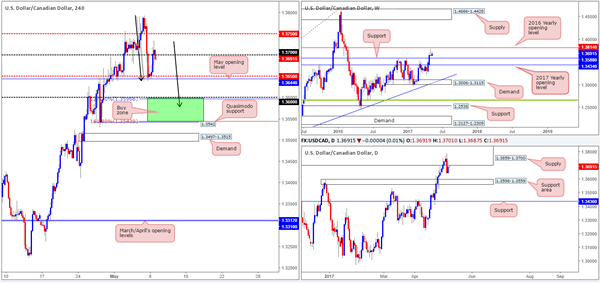
USD/CAD
In recent trading, the pair managed to recover well from May’s opening level at 1.3644/H4 mid-level support at 1.3650. However, the 1.37 handle has so far proven to be a bit of a challenge to overcome. What’s also notable from a technical perspective, however, is the possible H4 AB=CD structure taken from the high 1.3793 (black arrows). Although the 1:1 pattern terminates just below the 1.36 handle, a bullish rotation from here is still highly likely. Note the daily support area coming in at 1.3598-1.3559 and the weekly support level drawn from 1.3588!
Our suggestions: Quite simply, our team is looking for long opportunities between the 127.2/161.8% AB=CD Fib’ extensions at 1.3542/1.36 today. In an ideal world, we’d want to see a reasonably sized H4 full-bodied bull candle form within this green zone. The reason we require additional confirmation here is to avoid the possibility of getting stopped out on any fakeout seen to the H4 demand planted below at 1.3497-1.3515.
Data points to consider: FOMC member Kaplan speaks at 9.15pm GMT+1.
Levels to watch/live orders:
- Buys: 113 region ([waiting for a reasonably sized H4 bull candle [preferably a full-bodied candle] to form before pulling the trigger is advised] stop loss: ideally beyond the candle’s tail).
- Sells: Flat (stop loss: N/A).
USD/CAD
In recent trading, the pair managed to recover well from May’s opening level at 1.3644/H4 mid-level support at 1.3650. However, the 1.37 handle has so far proven to be a bit of a challenge to overcome. What’s also notable from a technical perspective, however, is the possible H4 AB=CD structure taken from the high 1.3793 (black arrows). Although the 1:1 pattern terminates just below the 1.36 handle, a bullish rotation from here is still highly likely. Note the daily support area coming in at 1.3598-1.3559 and the weekly support level drawn from 1.3588!
Our suggestions: Quite simply, our team is looking for long opportunities between the 127.2/161.8% AB=CD Fib’ extensions at 1.3542/1.36 today. In an ideal world, we’d want to see a reasonably sized H4 full-bodied bull candle form within this green zone. The reason we require additional confirmation here is to avoid the possibility of getting stopped out on any fakeout seen to the H4 demand planted below at 1.3497-1.3515.
Data points to consider: FOMC member Kaplan speaks at 9.15pm GMT+1.
Levels to watch/live orders:
- Buys: Flat (stop loss: N/A).
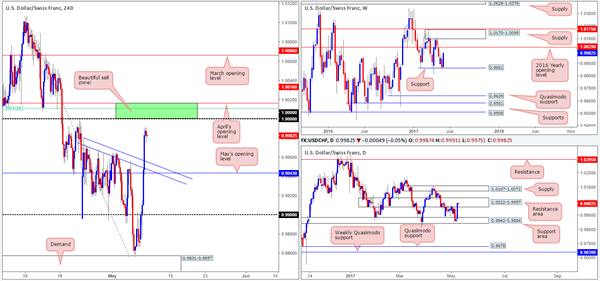
- Sells: 1.0016/1.0000 ([waiting for a reasonably sized H4 bear candle [preferably a full-bodied candle] to form before pulling the trigger is advised] stop loss: ideally beyond the candle’s wick).
DOW 30
According to daily structure, the resistance area at 21022-20933 could very soon become a zone of support. In the event that this does come to fruition, we’re confident that the index will look to punch to fresh record highs. However, the H4 candles remain capped beneath the resistance level pegged at 21020 for now. This line and the nearby supply zone seen above it at 21139-21101 are, in our opinion, the only barriers now stopping the DOW from popping higher.
Our suggestions: Given where price is positioned on the weekly and daily charts, we do eventually expect the unit to punch higher and continue trending northbound. Nevertheless, we will not become buyers in this market until we witness a decisive H4 close beyond the current H4 supply zone.
Data points to consider: FOMC member Kaplan speaks at 9.15pm GMT+1.
Levels to watch/live orders:
- Buys: Once the H4 supply at 21139-21101 is taken out, longs will be permitted.
- Sells: Flat (stop loss: N/A).
GOLD
Kicking this morning’s report off with a look-see at the weekly timeframe, we can see that the bulls are beginning to make an appearance from within the walls of demand coming in at 1194.8-1229.1. Along the same lines, daily action remains trading around a support zone coming in at 1216.7-1225.7. Therefore, higher-timeframe structure favors the bulls at this point.
Over on the H4 chart, the H4 support zone at 1218.5-1223.4 (seen lodged within the limits of the said weekly and daily structures) remains intact after being tested during yesterday’s segment.
Our suggestions: In view of the bigger picture (see above), our desk remains biased to the upside. The H4 support area mentioned above is still on our radar for potential longs today. Ideally though, we’d want to see a reasonably sized H4 bull candle present itself here – a full-bodied candle would be perfect – before we commit. As for take-profit targets, the H4 resistance at 1240.9 still looks reasonable for partial profits.
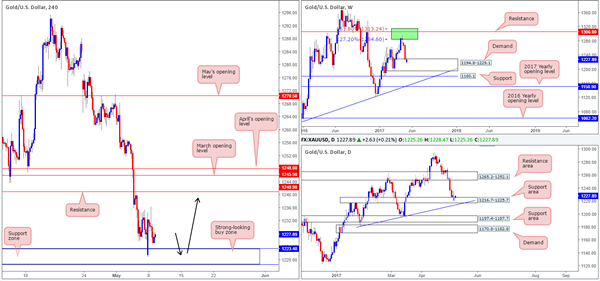
Levels to watch/live orders:
- Buys: 1218.5/1223.4 ([waiting for a reasonably sized H4 bull candle to form before pulling the trigger is advised] stop loss: ideally beyond the candle’s tail).
- Sells: Flat (stop loss: N/A).
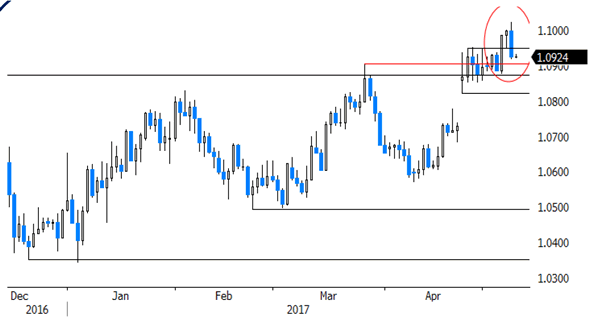
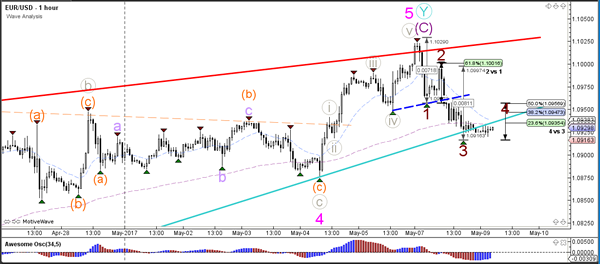
Daily Technical Analysis: EUR/USD Builds RW Reversal Pattern At 1.10 Resistance
Currency pair EUR/USD
The EUR/USD is building a rising wedge (RW) reversal chart pattern (red/blue) at the psychological round level of 1.10. Price has now reached the support line of the pattern which is a bounce or break zone. A bearish break could start a larger bearish correction whereas a bullish bounce could see price challenge the resistance (red) line.
The EUR/USD broke the mini support level (dotted blue) after bouncing at the 61.8% Fibonacci level of wave 2 (brown). The correction could be part of a 123 (brown) or ABC. The wave 4 (brown) is invalidated if price breaks above the 50% Fib of wave 4.
Currency pair GBP/USD
The GBP/USD has bounced at the resistance line (red) of the uptrend channel (red/green). A bullish break could see price move towards the Fibonacci targets of wave 5 (purple) whereas a bearish break could start a reversal.
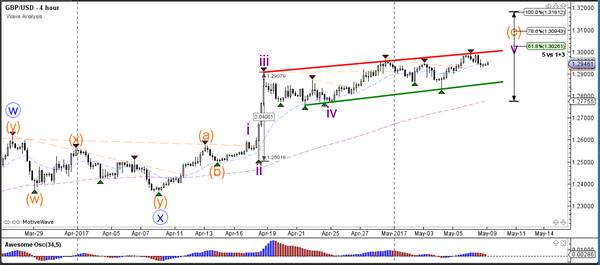
The GBP/USD seems is building a bearish retracement within a potential wave 4 (grey), which would become invalidated if price manages to break below the top of wave 1 (green line).
Currency pair USD/JPY
The USD/JPY managed to break above the previous top and is now continuing with the uptrend channel towards the Fibonacci targets of wave 5 (brown).
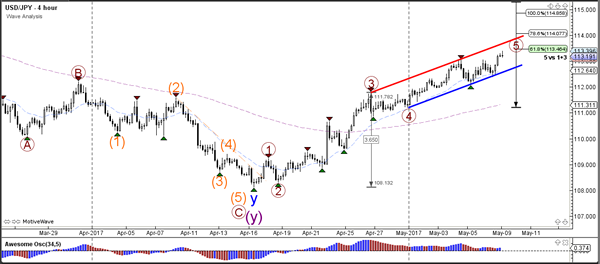
The USD/JPY is extending the bullish 5th wave (brown/orange) after completing an ABC correction (grey) and breaking above the resistance trend lines (dotted orange).
European Open Briefing: Markets Reacted Positively To The Outcome Of The French Election
Global Markets:
- Asian stock markets: Nikkei gained 2.40 %, Shanghai Composite lost 0.90 %, Hang Seng rose 0.30 %, ASX 200 up 0.50 %
- Commodities: Gold at $1230 (+0.30 %), Silver at $16.47 (+1.20 %), WTI Oil at $46.80 (+1.20 %), Brent Oil at $49.75 (+1.30 %)
- Rates: US 10-year yield at 2.36, UK 10-year yield at 1.12, German 10-year yield at 0.42
News & Data
- China Trade Balance (USD) Apr: 38.05B Est. (35.20B), Prior (23.92B)
- China Exports (YoY) Apr: 14.3% Est. (16.80%), Prior (22.30%)
- China Imports (YoY) Apr: 18.6% Est. (29.30%), Prior (26.30%)
- Australia NAB Business Confidence Apr:13, Prior (6)
- Australia NAB Business Conditions Apr: 14, (Prior 14, revised 12)
- Australia Building Approvals (MoM) Mar: -13.4%, Est. (-4.00%), Prior (8.3%)
- Australia Building Approvals (YoY) Mar: -19.9%, Est. (-10%), Prior (-4.90%)
- PBoC Fixes USDCNY Reference Rate At 6.8947 (prev fix: 6.8884)
CFTC Positioning Data:
- EUR short 2K vs 21K short last week. Shorts trimmed by 19K
- GBP short 81K vs 91K short last week. Shorts trimmed by 10K
- JPY short 30K vs 27K short last week. Shorts increased by 3K
- CHF short 18K vs 17K short last week. Shorts increased by 1K
- CAD short 48K vs 43K short. Shorts increased by 5K
- AUD long 43K vs 43K long. Unchanged
- NZD short 12K vs 15K short last week. Shorts trimmed by 3K
Markets Update:
Markets reacted positively to the outcome of the French election. While it was already expected that the centrist candidate Macron will win, stock markets in Asia extended gains. European equities are likely to open higher as well, and a gain of at least 1 % seems likely in the German DAX and French CAC index.
The Euro declined overnight, after starting the trading day above 1.10. The Macron win was already priced in, which is why the currency run out of momentum. EUR/USD fell back to 1.0955. Nevertheless, the technical outlook remains positive and the pair should find strong support at 1.09 and 1.0870.
The safe havens JPY and CHF fell in Asia. Demand for precious metals is likely to remain weak in the short-term too, unless a new risk-off theme emerges in the market. Key resistance in Gold is seen at $1235.
Upcoming Events:
- 07:00 BST – German Factory Orders
- 09:30 BST – UK Halifax House Price Index
- 13:35 BST – FOMC Member Bullard speaks
The Week Ahead:
Tuesday, May 9th
- 02:30 BST – Australian Retail Sales
- 06:45 BST – Swiss Unemployment Rate
- 07:00 BST – German Trade Balance
- 14:00 BST – FOMC Member Kashkari speaks
- 15:00 BST – US JOLTs Job Openings
- 18:00 BST – FOMC Member Rosengren speaks
- 21:15 BST – FOMC Member Kaplan speaks
Wednesday, May 10th
- 02:30 BST – Chinese CPI
- 02:30 BST – Chinese PPI
- 07:45 BST – French Trade Balance
- 13:00 BST – ECB President Draghi speaks
- 15:30 BST – US Crude Oil Inventories
- 22:00 BST – RBNZ Rate Decision
- 22:00 BST – RBNZ Statement
- 23:00 BST – RBNZ Governor Wheeler speaks
Thursday, May 11th
- 00:50 BST – Japanese Current Account
- 07:00 BST – German WPI
- 08:15 BST – Swiss CPI
- 08:30 BST – SNB Chairman Jordan speaks
- 09:30 BST – UK Industrial Production
- 09:30 BST – UK Manufacturing Production
- 09:30 BST – UK Trade Balance
- 12:00 BST – Bank of England Rate Decision
- 12:00 BST – Bank of England Meeting Minutes
- 12:00 BST – Bank of England Inflation Report
- 13:30 BST – US Initial Jobless Claims
- 13:30 BST – US PPI
Friday, May 12th
- 07:00 BST – German GDP
- 10:00 BST – Euro Zone Industrial Production
- 13:30 BST – US Retail Sales
- 13:30 BST – US CPI
- 15:00 BST – US Michigan Consumer Sentiment