
Sample Category Title
Australia Retail Sales Slips, Annual Budget to be Released Later in the Day
The Australian dollar which closed on a bearish note yesterday was seen extending the declines earlier today, following the release of the monthly retail sales report. Data from the Australian Bureau of Statistics showed that retail sales by turnover fell 0.1% on a seasonally adjusted basis in March 2017, marking the second month of declines. However, compared to a year ago, retail sales turnover rose 2.5%.
Later in the day, the Annual budget will be released by the Turnbull administration for the 2017 - 2018 fiscal year. Although the Australian dollar isn't expected to react much, the budget release will, however, garner attention from ratings agencies.
Besides the budget release, other economic releases for the day include German industrial production and Canada's building permits.
EURUSD intra-day analysis
EURUSD (1.0930): EURUSD fell sharply off the session highs near 1.1000 as expected and mentioned in yesterday's commentary. The declines came about in a widely expected result from the French elections that were held on Sunday.
After closing at the day's lows near 1.0923, EURUSD could be seen attempting to retrace some of the declines, but watch for resistance that could develop near 1.0950. Failure to break out above 1.0950 will signal further declines down to 1.0863 - 1.0854.
The 4-hour Stochastics, however, is in the process of printing a hidden bullish divergence with a lower low against the current higher low in price. This could mean that EURUSD could be attempting to break out higher, which will be validated above 1.0950.
GBPUSD intra-day analysis
GBPUSD (1.2953): The British pound was bearish yesterday, but price action was seen to be trading rather tight. The very gradual rally in prices following the bullish flag pattern is signaling that perhaps price action could be looking at a decline in the near term.
This view is somewhat validated by the still evolving rising wedge pattern near the top at 1.2965 - 1.2988. A reversal at this level will very likely confirm the downside in GBPUSD, although the immediate support at 1.2900 will have to be breached to confirm the downside towards 1.2600.
XAUUSD intra-day analysis
XAUUSD (1227.87): Gold prices continued to linger near the 2-month lows at 1220.00 levels. Price action formed an outside bar yesterday keeping the bias fairly neutral at this point, but with a risk of a correction towards 1250.00 handle.
The short-term resistance at 1234.00 remains in sight with further gains seen coming only on a breakout above this level, which will push gold towards the 1250.00 handle where resistance can be established. To the downside, the breakout from the outside bar will signal a move towards 1200.00. With lack of any clear short-term fundamentals, gold prices are likely to remain muted.
Concerns Eased For Fed And ECB After Macron’s Victory
The Dollar index saw a rebound with strong bullish momentum on Monday after hitting a 6-month low of 98.40 last Friday. This morning, during the European session, the dollar index bulls have recovered the significant resistance level at 99.00. USD/JPY hit a high of 113.68, last seen on March 15.
The dollar index has given up most of the post US presidential election gain. Per the CFTC data (Commodity Futures Trading Commission, the week ending May 2), the number of dollar long positions have dropped to the lowest level since October 2016.
Last Thursday the US Congress has finally passed the replacement of the Obamacare bill with the American Healthcare Act. Even though it was passed by a narrow majority it symbolises Trump's first victory since taking office which has lifted market confidence in Trump's administration to an extent.
There are several Fed presidents scheduled to make speeches this week. Boston Fed president Rosengren (non-voter) and Dallas Fed president Kaplan (voter) will speak on Tuesday with Chicago Fed president Evans (voter) speaking on Wednesday. The outcome of the French election has eased the Fed policymakers' concerns about the impacts on the US economy from the Eurozone turmoil after Le Pen's presidency. Per the CME's FedWatch tool, the probability for a rate hike in June has increased to 87.7%.
On Monday two Fed officials made speeches. FOMC member Mester said 'the Fed should raise rates twice more until the end of the year, to prevent economic overheating'. St. Louis Fed president Bullard stated that 'as the Qi GDP figure was weak, and inflation was soft, the Fed is likely to raise rates once by the end of the year, instead of twice'. However, the two Fed officials are both non-voters this year and their comments have limited impacts on markets.
EUR/USD retraced on Monday from a 6-month high of 1.1021 due to profit-taking after the French presidential election and the dollar rebound. ECB Governor Draghi will make a speech in the Dutch Parliament at 12:00 BST on Wednesday May 10.
Be aware of any comments on economic outlook or hints of possible gradual removal of QE.
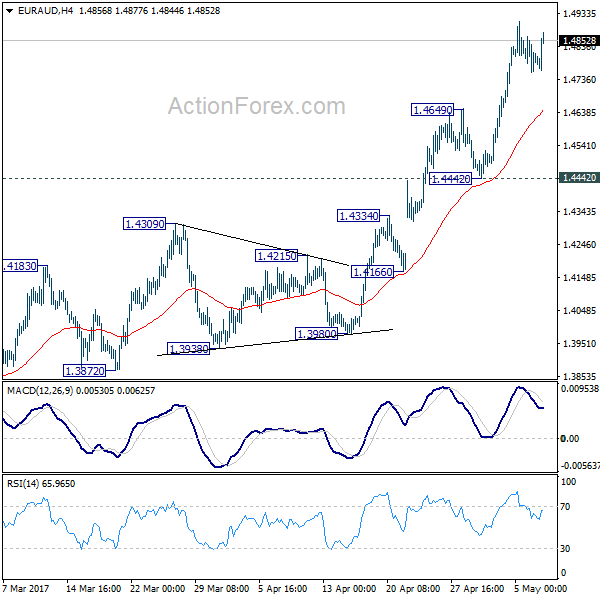
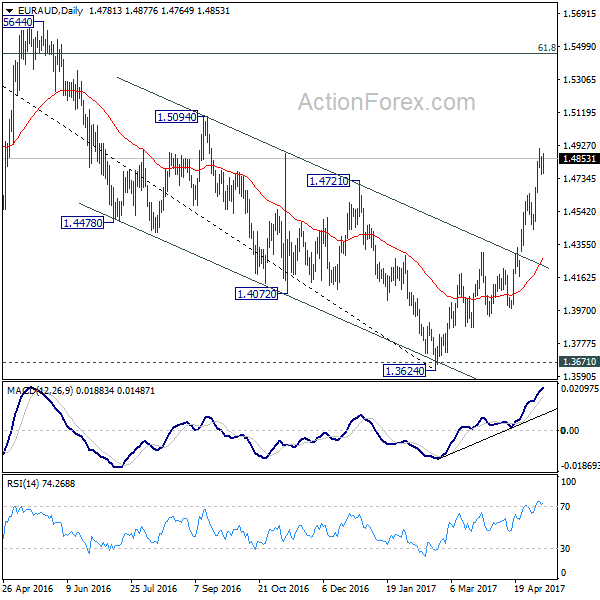
EUR/AUD Daily Outlook
Daily Pivots: (S1) 1.4743; (P) 1.4804; (R1) 1.4848; More...
Intraday bias in EUR/AUD remains on the upside for next medium term fibonacci level at 1.5455. On the downside, touching 1.4649 minor support will turn bias neutral and bring consolidation. But retreat should be contained by 1.4442 support and bring rise resumption.
In the bigger picture, price actions from 1.6587 medium term top are viewed as a corrective pattern. Such correction should be completed after defending 1.3671 key support. Rise from 1.3642 is now expected to target 61.8% retracement of 1.6587 to 1.3624 at 1.5455 and above. In any case, outlook will now stay cautiously bullish as long as 1.4309 resistance turned support holds.
Technical Outlook: USDJPY Extends Strong Bullish Acceleration After Break Above Daily Cloud
The pair took out barrier at 113.38 (50% retracement of 118.65/108.11) on extension of bullish acceleration that commenced on Monday and resulted in eventual close above daily cloud and 100 SMA (112.79/113.09).
Fresh bulls that emerged from two-day consolidation within daily cloud are looking for next target at 113.75 (Fibo 76.4% of 115.49/108.11) and may extend towards psychological barrier at 114.00.
Slow stochastic is strongly overbought on daily chart but continues to move north, suggesting corrective action in the near-term.
Broken daily cloud top (currently at 112.79) and broken bear-trendline off 118.59 peak (at 112.74) offer strong supports which are expected to ideally contain corrective dips.
Res: 113.75, 114.00, 114.50, 114.87
Sup: 113.09, 112.79, 112.74, 112.32
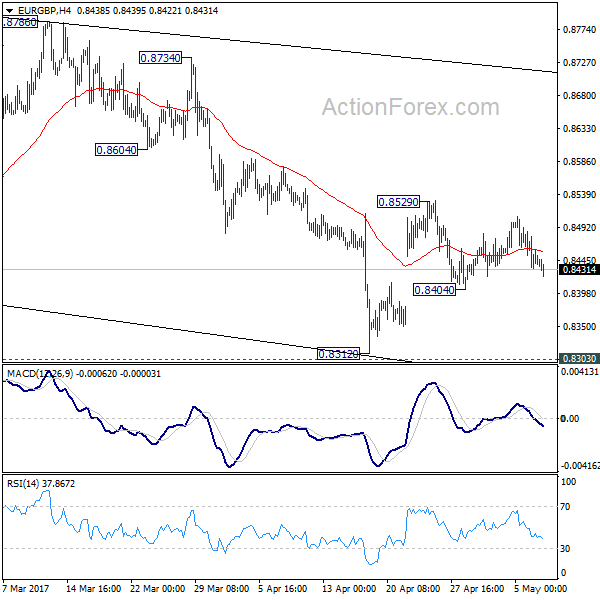
EUR/GBP Daily Outlook
Daily Pivots: (S1) 0.8420; (P) 0.8452; (R1) 0.8472; More...
EUR/GBP is staying in range of 0.8404/8529 and intraday bias remains neutral. On the downside, below 0.8404 will turn focus back to 0.8303 low. Break there will extend the whole corrective pattern from 0.9304. In that case, we'd expect strong support from 0.8116 to contain downside and bring rebound. On the upside, above 0.8529 will resume the rebound from 0.8312 towards 0.8786 resistance. Overall, there is no change in the view that price action from 0.9304 are forming a corrective pattern. Such pattern would extend in near term.
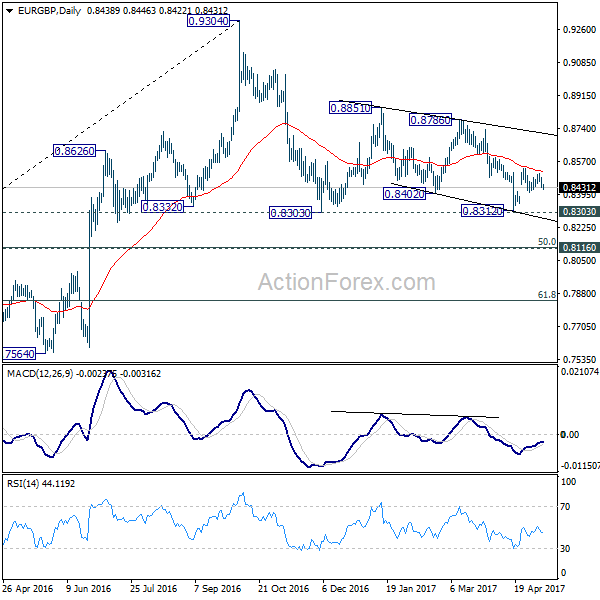
In the bigger picture, price actions from 0.9304 are viewed as a medium term corrective pattern. In case of deeper fall, we'd expect strong support from 0.8116 cluster support (50% retracement of 0.6935 to 0.9304 at 0.8120) to contain downside. Rise from 0.6935 (2015 low) will resume at a later stage to 0.9799 (2008 high). However, sustained break of 0.8116 could bring deeper decline to next key support level at 0.7564 before the correction completes.
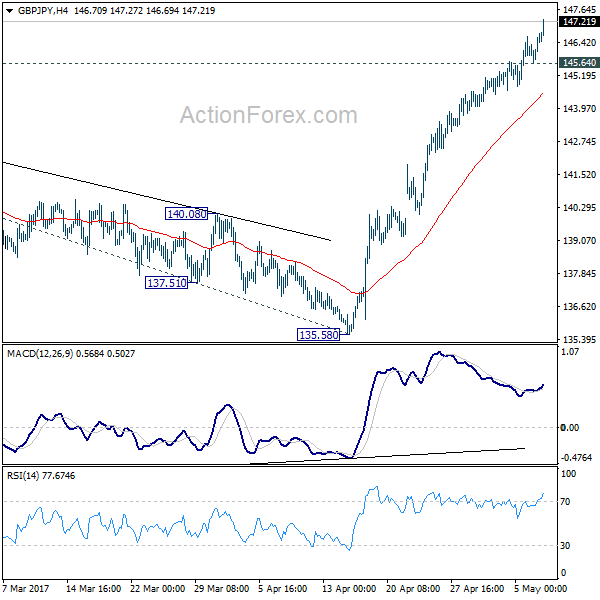
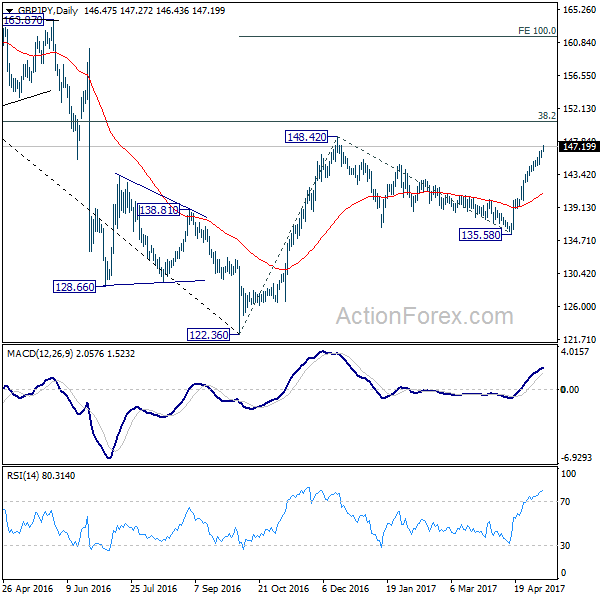
GBP/JPY Daily Outlook
Daily Pivots: (S1) 145.90; (P) 146.28; (R1) 146.92; More....
GBP/JPY's rally continues today and reaches as high as 147.27 so far. Intraday bias remains on the upside. Rise from 122.36 should be resuming. Further rally should be seen through 148.20 to 150.42 fibonacci level.. Further break there will target 100% projection of 122.36 to 148.42 from 135.58 at 161.64. On the downside, below 145.64 minor support will turn bias neutral and bring consolidation before staging another rise.
In the bigger picture, based on current momentum, rise from 122.36 bottom should be developing into a medium term move. Break of 38.2% retracement of 195.86 to 122.36 at 150.42 should pave the way to 61.8% retracement at 167.78. This will now be the favored case as long as 135.58 support holds.
GBPUSD Tading In Final Stages Of An Impulse, A Reversal May Be Near
Cable is making a strong rise away from 1.2364 level, clearly in impulsive fashion which can see an extension up to 1.300-1.3040 area for wave C. That said, recently price has been trading in a correction of a higher degree, wave 4 which is as of current rally completed. As such wave 4 was completed at the 1.2830 level and current recovery is final wave 5. That said, the ideal reversal zone for wave 5 may be around the Fibonacci ratio of 100.0, where distance traveled of waves 1 and 5 comes in play. After wave five finds a top, we can a expect a minimum three wave decline towards the region of a former wave 4).
GBPUSD, 4H
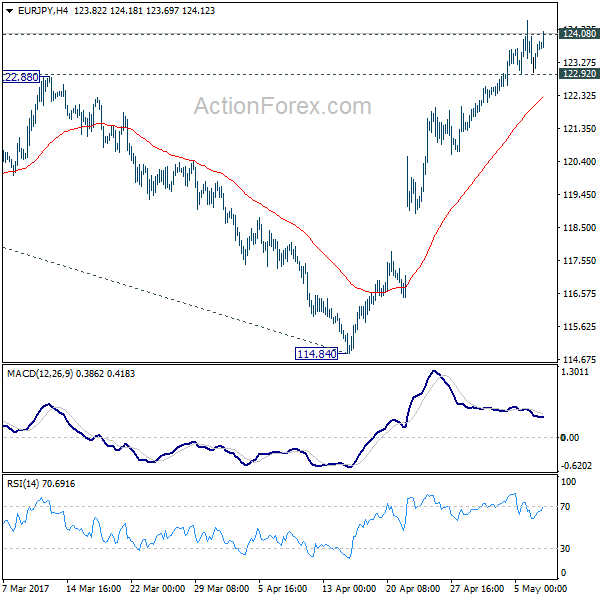
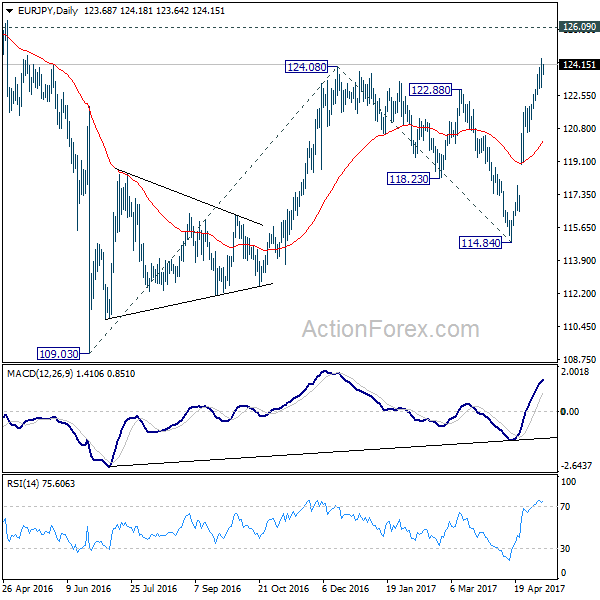
EUR/JPY Daily Outlook
Daily Pivots: (S1) 122.95; (P) 123.72; (R1) 124.45; More...
EUR/JPY is staying above 122.92 minor support and recovered. Further rise is still expected in the cross. Firm break of 124.08 resistance will confirm resumption of whole rise from 109.20. In that case, EUR/JPY would target 126.09 resistance first. Break there will pave the way to 100% projection of 109.03 to 124.08 from 114.84 at 129.89. On the downside, below 122.92 minor support will turn bias to the downside and bring pull back.
In the bigger picture, focus is back on 126.09 support turned resistance. Decisive break there will confirm completion of the down trend from 149.76. And in such case, rise from 109.20 is at the same degree and should target 141.04 resistance and above. Meanwhile, rejection from 126.09 and break of 114.84 will extend the fall from 149.76 through 109.20 low.
Technical Outlook: GBPUSD Hesitates Ahead Of Psychological 1.30 Barrier But Overall Picture Remains Firmly Bullish
Cable started trading on Tuesday at the back foot and penetrated into thick hourly cloud (spanned between 1.2957/08) following repeated rejection on approach to psychological 1.3000 barrier and Monday’s close in red.
Overall structure remains bullish and favors further upside with final break through 1.3000 pivot to attack strong resistance at 1.3088 (base of falling weekly Ichimoku cloud).
Strong supports at 1.2915/08 (rising 10SMA / daily Tenkan-sen) are expected to ideally contain and keep the structure intact, however, extended dips can be expected on violation of these supports.
Higher low of 04 May at 1.2830 marks key near-term support, loss of which would signal deeper correction and expose next pivotal supports at 1.2770/55.
Res: 1.2953, 1.2987, 1.3000, 1.3088
Sup: 1.2915, 1.2908, 1.2860, 1.2830
Markets Directionless After The Fear Gauge Hits A 24-Year Low
The CBOE Volatility Index fell yesterday to the lowest level since 1993 to trade in single digits. The implied volatility index, which is based on option contracts on the S&P 500 index for one month is aimed to look forward and perform as a leading indicator as it's driven by the pricing of calls and puts contracts.
While this could be interpreted to mean that good times lie ahead, it also indicates that the party may be over soon. Volatility does not stay at low levels for prolonged periods of time, and we're likely to see the index reverting to its 200-days moving average around 15. Just don't let the extremely quiet market conditions trap you into taking huge risks.
The markets' reaction to the French election results were muted. The Euro sold off after an initial rally above 1.10, and the same applied to European equities which closed slightly lower. Asian investors were also seen stepping back after sending equities to a two-year high, waiting for a fresh catalyst to decide their next move.
The Aussie was the only currency on the move early Tuesday. AUDUSD fell 0.5% after Australian retail sales unexpectedly fell 0.1% in March and February figures were revised lower to -0.2%. This marks the third drop in four months, and it would become a worrying sign if the downtrend trend sustains.
Saudi's Oil Minister Khalid Al-Falih's comment on Monday that oil producers would "do whatever it takes" to rebalance the market did little to support prices. He also indicated that production cuts might be extended beyond 2017, but this is likely to be faced with skepticism from investors, especially considering that the longer the period of cuts to output, the less likely compliance might hold. However, if OPEC and non-OPEC members agree on an extension of nine months or longer, this would at least put a floor on prices.