Sample Category Title
USD/JPY Analysis: Sets Eye On 114.00
'Aside from employment, we've seen some negative surprises in recent U.S. data while the Fed marches ahead to a June rate hike. I think the gap between the two will eventually bring down the dollar.' – Bank of Tokyo-Mitsubishi UFJ (based on Business Recorder)
Pair's Outlook
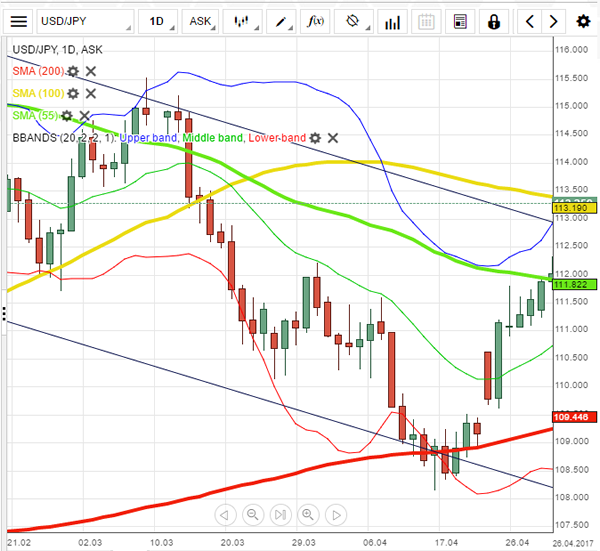
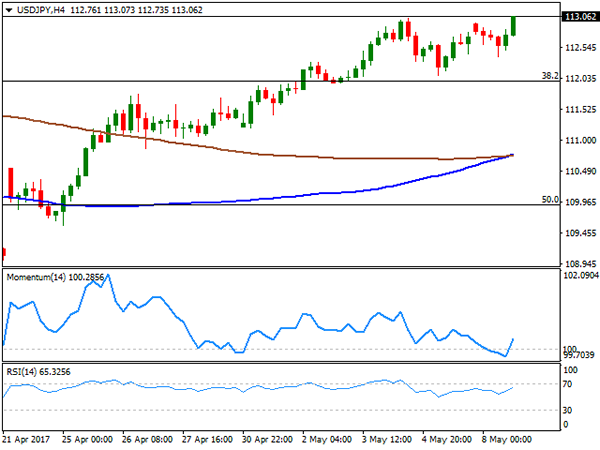
Not only did the USD/JPY pair manage to recover from its intraday low yesterday, but even establish a new seven-week high of 113.30. The Greenback refuses to give up the bullish momentum, exploiting the recent recovery further, now aiming to reclaim the 114.00 major level. A successful attempt to reach this area is still likely to be short-lived, amid a tough resistance cluster located a few pips higher. Furthermore, assuming the given pair completely broke out from trading within the descending channel's borders, continued positive outcomes are nothing out of the ordinary, which could even lead to reaching a larger scale down-trend, currently located around 117.00.
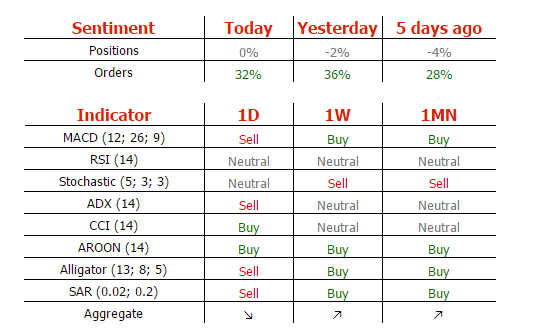
Traders' Sentiment
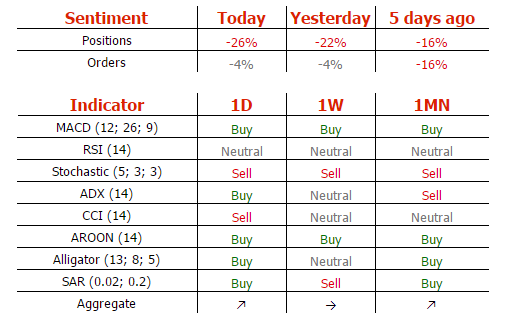
Bears keep gaining numbers, as 63% of all open positions are now short. Meanwhile, the share of sell orders remains unchanged at 52%.
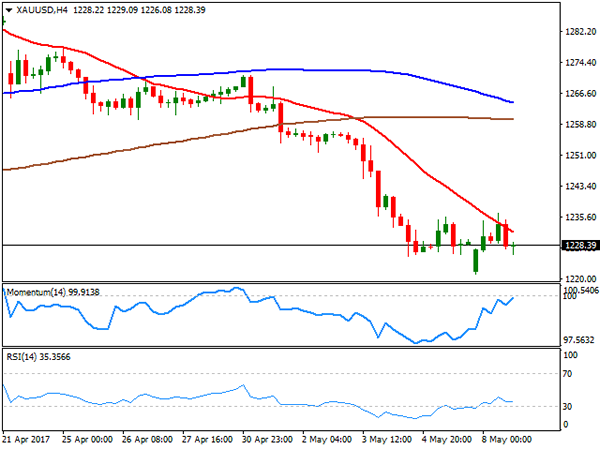
Gold Analysis: Remains Below 1,230 Level
'Should volatility remain becalmed, gold may find itself on the losing end of a deeper correction to the downside.' – Jeffrey Halley, OANDA (based on Reuters)
Pair's Outlook
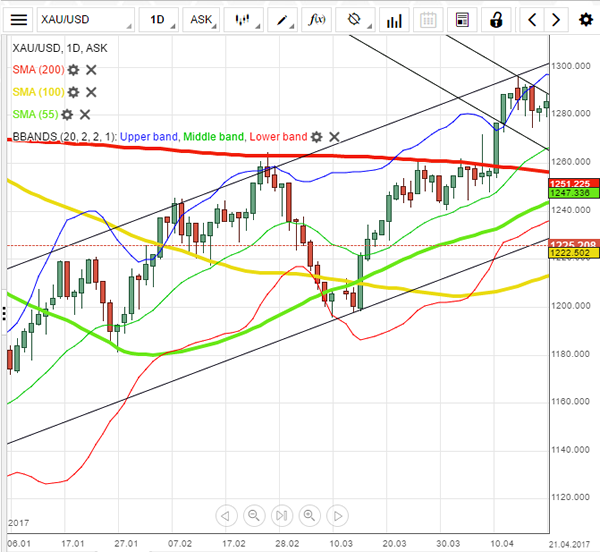
During the early hours of Tuesday's trading session the yellow metal's price remained above the 1,225 mark, as the bullion found support in the 100-day SMA. The simple moving average is located at the 1,225.59 level and provides significant support, as it has kept the metal's price from falling during this week. It is most likely that the commodity price will continue the decline, if the SMA is passed, as the lower Bollinger band has moved below the 100-day SMA. Due to that factor the next targeted support is the 38.20% Fibonacci retracement level, which is located at the 1,219.20 level.
Traders' Sentiment
SWFX sentiment is neutral, regarding the metal. However, 66% of SWFX trader set up orders are to buy the bullion.
German Industrial Orders Increase For Second Consecutive Month
'Although growth of output, new orders and employment all eased, this was mostly offset by more evidence of supply chain pressures as input delivery times lengthened to the greatest extent in six years .' - Trevor Balchin, IHS Markit
According to the Federal Statistics Office, German manufacturing orders rose more than analysts estimated. The number of seasonally-adjusted industrial orders in March surged 1.0%, while most of the experts anticipated only a 0.7% increase. Despite the growth was 2.5% lower than in the previous month, it still remained a signal that the leading European economy develops at a healthy pace. Sower growth came in mainly due to weaker domestic demand, which plunged 3.8%, as a result of stronger pressure on wage growth and selling prices. In terms of products, the weakest interest was shown in the intermediate goods, orders for which fell 3.7%. However, it was not enough to offset the surging exports, which increased 4.8%. Namely, bookings from the Euro zone countries soared 6.8%, following a sharp decrease of 8.1% in February. Such difference to a certain extent was influenced by uncertainty associated with anticipation of an official adoption of the Brexit bill and the French Presidential Election.
US House Prices Post First Quarterly Fall In Five Years
'Housing demand appears to have been curbed in recent months due to the deterioration in housing affordability caused by a sustained period of rapid house price growth during 2014-16 .' — Martin Ellis, Halifax
A monthly report released by IHS Markit showed that change of house prices in the UK did not justify analysts' expectations. While majority of experts anticipated an increase of 0.1% in April, the revealed data showed the opposite result. Despite the minor fluctuations, UK house prices, in general, remained unchanged for the last three months. The reason behind price stagnation is partly based on the fact that the dynamics of home sales in March and April was very similar to January and February, and remained in line with the two-year average. In addition, experts referred to the deficit of supply in the market, as the number of houses available for purchase fell for the 13th consecutive month. In a more general context, a decrease in the pace of job creation as well as rising inflation also reduced consumers' ability to acquire new houses. On the other hand, analysts noted that confidence in the UK housing market is gradually improving, following a record fall after the Brexit referendum in June 2016. This fact in conjunction with very low mortgage interest rates should offset the abovementioned constraints and slightly raise housing prices.
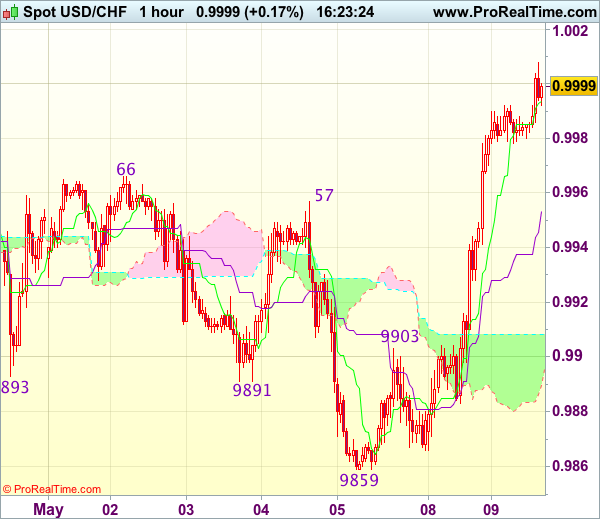
Trade Idea : USD/CHF – Buy at 0.9955
USD/CHF - 1.0005
Most recent candlesticks pattern : N/A
Trend : Near term up
Tenkan-Sen level : 0.9994
Kijun-Sen level : 0.9953
Ichimoku cloud top : 0.9908
Ichimoku cloud bottom : 0.9890
Original strategy :
Buy at 0.9930, Target: 1.0030, Stop: 0.9895
Position : -
Target : -
Stop : -
New strategy :
Buy at 0.9955, Target: 1.0055, Stop: 0.9920
Position : -
Target : -
Stop : -
As the greenback has rallied yesterday and broke above indicated resistance at 0.9966-69, adding credence to our view that low has been formed at 0.9859 and suggesting recent decline from 1.0108 top has ended, hence consolidation with upside bias remains for further gain to 1.0025-30, however, near term overbought condition should prevent sharp move beyond previous resistance at 1.0067 and price should falter below 1.0090, bring retreat later.
In view of this, we are looking to buy dollar on dips as the Kijun-Sen (now at 0.9953) should limit downside. Below 0.9925-30 would suggest top is possibly formed, bring test of previous resistance at 0.9903 but break there is needed to add credence to this view, brig further fall to 0.9880-85.
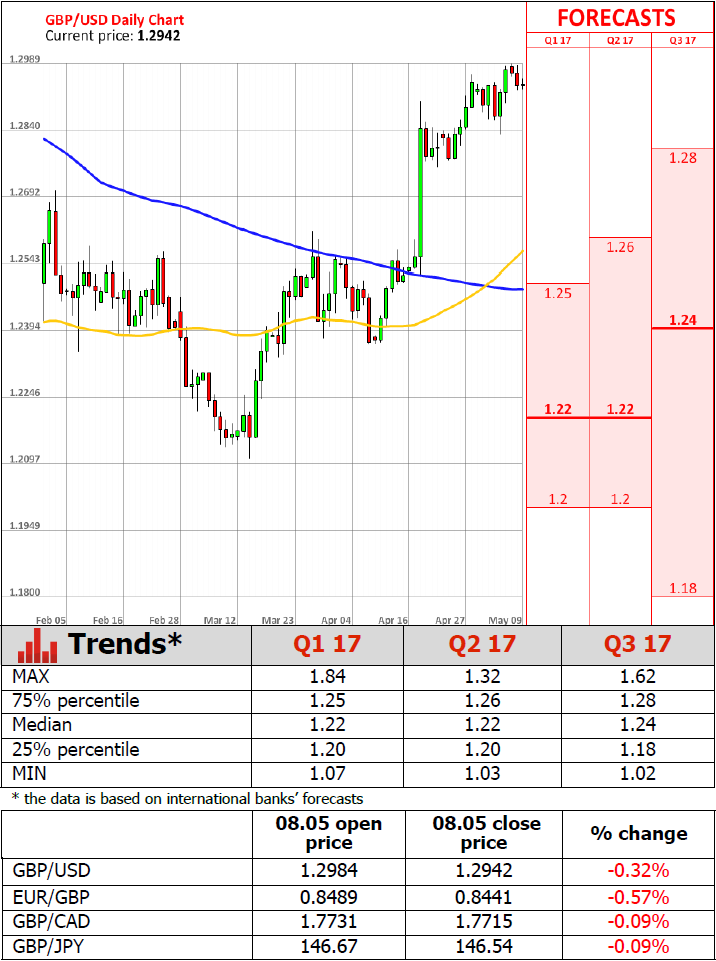
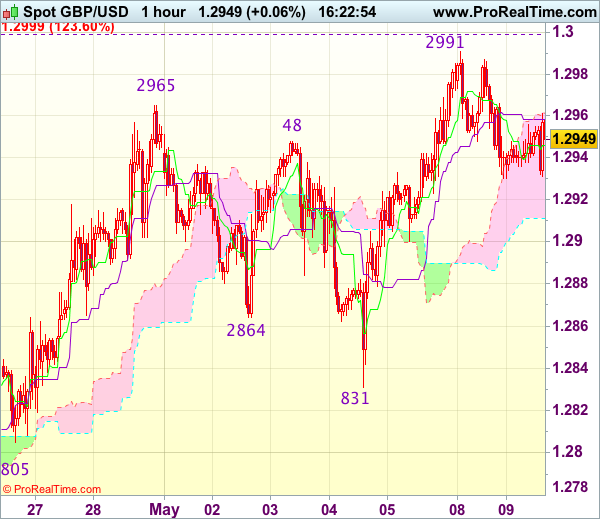
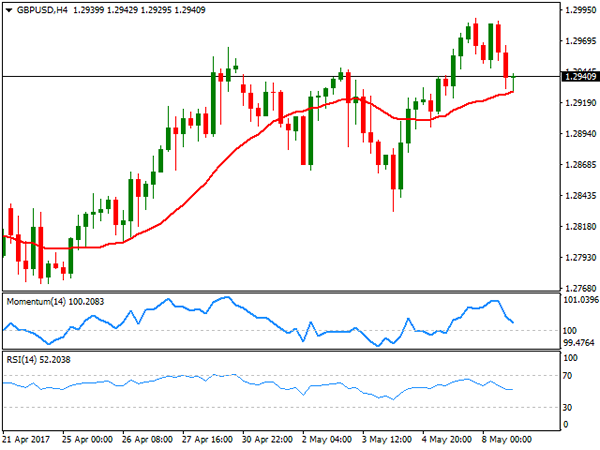
Trade Idea : GBP/USD – Sell at 1.2960
GBP/USD - 1.2941
Most recent candlesticks pattern : N/A
Trend : Near term up
Tenkan-Sen level : 1.2946
Kijun-Sen level : 1.2959
Ichimoku cloud top : 1.2961
Ichimoku cloud bottom : 1.2911
Original strategy :
Buy at 1.2900, Target: 1.3000, Stop: 1.2865
Position : -
Target : -
Stop : -
New strategy :
Sell at 1.2960, Target: 1.2860, Stop: 1.2995
Position : -
Target : -
Stop : -
Although cable rose to as high as 1.2991 yesterday, the subsequent retreat suggests consolidation below this level would be seen and pullback to 1.2900-10 is likely, however, break there is needed to suggest top is possibly formed, bring further fall to 1.2875-80 but price should stay well above last week’s low at 1.2831, risk from there is seen for another rebound later.
In view of this, we are looking to turn short on recovery. Above said resistance at 1.2991 would extend recent upmove to 1.2999-00 (1.236 times projection of 1.2109-1.2616 measuring from 1.2365 and psychological resistance), then towards 1.3040-50 which is likely to hold from here due to near term overbought condition.
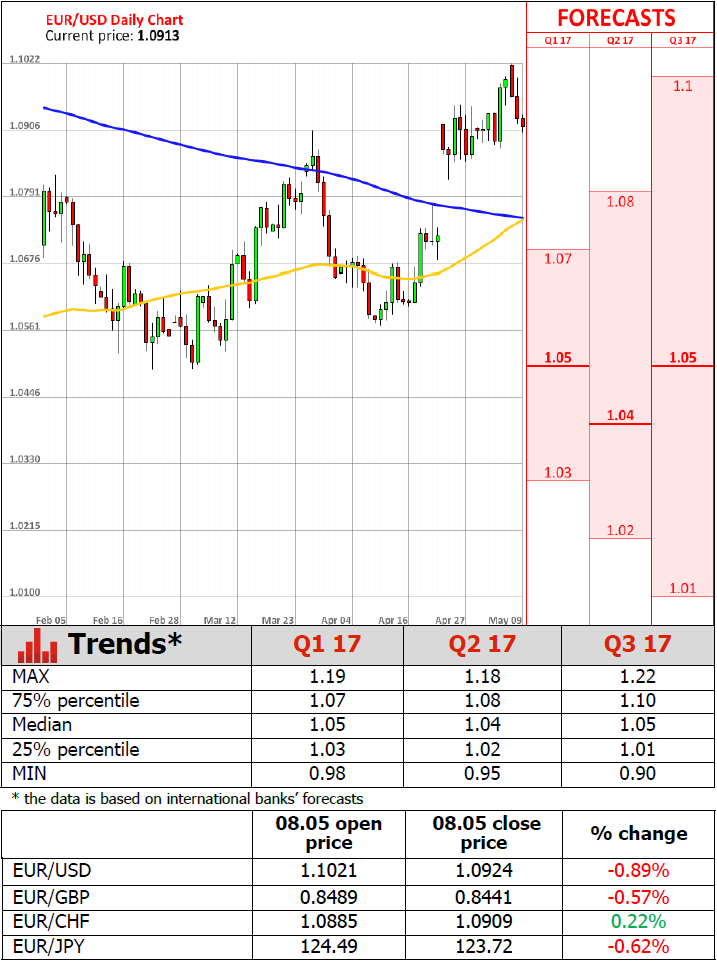
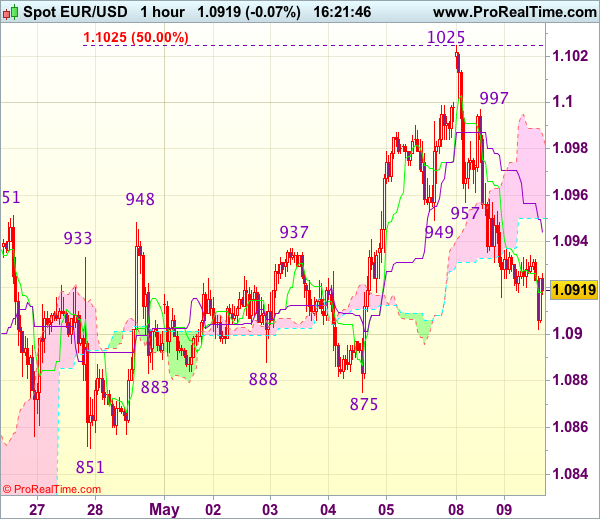
Trade Idea : EUR/USD – Sell at 1.0970
EUR/USD - 1.0913
Most recent candlesticks pattern : N/A
Trend : Near term up
Tenkan-Sen level : 1.0918
Kijun-Sen level : 1.0944
Ichimoku cloud top : 1.0986
Ichimoku cloud bottom : 1.0950
Original strategy :
Sell at 1.0980, Target: 1.0880, Stop: 1.1015
Position : -
Target : -
Stop : -
New strategy :
Sell at 1.0970, Target: 1.0870, Stop: 1.1005
Position : -
Target : -
Stop : -
Euro’s selloff after yesterday’s initial brief rise to 1.1025 suggests top has been formed there and consolidation with mild downside bias is seen for further fall to 1.0875 support, however, break there is needed to add credence to this view, bring retracement of recent rise to 1.0851 support which is likely to hold from here due to near term overbought condition.
In view of this, we are looking to sell euro on recovery but at a lower level as 1.0970-80 should limit upside. Above resistance at 1.0997 would bring retest of said yesterday’s high at 1.1025, however, break there is needed to signal recent upmove from 1.0340 low has resumed for headway to 1.1050 but reckon upside would be limited to 1.1065-70 (61.8% projection of 1.0602-1.0951 measuring from 1.0851).
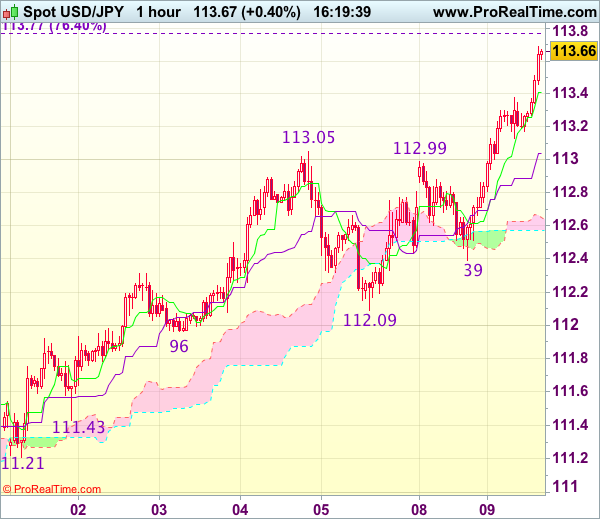
Trade Idea : USD/JPY – Buy at 113.10
USD/JPY - 113.62
Most recent candlesticks pattern : N/A
Trend : Near term up
Tenkan-Sen level : 113.41
Kijun-Sen level : 113.04
Ichimoku cloud top : 112.65
Ichimoku cloud bottom : 112.57
New strategy :
Buy at 113.10, Target: 114.10, Stop: 112.75
Position : -
Target : -
Stop : -
As dollar has rallied after breaking above previous resistance at 113.05 (now support), adding credence to our bullish view that recent upmove is still in progress and may extend further gain to 113.75-0 (76.4% retracement of 115.51-108.13) and later towards 114.00, however, reckon upside would be limited to 114.25-30 (100% projection of 110.87-113.05 measuring from 112.09) and 114.50-55 (100% projection of 108.13-111.78 measuring from 110.87) should hold.
In view of this, would not chase this rise here and would be prudent to buy dollar on pullback as said previous resistance at 113.05 should limit downside, bring another rise. Below 112.80 would defer and suggest top is possibly formed, bring correction to 112.55-60 but support at 112.39 should contain weakness.
Foreign Exchange Market Commentary: EUR/USD, USD/JPY, GBP/USD, GOLD, WTI CRUDE, DJIA, FTSE100, DAX
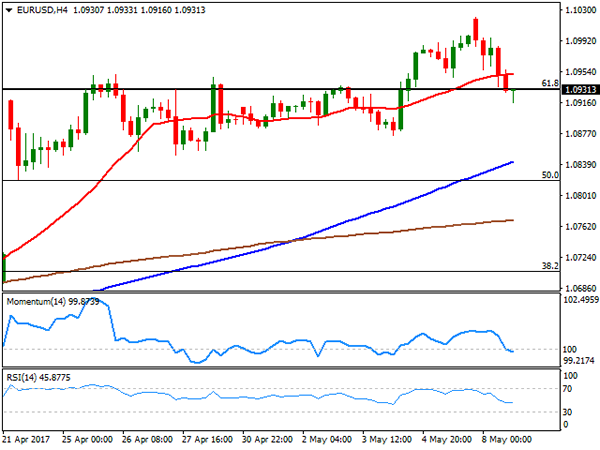
EUR/USD
The American dollar was able to attract some interest this Monday, ending the day generally higher across the board. The EUR/USD pair peaked at 1.1020 early Asian trading, its highest for this 2017, as centrist Emmanuel Macron became the new French president. But given that such result was mostly priced in, the common currency was unable to rally on the positive news. In the macroeconomic front, data released in Europe continued to indicate a healthy economic scenario, given that German Factory Orders surged by 1.0% in March, and by 2.4% when compared to a year earlier, slightly better-than-expected. Also, the EU Sentix Investor Confidence index advanced up to 27.4 in May, beating expectations of 25.3
The dollar gathered further momentum with the US opening, backed by comments from Fed's Mester, who said that the Central Bank has already met its employment goal and is nearing its inflation goal, despite some weak recent economic data, so it should continue raising interest rates. US April labor market conditions index rose by 3.5%, following an upwardly revised 3.6% in March, becoming the two strongest readings since early 2015, and somehow reaffirming Mester's comments.
The EUR/USD pair fell to a daily low of 1.0916, bouncing back to settle around 1.0930 by the end of the US session, but short term poised to extend its decline, given that in the 4 hours chart, the price is developing below its 20 SMA, whilst technical indicators have entered negative territory although with limited bearish strength. The price is currently struggling around a major Fibonacci resistance, the 61.8% retracement of the post US-election slump, and will take either and advance beyond 1.0950 or a slide below 1.0890 to confirm directional strength this Tuesday.
Support levels:1.0950 1.0900 1.0855
Resistance levels: 1.1045 1.1080 1.1120
USD/JPY
The USD/JPY pair surged in the US afternoon to a fresh 2-month high of 113.09, after trading uneventfully around Friday's close for most of the day. The advance came as the market turned its attention to Central Banks, particularly the US Federal Reserve and chances of a June hike, revived by comments from Fed's Mester, who claimed that the economy has pretty much achieved Fed's goals. The US will release its April inflation figures this Friday, and a better-than-expected reading will support the case further for some further dollar gains. Rising US Treasury yields also backed the intraday rally, with the 10-year note benchmark up to 2.38% from previous 2.35%. The pair is gaining bullish potential ahead of the Asian opening, although further gains would need additional confirmation. In the 4 hours chart, the 100 and 200 SMAs converge around 110.70, while technical indicators have turned north, with the Momentum still within neutral territory and the RSI around 65, enough at least, to keep the downside limited. Early March lows in the 113.60 region provide a critical resistance that needs to be broken before a steeper recovery.
Support levels: 112.80 112.45 112.00
Resistance levels: 113.30 113.65 114.00
GBP/USD
The GBP/USD pair closed the day not far from a daily low of 1.2931, marginally lower after topping at 1.2988 last Friday. The pair holds near the mentioned daily high, reluctant to dollar's intraday advance. The macroeconomic calendar in the UK was extremely light, with no fresh headlines about upcoming Brexit negotiations and just the Halifax House Price index being released. According to the report, house prices in the three months to April were 3.8%, matching a year earlier reading, while when compared to March, house prices fell by 0.1%. During Asian trading hours, the British Retail Consortium will release its April retail sales measure. In the meantime, the pair presents a neutral stance according to the 4 hours chart, as the intraday decline stalled around a horizontal 20 SMA, now the immediate support, whilst technical indicators turned south within positive territory, losing downward strength near their mid-lines. The pair can fall further on a downward acceleration below 1.2890, but the trend will only be considered bearish with a move below 1.2770.
Support levels: 1.2930 1.2885 1.2850
Resistance levels: 1.2965 1.3010 1.3060
GOLD
Gold prices rallied at the beginning of the day, but were unable to hold on to gains and trimmed all of their daily gains ahead of the close. Spot settled at $1,228.19 a troy ounce, as with French elections out of the way, attention shifted back to the US and the possibility of a June rate hike. The bright metal fell in the American afternoon down to a daily low of 1,226.08, and maintains the bearish tone seen on previous updates given that the early advance was rejected on a test of the 100 DMA. Furthermore, the daily chart shows that the Momentum indicator resumed its decline after a brief upward correction, whilst the RSI indicator remains flat around 33. Shorter term, the 4 hours chart shows that the price was contained by a bearish 20 SMA, currently at 1,231.85, while technical indicators have managed to correct extreme oversold readings, but remain within bearish territory, with the RSI heading south around 34 and anticipating some further slides ahead.
Support levels: 1,225.60 1,214.10 1,203.80
Resistance levels: 1,231.85 1,242.50 1,250.90
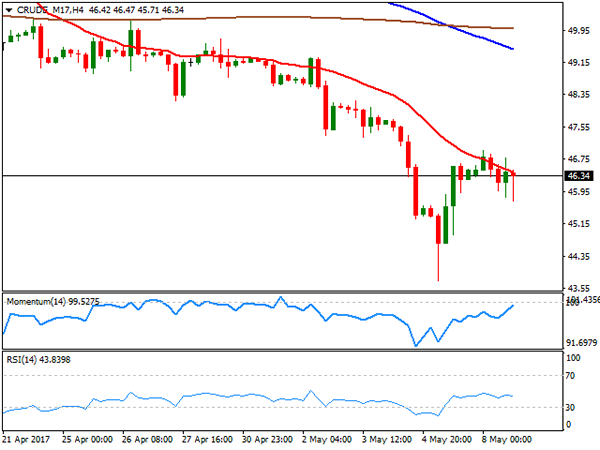
WTI CRUDE OIL
Crude oil prices closed the day pretty much unchanged, with West Texas Intermediate futures ending at $46.40 a barrel, reverting an early slide down to 45.71. The commodity was unable to attract buyers, despite news showing OPEC and non-OPEC producers are considering extending supply cuts into 2018, as US increasing production revived concerns over a worldwide glut. The daily chart for US oil shows that technical indicators have managed to correct the extreme oversold readings reached late last week, but the RSI is currently flat around 28, while the Momentum indicator recovered within positive territory, rather indicating limited selling interest than suggesting further gains ahead. In the 4 hours chart, the commodity remained capped by a bearish 20 SMA, while technical indicators also corrected oversold conditions but remain within bearish territory, in line with the longer term perspective. The commodity remains vulnerable, with chances of a dip down to the 42.00/42.50 region later this week.
Support levels: 45.90 45.30 44.70
Resistance levels: 47.10 47.75 48.50
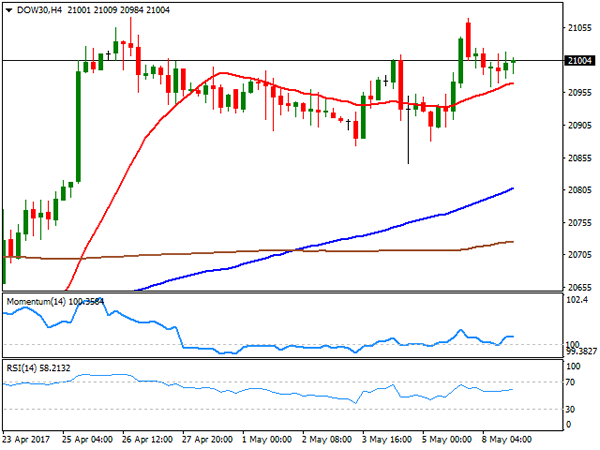
DJIA
Wall Street closed little changed after a dull trading session, with the DJIA up 5 points, to 21,012.28, and the Nasdaq Composite advancing 2 points, to 6,102.66. The S&P ended the day unchanged at 2,399.38, holding near record highs set last week. Within the Dow, Apple was the best performer, adding 2.71%, followed by Exxon Mobil that managed to advance 1.05%. El du Pont remains among the worst performers this month, leading decliners with a 1.10% loss, followed by Goldman Sachs that shed 0.86%. The technical picture hasn't changed, with the benchmark still confined to a tight range daily basis, and neutral-to-bullish, as in the daily chart, it holds above a bullish 20 DMA, whilst technical indicators hold well above their mid-lines, lacking clear directional strength. In the 4 hours chart, intraday slides were reverted on approaches to a still bullish 20 SMA, whilst technical indicators also stand pat within positive territory.
Support levels: 20,986 20,939 20,898
Resistance levels: 21,030 21,071 21,138
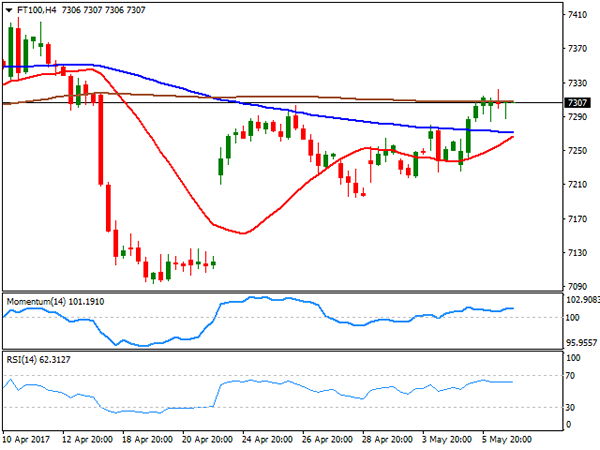
FTSE100
The FTSE 100 added 3 points, closing at 7,300.86, despite the sour tone of the leading mining sector. A weaker Pound partially offset losses in the sector, which fell on news that Chinese imports rose by less than expected in April, spurring concerns of base metals' demand. Anglo American suffered the most, leading decliners with a 2.04% loss, followed by Antofagasta that shed 2.02%. Intu Properties was the best performer, advancing 2.15% after housing data released earlier on the day showed steady growth in prices. Daily basis, the index presents a neutral-to-bullish stance as despite holding above its moving averages, technical indicators are flat around their mid-lines, indicating the absence of demand. In the 4 hours chart, the index was unable to surpass its 200 SMA, holding around it, whilst indicators remain within positive territory, but also lacking upward strength.
Support levels: 7,284 7,247 7,200
Resistance levels: 7,332 7,385 7,439
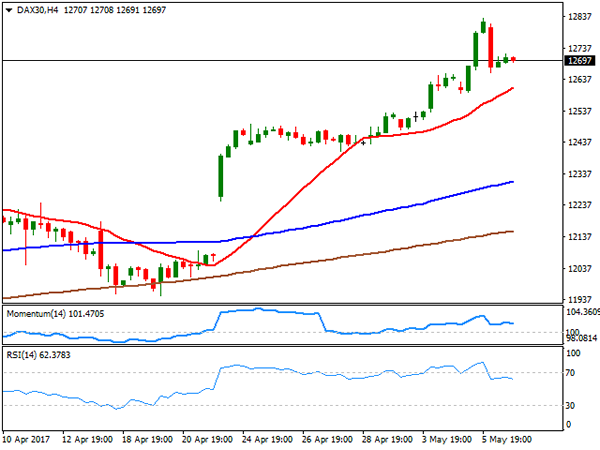
DAX
European equities closed the day generally lower, with the German DAX settling at 12,694.55, down by 0.18% or 22 points, with base metal-related equities leading the way lower after Chinese trade balance showed that the world's second largest economy reduced its buying to the slowest pace in six months. Equities briefly rallied at the opening on Macron's victory, but gains were quickly reverted. Within the DAX, only 8 members managed to close with gains, with Deutsche Lufthansa being the best performer, up 3.47%. Commerzbank led decliners, ending the day 3.28% lower, followed by Linde that shed 2.17%. Daily basis, the index remains near record highs and above all of its moving averages that retain their bullish slopes, whilst technical indicators have barely retreated within overbought levels, limiting the risk of a steeper decline. Shorter term, and according to the 4 hour chart, the downward potential is also limited, with the price remains well above a bullish 20 SMA as technical indicators retreated from overbought levels, but lost downward strength well above their mid-lines.
Support levels: 12,668 12,623 12,575
Resistance levels: 12,720 12,765 12,812
Technical Outlook: AUDUSD – Fresh Bears At 4-Month Low/Weekly Cloud Base
The Aussie dollar remains in strong bearish mode and posted new four-month low at 0.7333 on Tuesday on strong bearish acceleration after disappointing Australian Retail Sales data for March. Markets are awaiting release of Australian budget data which may have stronger impact on the pair.
Bears found temporary footstep just ahead of strong support at 0.7329 (weekly cloud base) and may show stronger hesitation here as daily studies are oversold, but no firmer bullish signal seen so far.
Falling daily Tenkan-sen/10SMA offer strong resistances at 0.7445 which is expected to cap extended corrective upticks.
Close below cracked 0.7384 support (Fibo 61.8% of 0.7159/0.7747 ascend) which so far resisted several attacks, is needed to confirm bearish stance. Eventual break below weekly cloud base would expose target at 0.7298 (Fibo 76.4% of 0.7159/0.7747) and risk extension towards key med-term support at 0.7159 base (posted on end of Dec 2016).
Res: 0.7366, 0.7396, 0.7428, 0.7445
Sup: 0.7329, 0.7301, 0.7286, 0.7250