Sample Category Title
USD/JPY Bearish Divergence Waiting For Sellers
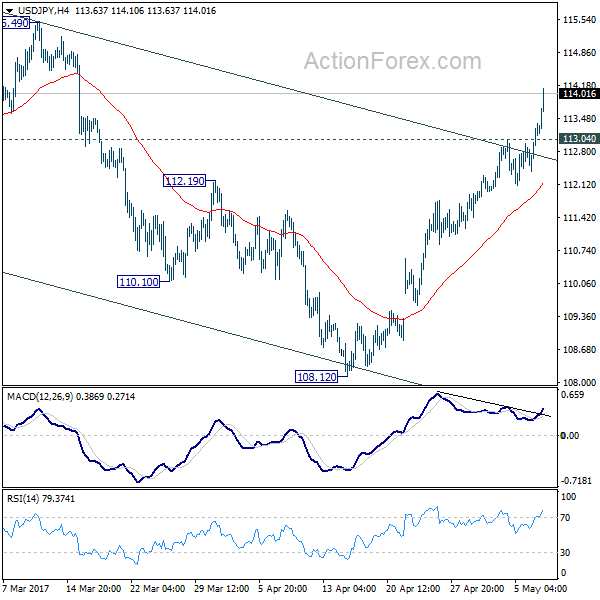
The USD/JPY is in bullish trend following inverted SHS pattern on H4 chart. At this point we see bearish divergence looming at POC zone. POC zone 114.50-65 (W H5, Order block, historical sellers) could tank the price should we see a retracement into the zone. Adding to that, the ATR has already been overshot so the retracement is likely to happen. Targets are 114.00 and 113.50 (W H4 and M H4). Treat this setup as counter trend and a correction in an uptrend.
Trade Idea: GBP/USD – Sell at 1.2955
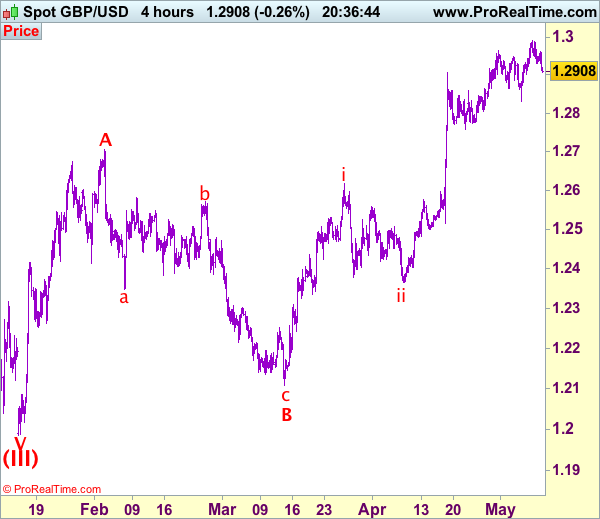
GBP/USD – 1.2918
Recent wave: Wave V of larger degree wave (III) has ended at 1.1986 and major correction has commenced from there for gain to 1.3000 and 1.3140-50
Trend: Near term up
Original strategy :
Buy at 1.2845, Target: 1.3025, Stop: 1.2785
Position: -
Target: -
Stop: -
New strategy :
Sell at 1.2955, Target: 1.2775, Stop: 1.3015
Position: -
Target: -
Stop:-
As cable has retreated after rising to 1.2995 yesterday, suggesting consolidation below this level would be seen with mild downside bias for minor correction to 1.2900 support, break there would bring further fall towards 1.2831 support, however, a break below this level is needed to signal a temporary top has been formed at 1.2995, bring retracement of recent rise to 1.2770-75 but previous support at 1.2757 should hold from here. We are keeping our view that the wave c as well as larger degree wave B has ended at 1.2109, hence impulsive wave C has commenced from there with wave i of C ended at 1.2616, follow by a correction to 1.2365 (end of wave ii) and wave iii rally is unfolding.
Our preferred count on the daily chart is that cable's rebound from 1.3500 (wave (A) trough) is unfolding as a wave (B) with A ended at 1.7043, followed by triangle wave B and wave C as well as wave (B) has ended at 1.7192, the subsequent selloff is the larger degree wave (C) which is still unfolding with minor wave (III) of larger degree wave 3 ended at 1.1986, hence wave (IV) correction is in progress which could either be a triangle wave (IV) of a complex formation but upside should be limited to 1.3500 and price should falter well below 1.4000, bring another decline in wave (V) of 3 for weakness to 1.1500, then 1.1200.
On the upside, whilst recovery to 1.2950-55 cannot be ruled out, reckon said resistance at 1.2995 would cap upside and bring another retreat later. Above said resistance at 1.2995 would extend recent upmove to 1.3040-50 but overbought condition should limit upside to 1.3075-80 and price should falter below 1.3100.
EUR/USD Mid-Day Outlook
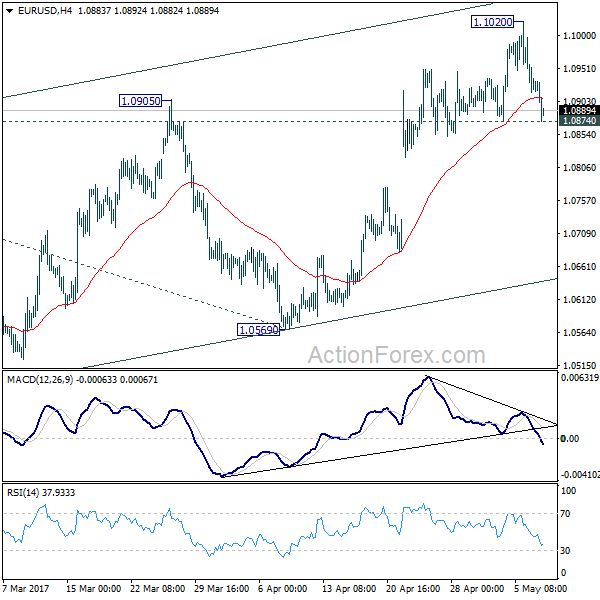
Daily Pivots: (S1) 1.0885; (P) 1.0953 (R1) 1.0991; More....
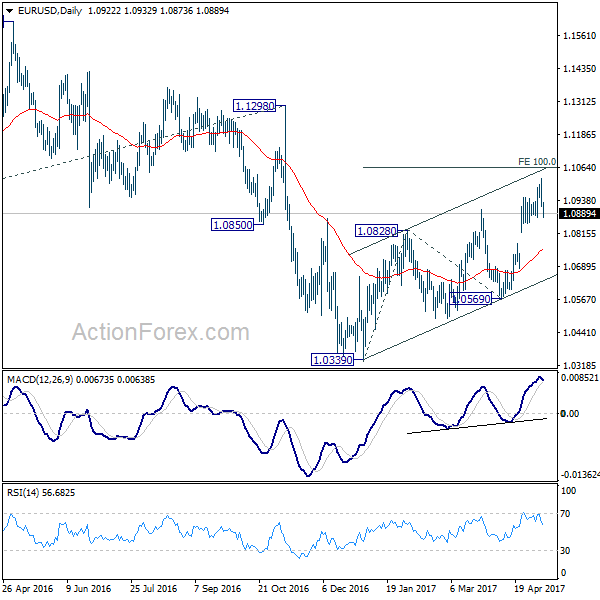
Intraday bias in EUR/USD remains neutral for consolidation below 1.1020 temporary top. Another rise will be expected as long as 1.0874 support holds. Above 1.1020 will extend current rally to 100% projection of 1.0339 to 1.0828 from 1.0569 at 1.1058. However, rise from 1.0339 is still seen as a corrective move. Hence we'd expect strong resistance from 1.1058 projection to limit upside and bring near term reversal. On the downside, break of 1.0874 support will turn bias back to the downside for 1.0569 support first.
In the bigger picture, as long as 1.1298 key resistance holds, whole down trend from 1.6039 (2008 high) is still expected to continue. Break of 1.0339 low will send EUR/USD through parity to 61.8% projection of 1.3993 to 1.0461 from 1.1298 at 0.9115. However, considering bullish convergence condition in weekly MACD, break of 1.1298 will indicate long term reversal.
GBP/USD Mid-Day Outlook
Daily Pivots: (S1) 1.2917; (P) 1.2952; (R1) 1.2976; More...
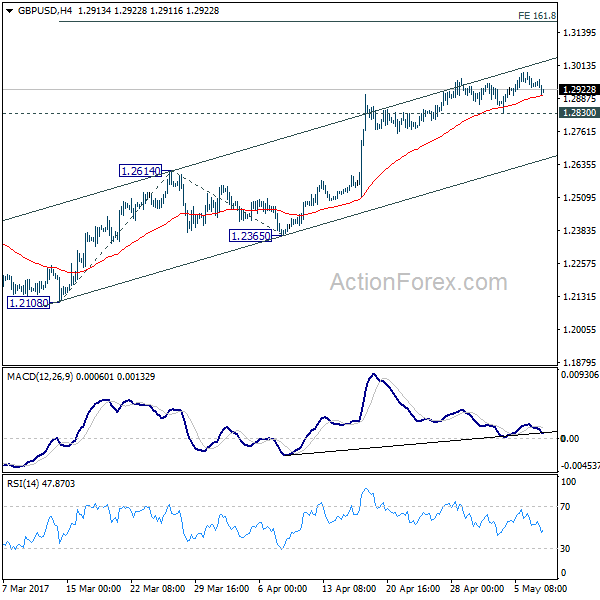
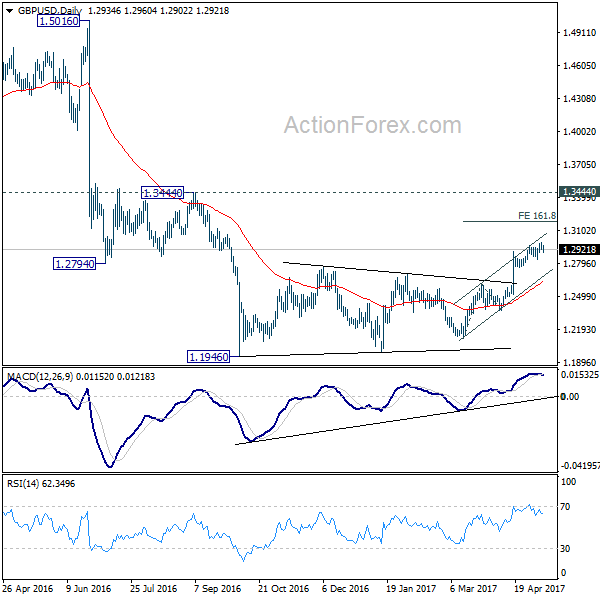
No change in GBP/USD's outlook. With 1.2830 minor support intact, further rise is still expected. Current rally could target 161.8% projection of 1.2108 to 1.2614 from 1.2365 at 1.3184. At this point, price actions from 1.1946 are still interpreted as a correction pattern. Therefore, we'd expect strong resistance below 1.3444 to bring larger down trend resumption. On the downside, break of 1.2830 support will indicate short term topping. In such case, intraday bias will be turned back to the downside for 1.2614 support.
In the bigger picture, fall from 1.7190 is seen as part of the down trend from 2.1161. There is no sign of medium term reversal yet. Sustained trading below 61.8% projection of 2.1161 to 1.3503 from 1.7190 at 1.2457 will target 100% projection at 0.9532. Overall, break of 1.3444 resistance is needed to confirm medium term bottoming. Otherwise, outlook will remain bearish.
USD/CHF Mid-Day Outlook
Daily Pivots: (S1) 0.9905; (P) 0.9948; (R1) 1.0030; More.....
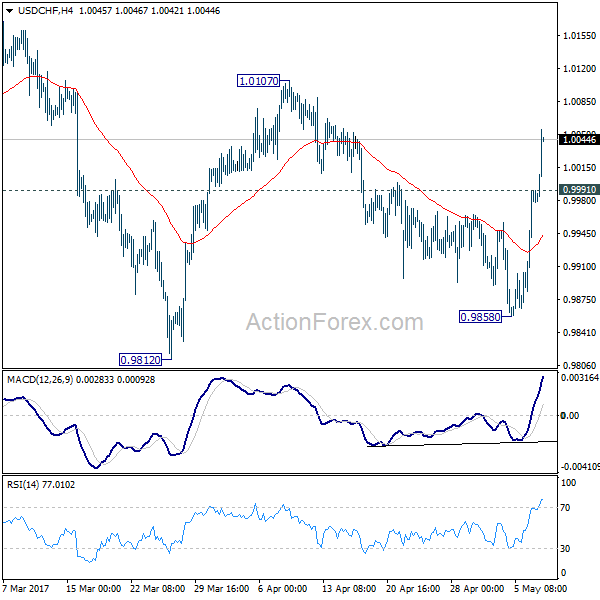
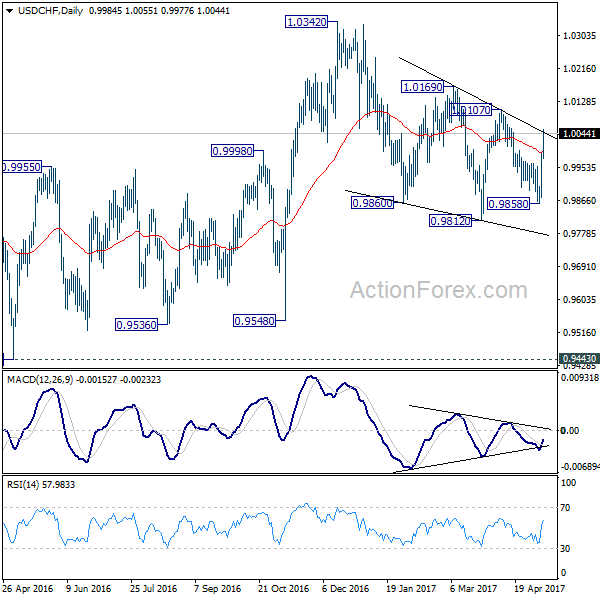
USD/CHF's rally extends to as high as 1.0055 so far today and intraday bias remains on the upside. As noted before, current development revived the case that correction from 1.0342 is already completed at 0.9812. Further rise should be seen to 1.0107 resistance first. Decisive break there will bring a retest on 1.0342 high. On the downside, below 0.9991 minor support will turn bias neutral and bring consolidation first before staging another rise.
In the bigger picture, we're still maintaining that firm break of 1.0342 key resistance is needed to confirm underlying bullish momentum in the pair. However, the corrective nature of the fall from 1.0342 is starting to give the medium term outlook a bullish favor. Hence, in stead of looking for topping signal around 1.0342, we'd now pay closer attention to upside acceleration as USD/CHF approaches this level again.
Trade Idea: GBP/JPY – Buy at 146.20
GBP/JPY - 147.20
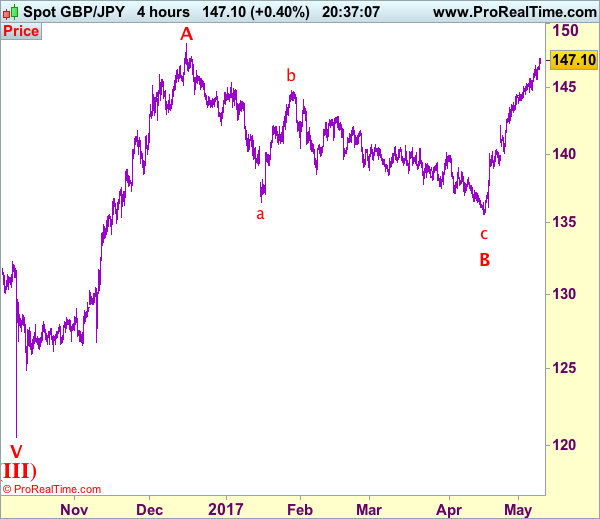
Recent wave: Medium term low formed at 120.50 and (A)-(B)-(C) major correction has commenced with (A) leg ended at 148.45, hence wave (B) is unfolding for retreat to 131.00-10.
Trend: Near term up
Original strategy:
Buy at 144.50, Target: 146.50, Stop: 143.90
Position: -
Target: -
Stop: -
New strategy :
Buy at 146.20, Target: 148.20, Stop: 145.60
Position: -
Target: -
Stop:-
As sterling has surged again after finding renewed buying interest at 145.70, adding credence to our bullish view that recent upmove from 135.60 is still in progress and may extend further gain to 148.00, however, near term overbought condition should prevent sharp move beyond previous chart resistance at 148.45, bring retreat later.
In view of this, would not chase this rise here and would be prudent to buy sterling on pullback as 146.10-20 should limit downside, bring another rise later. Below said support at 145.70 would defer and suggest a temporary top is possibly formed, bring correction to 145.00-10 but only break of support at 144.85 would provide confirmation, bring correction to 144.50 first.
Our preferred count is that larger degree wave V with circle is unfolding from 251.12 with wave (I) 219.34, (II): 241.38 and wave (III) is subdivided into 1: 192.60, 2: 215.89 (23 Jul 2008) and wave 3 ended at 118.87 earlier in 2009. The correction from there to 162.60 is wave 4 which itself is a double three and is labeled as first a-b-c ended at 151.53, followed by wave x at 139.03, 2nd a ended at 162.60, 2nd b at 146.75 and 2nd c leg of wave 4 ended at 163.00. Therefore, the decline from 163.00 to 116.85 is now treated as wave 5 which also marked the end of larger degree wave (III), hence wave (IV) major correction has commenced for retracement of the wave (III) from 241.38 and upside target at 183.95-00 (50% Fibonacci retracement of the wave (II) from 241.38) had been met, a drop below 160.00 would suggest wave (IV) has ended at 195.85, bring decline in wave (V) for initial weakness to 130 (already met) and 120.
USD/JPY Mid-Day Outlook
Daily Pivots: (S1) 112.66; (P) 112.98; (R1) 113.56; More...
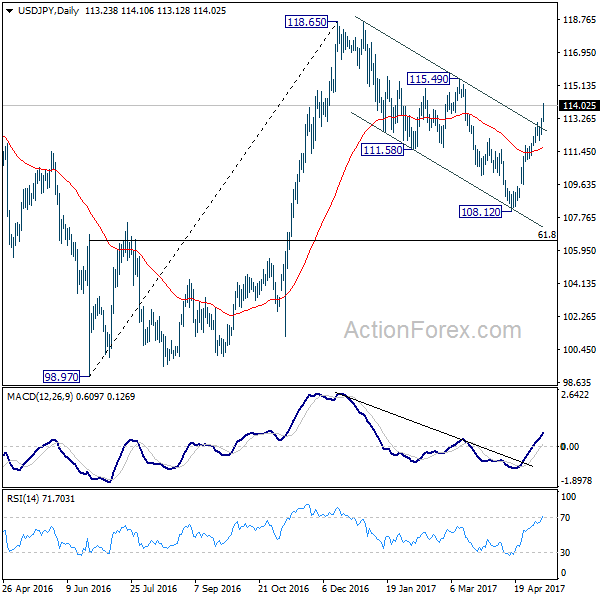
USD/JPY's rally accelerates to as high as 114.10 so far today. The development is in line with our view that correction from 118.65 has completed with three waves down to 108.12. Intraday bias remains on the upside for 115.49 resistance next. Firm break there will now resume larger rally from 98.97 to 125.85 high. On the downside, below 113.04 minor support will turn bias neutral and bring consolidations before staging another rally.
In the bigger picture, price actions from 125.85 high are seen as a corrective pattern. It's uncertain whether it's completed yet. But in case of another fall, downside should be contained by 61.8% retracement of 75.56 to 125.85 at 94.77 to bring rebound. Meanwhile, break of 115.49 resistance will extend the rise from 98.97 to retest 125.85. Overall, rise from 75.56 is still expected to resume later after the correction from 125.85 completes.
Dollar Surges Broadly as Markets Raising Bets on June Fed Hike
Dollar jumps sharply today as markets responded positively to comments from Fed official. Also, as political risks in Europe subsides, traders are getting more certain that Fed will hike in June. Indeed, Fed fund futures are now pricing in 87.7% chance of a June hike, comparing with 67.5% a week ago. Dollar index reaches as high as 99.55 so far today and the break of 99.46 resistance is seen as an indication of near term reversal. Meanwhile, the Japanese yen is trading as the weakest major currency, together with Swiss Franc, as markets are back into risk seeking mode. FTSE, DAX and CAC are all trading mildly higher after yesterday's brief pull back. US futures also point to higher open as NASDAQ and S&P 500 could extend the record runs.
Dollar index in near term reversal
Dollar index's break of 99.46 resistance should confirm near term bottoming at 98.54, after drawing support from lower trend line. The development is so far in line with our view that price actions from 103.82 are merely a consolidation pattern. Judging from the current structure, it's likely a triangle (or a falling wedge as some may call it). Immediate focus is turned back to 55 day EMA (now at 100.01. Sustained break there will now raise the chance that such correction is completed. And in that case, we'll see further rally to 101.34 resistance for confirmation.
In the currency markets, USD/JPY led the way by completing the corrective fall from 118.65 to 108.12 and is back at 113.95. USD/CHF's rally was also impressive and revived the case that correction from 1.0342 is completed 0.9812. Focus will now be on 1.0874 in EUR/USD and 1.2830 in GBP/USD. Firm break of these two support should confirm underlying strength in the greenback.
Cleveland Fed Mester: Be very vigilant against falling behind
Cleveland Fed President Loretta Mester said yesterday that Fed had already met the "maximum employment" part of the duel mandate. Meanwhile, inflation is also "nearing our 2 percent goal". To her, risks are "roughly balanced" and she urged to be "very vigilant against falling behind" and there should be no delay in further policy tightening. She warned that "if we delay too long in taking the next normalization step...we could risk a recession." Mester also sounded trying to talk down Q1 weakness as she said "although we live in a high-frequency world, we cannot overreact to transitory movements in incoming data." And she expects a "rebound in consumer spending over the rest of the year".
Conservatives open record lead over Labour in UK
In UK, latest poll by ICM published yesterday showed that Prime Minister Theresa May's Conservatives is having a record 22 point lead of opposition Labour. It's believed that May will continue with her campaign in securing strong mandate for Brexit negotiation. In particular, May would see newly elected French President-elect Emmanuel Macron's landslide victory as a strong sign of unity in France and EU. And as May said, "he was elected with a strong mandate which he can take as a strong position in the negotiations. In the UK we need to ensure we've got an equally strong mandate and an equally strong negotiating position. And every vote for me and my team will strengthen my hand in those Brexit negotiations."
Prospect of hawkish BoE twist
Meanwhile, focus will also be on BoE Super Thursday this week. While no change in policies is generally expected, a focus will be on the vote split. It should be reminded again then Sterling launched this round of rally against Dollar and Euro after Kristin Forbes surprised the markets by voting for a rate hike back in March. MPC hawks could look through Q1 growth weakness and instead got more nervous with headline CPI back in target range at 2.3% yoy in March. Also, markets are only pricing in less than 60% chance of any move by BoE before end of 2018. There is much room for a hawkish twist in BoE's announcements this weak that could lift Sterling further.
On the data front...
Canada building permits dropped -5.8% mom in March. Germany trade surplus narrowed to EUR 19.6b in March, industrial production dropped -0.4% mom. Swiss unemployment rate dropped to 3.3% in April. Japan labor cash earnings dropped -0.4% yoy in March. Australia retail sales rose 0.1% mom in March.
USD/JPY Mid-Day Outlook
Daily Pivots: (S1) 112.66; (P) 112.98; (R1) 113.56; More...
USD/JPY's rally accelerates to as high as 114.10 so far today. The development is in line with our view that correction from 118.65 has completed with three waves down to 108.12. Intraday bias remains on the upside for 115.49 resistance next. Firm break there will now resume larger rally from 98.97 to 125.85 high. On the downside, below 113.04 minor support will turn bias neutral and bring consolidations before staging another rally.
In the bigger picture, price actions from 125.85 high are seen as a corrective pattern. It's uncertain whether it's completed yet. But in case of another fall, downside should be contained by 61.8% retracement of 75.56 to 125.85 at 94.77 to bring rebound. Meanwhile, break of 115.49 resistance will extend the rise from 98.97 to retest 125.85. Overall, rise from 75.56 is still expected to resume later after the correction from 125.85 completes.
Economic Indicators Update
| GMT | Ccy | Events | Actual | Forecast | Previous | Revised |
|---|---|---|---|---|---|---|
| 23:01 | GBP | BRC Retail Sales Monitor Y/Y Apr | 5.60% | 0.50% | -1.00% | |
| 00:00 | JPY | Labor Cash Earnings Y/Y Mar | -0.40% | 0.40% | 0.40% | |
| 01:30 | AUD | Retail Sales M/M Mar | 0.10% | 0.30% | -0.10% | |
| 05:45 | CHF | Unemployment Rate Apr | 3.30% | 3.30% | 3.40% | |
| 06:00 | EUR | German Industrial Production M/M Mar | -0.40% | -0.70% | 2.20% | |
| 06:00 | EUR | German Trade Balance (EUR) Mar | 19.6B | 21.7B | 21.0B | |
| 12:30 | CAD | Building Permits M/M Mar | -5.80% | 4.20% | -2.50% | -2.80% |
| 14:00 | USD | Wholesale Inventories Mar F | -0.10% | -0.10% |
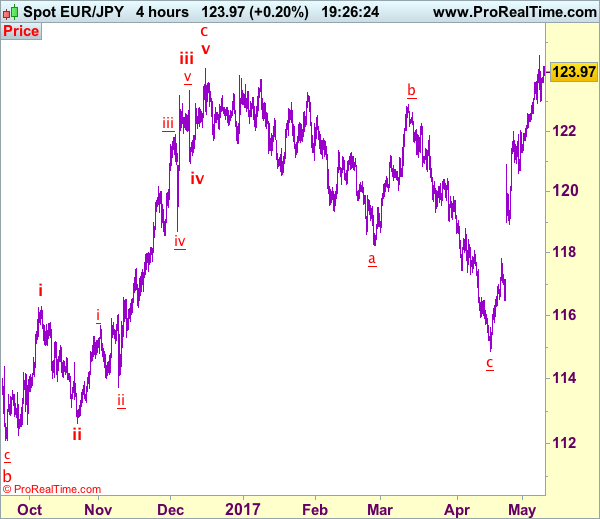
Trade Idea: EUR/JPY – Hold short entered at 124.00
EUR/JPY - 124.03
Recent wave: wave v of (C) ended at 94.12 and major correction in wave A has ended at 149.79
Trend: Near term up
Original strategy:
Sold at 124.00, Target: 122.20, Stop: 124.60
Position: - Short at 124.00
Target: - 122.20
Stop: - 124.60
New strategy :
Hold short entered at 124.00, Target: 122.20, Stop: 124.60
Position: - Short at 124.00
Target: - 122.20
Stop:- 124.60
Although the single currency has rebounded after finding support at 122.98 and marginal gain from here cannot be ruled out, as long as resistance at 124.55 (yesterday’s high) holds, further consolidation would take place and mild downside bias remains for another retreat, below support at 122.92-98 would suggest a temporary top is possibly formed, bring further fall to 122.60 but break of 122.00-10 is needed to add credence to this view, bring retracement of recent upmove to 11.50 first.
In view of this, we are holding on to our short position entered at 124.00. Above said resistance at 124.55 would abort and signal recent upmove is still in progress and may extend further gain towards 125.00 level but loss of upward momentum should prevent sharp move beyond 125.40-50, risk from there is seen for another retreat later.
Our latest preferred count is that wave (ii) is ABC-X-ABC which ended at 123.33 and wave (iii) is unfolding with wave iii ended at 100.77, followed by wave iv at 111.57 and wave v as well as the wave (iii) has ended at 97.04, followed by wave (iv) at 111.43 and wave (v) has ended at 94.12 which is also the end of the larger degree v, this also implied the major wave (C) has also ended there, hence major correction has commenced from there with (A) leg unfolding in its lower degree wave c which has possibly ended at 145.69. Under this count, A-B-C wave (B) has commenced with A leg ended at 136.23, wave B at 143.79 and wave C has possibly ended at 149.79.
Our larger degree count is that the decline from 139.26 is wave (C) and is sub-divided into a diagonal triangle i-ii-iii-iv-v with wave i - 105.44, wave ii- 123.33, wave iii - 97.03, wave iv - 111.43, followed by the final wave v as well as the end of wave (C) at 94.12, this also mark the bottom of larger degree wave B. Under this count, major rise in wave C has commenced as an impulsive wave with minor wave III ended at 145.69, wave V is still in progress for further gain to 150.00. Having said that, this so-called wave V could well be the first leg of larger degree 5-waver wave C and this wave C should bring at least a retest of wave A top at 169.97 (July 2008).
Trade Idea: AUD/USD – Buy at 0.7300
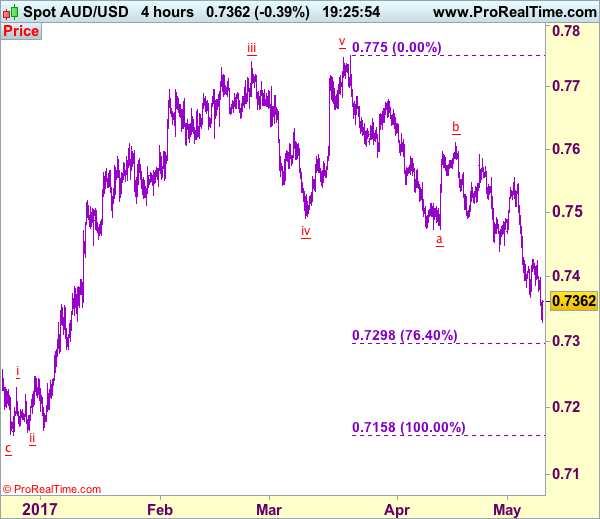
AUD/USD – 0.7354
Recent wave: Wave 5 ended at 1.1081 and major correction has commenced for fall to 0.7000 and then towards 0.6500-10
Trend: Near term down
Original strategy :
Sell at 0.7470, Target: 0.7300, Stop: 0.7530
Position: -
Target: -
Stop: -
New strategy :
Buy at 0.7300, Target: 0.7500, Stop: 0.7240
Position: -
Target: -
Stop:-
Although aussie has fallen again after brief recovery and near term downside risk remains for recent decline to extend further weakness to 0.7320, loss of downward momentum should prevent sharp fall below 0.7295-00 (76.4% retracement of 0.7158-0.7750) and bring rebound later, above 0.7425-30 would bring rebound to 0.7490-00 but break of 0.7510 is needed to signal low is formed, bring test of subsequent rise towards resistance at 0.7556 which is likely to hold from here.
In view of this, we are inclined to turn long on next decline. Below 0.7245-50 would risk weakness to 0.7200-10, however, reckon previous support 0.7158 would contain downside and aussie may stage another strong rebound from there later this week.
On the 4-hour chart, the move from 0.8066 is the wave 5 with i: 0.8860, ii: 0.8315, wave iii is an extended move ended at 1.0183, iv: 0.9706 and wave v has ended at 1.1081 (also the top of entire wave 5). The subsequent selloff is the major correction which is unfolding as ABC-X-ABC and 2nd A leg has ended at 0.8848, followed by a-b-c wave B which ended at 0.9758, hence, 2nd C wave is now in progress and indicated downside target at 0.7000 and 0.6950 had been met, so further fall to 0.6710-20 cannot be ruled out.