Sample Category Title
Sterling Steady in Data Void
Today's Highlights
- Sterling steady in data void
- Aussie Dollar weaker as retail sales drop
- No change expected from Reserve Bank of New Zealand
Current Market Overview
The Sterling-Euro exchange rate is a tad higher this morning after a lacklustre Monday. Sterling did gain half a cent or so against the Euro after The British Retail Consortium posted a strong 5.6% year-on-year gain in April's retail sales after a drop of 1.0% in March. It is unlikely the Pound will make further gains today as the data diary lacks anything UK related. Traders may twitch on rumours and speculation ahead of Thursday's Bank of England meeting, but that is about all.
For its part, the Euro is weakened by poor German industrial output figures. The data was better than expected but still showed a decline of 0.4% in March. EU data today is of a minor nature; i.e. nothing that is likely to significantly shift the Euro. Traders will be interested in tomorrow's speech by European Central Bank (ECB) President, Mario Draghi, though. His speech about monetary policy may yield hints as to when the ECB is going to be seeking rate hikes.
Overnight news from Australia showed a fall in March's retail sales. Slack wage growth and a soft labour market are being cited as the reasons for the 0.1% decline from the month earlier and the fact that retail sales only gained 0.1% in the first quarter of the year. The Reserve Bank of Australia is caught between these poor stats and fears over regional variations in house price rises. As such, no change is expected in Aussie interest rates any time soon. The Aussie Dollar weakened against the Pound for the sixth day in a row.
Overnight tonight we get the interest rate decision from the Reserve Bank of New Zealand (RBNZ) and, whilst no change is expected, we will be interested to see how the RBNZ sees the recent bout of NZD weakness affecting their decision making. Central banks always say they don't concentrate on the exchange rate, but of course they do. A weak NZD is very welcome for exports, but hampers their attempts to manage inflation. There will be NZ retail data released tonight, so a volatile NZD is likely overnight.
And I have to dash now, because I am off to buy some Nordstrom jeans. They are SO 'this year'. They come with actual caked on mud and grime and they're only $425 a pair. They are a must have for the budding Z list celebrity with gullible tattooed on their botoxed foreheads.
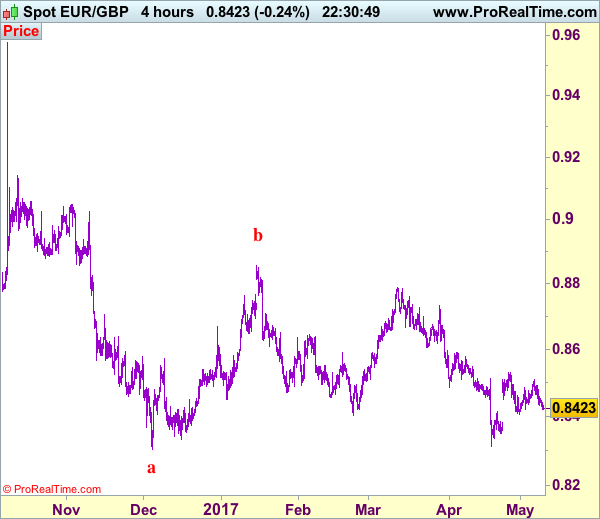
Trade Idea: EUR/GBP – Stand aside
EUR/GBP - 0.8423
Recent wave: Major double three (A)-(B)-(C)-(X)-(A)-(B)-(C) is unfolding and 2nd (A) has possibly ended at 0.6936.
Trend: Near term down
New strategy :
Stand aside
Position : -
Target : -
Stop : -
As the single currency has retreated after meeting resistance at 0.8509 late last week, retaining our view that further consolidation would be seen but only a break of indicated support at 0.8405 would signal the rebound from 0.8312 has ended, bring further fall to 0.8370-75, however, support at 0.8351 should remain intact, bring another rebound later.
On the upside, above 0.8475-80 would bring test of said resistance at 0.8509, however, reckon upside would be limited to resistance at 0.8531 and bring retreat later. Only a break of this level would add credence to our view that a temporary low has been formed at 0.8312 and extend the rebound from there for retracement of recent decline to 0.8550, however, reckon resistance at 0.8580 would limit upside and 0.8600-10 would hold from here. As near term outlook is mixed, would be prudent to stand aside in the meantime.
Our preferred count is that, after forming a major top at 0.9805 (wave V), (A)-(B)-(C) correction is unfolding with (A) leg ended at 0.8400 (A: 0.8637, B: 0.9491 and 5-waver C ended at 0.8400. Wave (B) has ended at 0.9413 and impulsive wave (C) has either ended at 0.8067 or may extend one more fall to 0.8000 before prospect of another rally. Current breach of indicated resistance at 0.9043 confirms our view that the (C) leg has ended and bring stronger rebound towards 0.9150/54, then towards 0.9240/50.
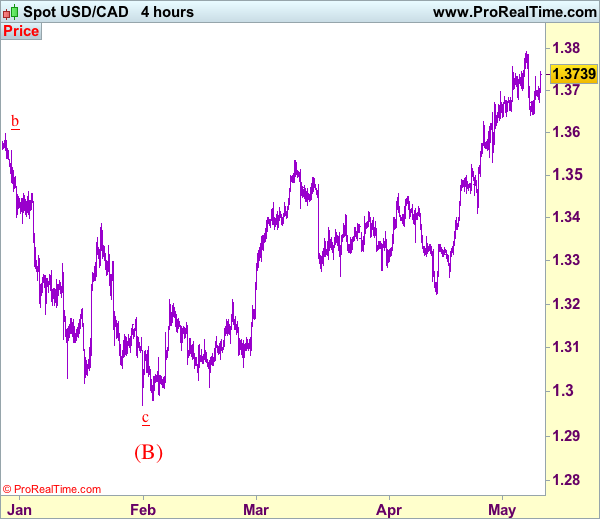
Trade Idea: USD/CAD – Buy at 1.3655
USD/CAD - 1.3740
Recent wave: Only wave v of c has ended at 0.9407 and wave C of major A-B-C correction is underway for headway to 1.4700
Trend: Near term up
Original strategy :
Buy at 1.3540, Target: 1.3750, Stop: 1.3480
Position: -
Target: -
Stop: -
New strategy :
Buy at 1.3655, Target: 1.3850, Stop: 1.3595
Position: -
Target: -
Stop:-
As the greenback has rebounded again after finding support at 1.3642, suggesting bullishness remains for recent upmove to resume after consolidation, above resistance at 1.3794 would extend recent upmove to 1.3840-50 but near term overbought condition should prevent sharp move beyond 1.3890-00 and price should falter below 1.3950, risk from there is seen for a retreat to take place later.
In view of this, would not chase this rise here and would be prudent to buy again on pullback as said support at 1.3642 should limit downside and bring another rise later. Below 1.3600-10 would defer and risk correction to 1.3570 but reckon 1.3530 support would hold from here. A firm break below this level would abort and signal a temporary top is formed instead, risk correction to 1.3500 and later towards 1.3450-60 but support at 1.3411 should remain intact, bring another upmove later.
To recap, wave B from 1.3066 is unfolding as an a-b-c and is sub-divided as a: 1.2192, b: 1.2716 and wave c is a 5-waver with i: 1.1983, ii: 1.2506, extended wave iii with minor iii at 1.0206, wave iv ended at 1.0781 and wave v as well as wave iii has ended at 0.9931, hence the subsequent choppy trading is the wave iv which is unfolding as (a)-(b)-(c) with (a) leg of iv ended at 1.0854, followed by (b) leg at 1.0108 and (c) leg as well as the wave iv ended at 1.0674. The wave v is sub-divided by minor wave (i): 0.9980, (ii): 1.0374, (iii): 0.9446, (iv): 0.9913 and (v) as well as v has possibly ended at 0.9407, therefore, consolidation with upside bias is seen for major correction, indicated target at 1.3700 and 1.4000 had been met and further gain to 1.4700 would be seen later.
GBP/USD Elliott Wave Analysis
GBP/USD – 1.2932
GBP/USD – Wave 4 is unfolding as an (A)-(B)-(C) and could have ended at 1.7192
Cable has maintained a firm undertone after breaking above indicated previous resistance at 1.2775, adding credence to our view that low has indeed been formed at 1.1986 earlier and bullishness remains for the erratic rise from there to bring retracement of medium term decline, hence further gain to psychological resistance at 1.3000 and then 1.3050-55 would be seen, however, loss of near term upward momentum should prevent sharp move beyond 1.3100 and price should falter below 1.3140-50 (38.2% Fibonacci retracement of 1.5018-1.1986), risk from there has increased for a retreat later.
Our preferred count on the daily chart is that cable's rebound from 1.3500 (wave (A) trough) is unfolding as a wave (B) with A ended at 1.7043, followed by triangle wave B and wave C as well as wave (B) has possibly ended at 1.7192, below support at 1.4232 would add credence to this count, then further fall to 1.4000 level would follow but reckon downside would be limited to 1.3655 support and price should stay above previous support at 1.3500.
On the downside, whilst initial pullback to 1.2845-50 cannot be ruled out, reckon downside would be limited to 1.2757 support and previous resistance at 1.2706 would turn into support and contain downside, bring another rise later. Only below previous resistance at 1.2616 (tentatively wave i top) would abort and suggest top is possibly formed, risk weakness to 1.2550-60 but break of 1.2500 support is needed to provide confirmation.
Recommendation: Buy at 1.2760 for 1.3000 with stop below 1.2660.
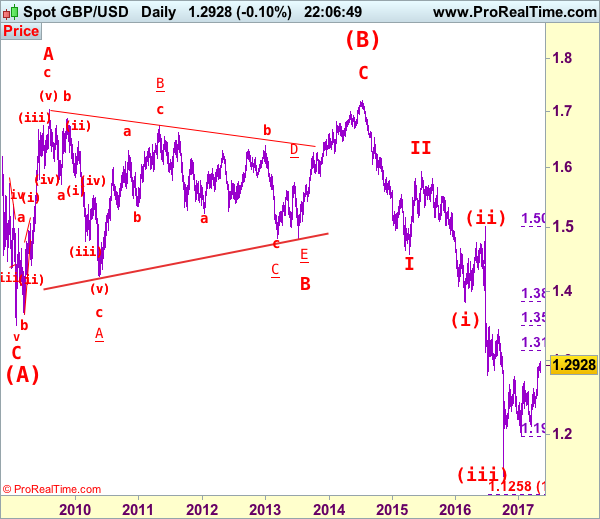
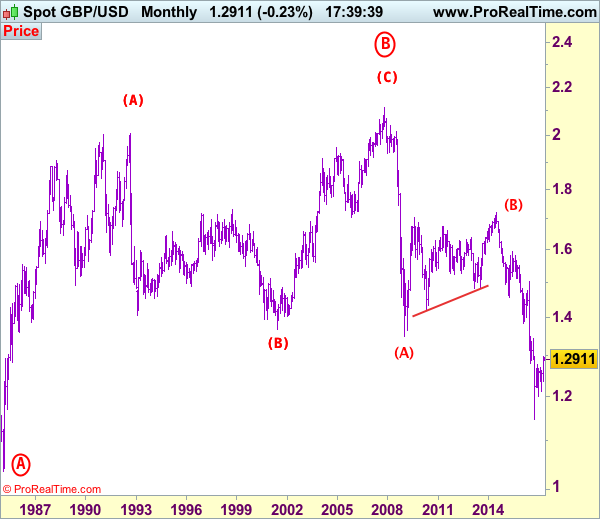
Longer term - Cable's rise from 1.0520 (Feb 1985) to 2.0100 (September 1992) is seen as [A], the decline to 1.3682 is labeled as (B) and (C) wave rally has ended at 2.1162 (9 Nov, 2007) which is also the top of larger degree wave B with circle. The selloff from there is a 5-waver with wave (A) ended at 1.3500 (23 Jan 2009), wave (B) itself is labeled as A: 1.6733, triangle wave B: 1.4813 and wave C as well as top of wave (B) ended at 1.7192 (2014), hence the selloff from there is an impulsive wave (C) with wave I : 1.4566, wave II 1.5930, an extended wave III is unfolding and already exceeded our downside target at 1.3500 and 1.3000, hence weakness to 1.2500 and possibly 1.2000 cannot be ruled out, however, price should stay well above psychological level at 1.0000.
GBP/CHF Elliott Wave Analysis
GBP/CHF – 1.2978
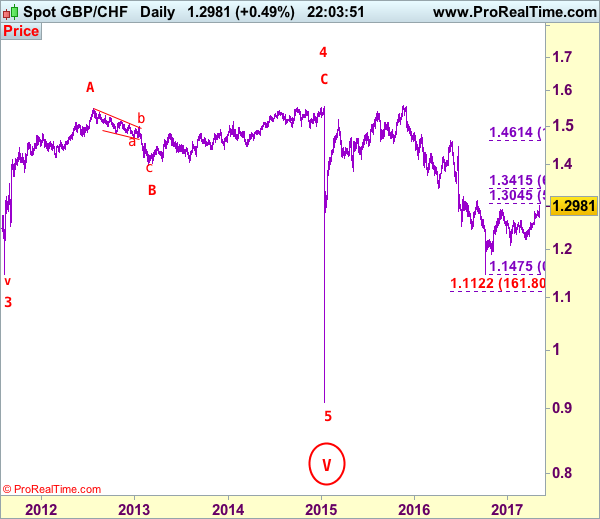
GBP/CHF – Circle wave v ended at 0.9106 and major correction has commenced for subsequent gain to 1.5547.
As sterling has surged again after brief pullback to 1.2729 late last week and price finally broke above indicated previous resistance at 1.2915, adding credence to our view that another leg of corrective upmove from 1.1475 low is underway, hence further gain to 1.3000, then 1.3045-50 (50% Fibonacci retracement of 1.4614-1.1475) and possibly towards previous chart resistance at 1.3122 would be seen, however, near term overbought condition should limit upside and reckon 1.3190-00 would hold from here.
To recap the larger degree count, the selloff from 2.4965 (July 2007) is the beginning of wave V with circle and is labeled as 1: 2.3760, 2: 2.4425, wave 3 extension ended at 1.1470, followed by wave 4 at 1.5547, the quick rebound from 0.9106 suggests wave 5 as well as entire circle wave V could have ended there, hence consolidation with mild upside bias is seen for major correction to take place, bring initial test of 1.5547 (previous 4th of a lesser degree).
On the downside, whilst initial pullback to 1.2940-50 cannot be ruled out, reckon downside would be limited to 1.2890-00 and bring another rise later. Below 1.2800-10 would defer and risk weakness towards said support at 1.2729 but only a drop below this level would signal a temporary top is formed instead, bring correction of recent upmove to 1.2690-95, then towards 1.2600-10 which is likely to contain sterling’s downside.
Recommendation: Buy at 1.2895 for 1.3150 with stop below 1.2795.
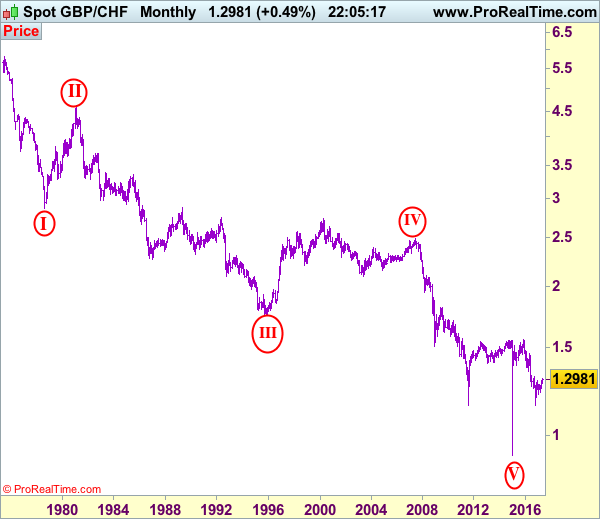
On the Monthly chart, the longer-term count is that major downtrend is under way with circle wave I at 2.8645 (Sep 1.978), then wave II with circle at 4.6175 (Feb 1981), the wave III with circle ended at 1.7425 (Nov 1995) and followed by wave IV with circle at 2.4965 (July 2007 with a short wave C) and wave V with circle has possibly ended at 0.9106. A monthly close above 1.5547 would add credence to this view, bring major correction to 1.7000, then towards psychological level at 2.0000.
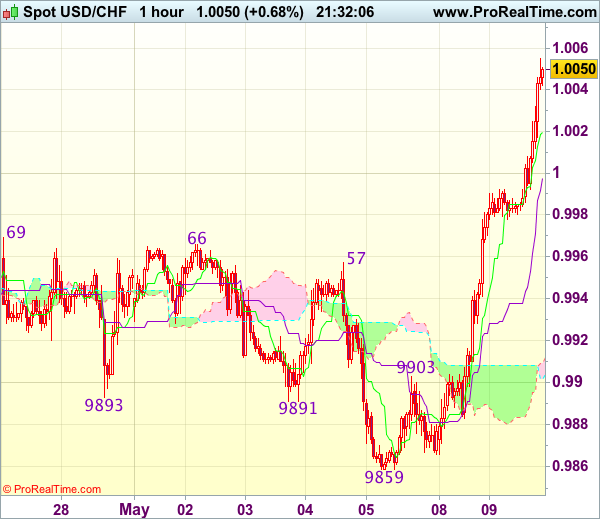
Trade Idea Update: USD/CHF – Buy at 0.9980
USD/CHF - 1.0043
Original strategy :
Buy at 0.9955, Target: 1.0055, Stop: 0.9920
Position : -
Target : -
Stop : -
New strategy :
Buy at 0.9980, Target: 1.0080, Stop: 0.9945
Position : -
Target : -
Stop : -
As the greenback has rallied yesterday and broke above indicated resistance at 0.9966-69, adding credence to our view that low has been formed at 0.9859 and suggesting recent decline from 1.0108 top has ended, hence consolidation with upside bias remains for further gain to 1.0067 resistance, however, near term overbought condition should prevent sharp move beyond previous resistance at 1.0090 and price should falter below chart point at 1.0108, bring retreat later.
In view of this, we are looking to buy dollar on dips as 0.9980 should limit downside. Below previous resistance at 0.9957 would defer and suggest top is possibly formed, bring test of 0.9920-25 but break of previous resistance at 0.9903 is needed to add credence to this view, brig further fall to 0.9880-85.
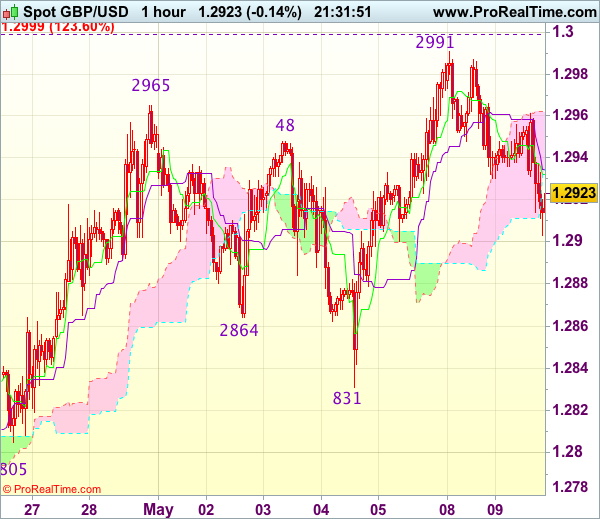
Trade Idea Update: GBP/USD – Sell at 1.2960
GBP/USD - 1.2931
Original strategy :
Sell at 1.2960, Target: 1.2860, Stop: 1.2995
Position : -
Target : -
Stop : -
New strategy :
Sell at 1.2960, Target: 1.2860, Stop: 1.2995
Position : -
Target : -
Stop : -
Although cable rose to as high as 1.2991 yesterday, the subsequent retreat suggests consolidation below this level would be seen and pullback to 1.2900-10 is likely, however, break there is needed to suggest top is possibly formed, bring further fall to 1.2875-80 but price should stay well above last week’s low at 1.2831, risk from there is seen for another rebound later.
In view of this, we are looking to turn short on recovery. Above said resistance at 1.2991 would extend recent upmove to 1.2999-00 (1.236 times projection of 1.2109-1.2616 measuring from 1.2365 and psychological resistance), then towards 1.3040-50 which is likely to hold from here due to near term overbought condition.
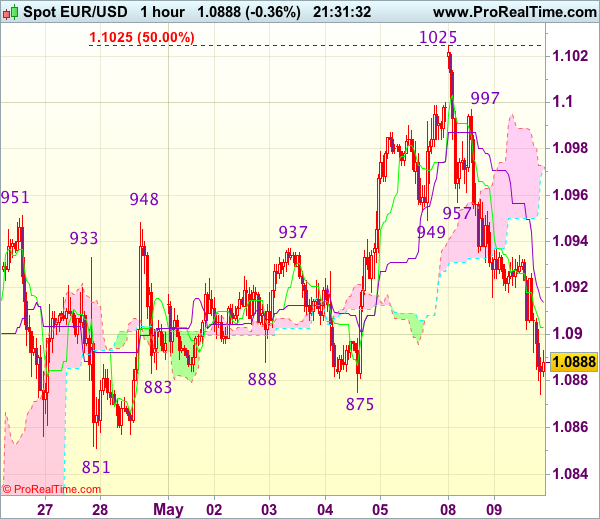
Trade Idea Update: EUR/USD – Sell at 1.0970
EUR/USD - 1.0893
Original strategy :
Sell at 1.0970, Target: 1.0870, Stop: 1.1005
Position : -
Target : -
Stop : -
New strategy :
Sell at 1.0970, Target: 1.0870, Stop: 1.1005
Position : -
Target : -
Stop : -
Euro’s selloff after yesterday’s initial brief rise to 1.1025 suggests top has been formed there and consolidation with mild downside bias is seen for further fall to 1.0875 support, however, a sustained break below there is needed to add credence to this view, bring retracement of recent rise to 1.0851 support and possibly towards 1.0825-30 but reckon 1.0800 would hold from here due to near term overbought condition.
In view of this, we are looking to sell euro on recovery as 1.0970-80 should limit upside. Above resistance at 1.0997 would bring retest of said yesterday’s high at 1.1025, however, break there is needed to signal recent upmove from 1.0340 low has resumed for headway to 1.1050 but reckon upside would be limited to 1.1065-70 (61.8% projection of 1.0602-1.0951 measuring from 1.0851).
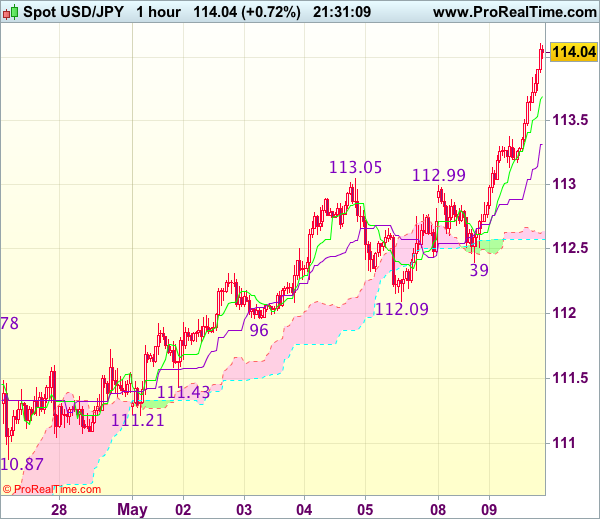
Trade Idea Update: USD/JPY – Buy at 113.35
USD/JPY - 114.09
Original strategy :
Buy at 113.10, Target: 114.10, Stop: 112.75
Position : -
Target : -
Stop : -
New strategy :
Buy at 113.35, Target: 114.45, Stop: 113.00
Position : -
Target : -
Stop : -
As dollar’s upmove has gathered momentum, suggesting recent upmove is still in progress and bullishness remains for further gain to 114.25-30 (100% projection of 110.87-113.05 measuring from 112.09) and then 114.50-55 (100% projection of 108.13-111.78 measuring from 110.87), however, near term overbought condition should limit upside to 114.75-80 and price should falter below 115.00, bring retreat later.
In view of this, would not chase this rise here and would be prudent to buy dollar on pullback as the Kijun-Sen (now at 113.31) should contain downside. Only below previous resistance at 113.05 would defer and suggest top is formed, bring correction of recent upmove to 112.70-80 but reckon support at 112.39 would remain intact.
WTI Tests Major Support Zone Ahead of OPEC Meeting
The US shale oil industry has seen a marked recovery since February last year because of higher oil prices. The US Baker Hughes data, that records the number of new Oil Rigs, is showing additional Rigs added every week. The increase in shale oil supply has offset OPEC's recent output cut effort to an extent.
However, the Saudi Arabia Oil Minister, Khalid al-Falih, stated on Monday May 8, at the Asia Oil and Gas Conference in Malaysia that "the output cut could be extended another 6 months or even further into 2018". OPEC will hold a meeting in Vienna on May 25 where the decision whether to extend the output cut agreement will likely be announced.
WTI has retraced substantially around 12.88% since April 12 as prices have reached a mid-term major resistance zone, where there is heavy selling pressure.
Notably, the downtrend was held since last Frida, as it was trading at a mid-term major support zone between $43 – $45 where there is stronger support.
On the 4-hourly chart, the price has moved from the lower Bollinger band to the middle Bollinger band, suggesting the recent bearish momentum is waning.
If a firm extension decision is made after the meeting then it will likely result in a rebound in oil prices. Conversely, if no further extension is made, it will likely result in further falling of oil prices.
The resistance is at $47.00, followed by $47.50 and $48.00.
The support line is at $46.50, followed by $46.00 and $45.50.
The US EIA Crude Oil Inventories data (for the week ending May 5) will be released at 15:30 BST on Wednesday May 10. Please be advised that this release is highly likely to cause volatility in oil prices.