Sample Category Title
Technical Outlook: US Crude Oil – Neutral Near-Term Mode While The Price Is Holding Within $45.70/$47.01 Range
Near-term price action in neutral mode, entrenched within $45.70/$47.00 range for the second day.
Recovery from strong downside rejection at $43.74 last Friday was capped by falling daily Tenkan-sen, which also limited today’s upside attempts at $46.74.
Bearish daily studies maintain downside risk, as the price failed to capitalize more on bullish signal from slow stochastic reversal from oversold territory.
Break out of current congestion is needed for stronger direction signal, with lift above $47.00barrier to open next upper pivots at $47.56/67 (Fibo 38.2% of $53.74/$43.74 descend / falling 10SMA) break of which would generate stronger bullish signal.
On the other side, loss of $45.70 handle would risk retest of spike low at $43.74 and extension towards next downside pivot at $45.32 (Fibo 61.8% of $39.20/$55.22 rally).
Fundamentals remain negative for oil price and keep downside under pressure.
Res: 46.76, 47.00, 47.67, 48.74
Sup: 46.26, 45.70, 45.28, 43.74
DAX Edges Higher On German Exports, Industrial Production Releases
The DAX has posted slight gains on Tuesday and is currently trading at 12,763.75. On the release front, German Industrial Production declined 0.4%, better than the forecast of 0.6%. German exports rose 0.4% and exports climbed 2.4 percent. However, Germany's trade surplus fell to a 3-month low, at EUR 19.6 billion. On Wednesday, ECB President Mario Draghi will speak about monetary policy at the Dutch House of Representatives.
Following the French presidential election on Sunday, it's business as usual for European stock markets. The markets had priced in a decisive Macron win, so the results of the vote didn't surprise, save for the fact that Emmanuel Macron's margin of victory for was larger than expected. Throughout the second round of the election campaign, opinion polls showed Macron with a comfortable 20-point edge, and in the end, he beat expectations, beating Marie Le Pen by a margin of 64% to 36%. Although Macron cruised to victory, it should be noted that fully one third of French voters either abstained or voted a blank ballot as a protest vote. This means that Macron was viewed by many voters as a default choice, as he was seen as more palatable than Le Pen, head of the extremist right-wing party National Front. The markets won't have much time to dwell on this election, with parliamentary elections slated for mid-June. Macron's En Marche! party is barely a year old and is unlikely to win a majority, which would mean a power-sharing setup in parliament, likely between Macron's party and the center-right. One important factor in the presidential election was that in both rounds, opinion polls were surprisingly accurate – the concern that many voters would vote Le Pen but wouldn't admit it to the pollsters did not occur. (In the US election, a sizeable numbers of Trump voters were embarrassed to admit so before the vote, thus skewing opinion polls in favor of Hillary Clinton.) Similar to the presidential election, the parliamentary election is full of uncertainty, and opinion polls during the election campaign will be important as fundamental releases and should be treated as market-movers.
What's next for the US Federal Reserve? On Friday, the US released key employment numbers for March. The data was generally positive, and this means that a June rate hike has become very likely. Nonfarm Payrolls improved to 211 thousand, easily beating the forecast of 194 thousand. The unemployment rate fell to an impressive 4.4%, compared to the estimate of 4.6%. This was the lowest rate since May 2007. Wage growth remained weak at 0.3%, but still matched the forecast. Still, with such little slack in the labor markets, we should see wage growth start to move higher. If that happens sooner rather than later, the Fed will have to reconsider a third rate hike in 2017. As things stand now, two more moves is the likely scenario. The strong job numbers have cemented a rate hike in June, as the odds of a June hike continue to rise and are currently at 87%, according to the CME Group.
Euro Edges Down As German Industrial Production Beats Estimate
The euro has edge lower in the Tuesday session, as the pair is currently trading at the 1.09 line. On the release front, German Industrial Production declined 0.4%, better than the forecast of 0.6%. Germany's trade surplus fell to a 3-month low, at EUR 19.6 billion. This was short of the estimate of EUR 21.2 billion. In the US, today's highlight is JOLTS Job Openings, which is expected to drop to 5.67 million. On Wednesday, ECB President Mario Draghi will speak about monetary policy at the Dutch House of Representatives.
German manufacturing and industrial numbers continue to beat the forecasts. Industrial production in March declined 0.4%, but this was just a blip, as industrial production in the first quarter posted a respectable gain of 0.4%. On Monday, Factory Orders came in at 1.0%, above the forecast of 0.7%. An improvement in global economic conditions has revived the demand for German exports, notably cares and machinery. Germany releases Preliminary GDP for the first quarter on Friday, with the markets predicting a gain of 0.6%. If the GDP report is stronger than expected, the euro could make a push towards the symbolic 1.10 level.
There were no real surprises in the results of the French presidential election, save for the fact that Emmanuel Macron's margin of victory for was larger than expected. The markets had priced in a decisive Macron win, so the euro has showed little response to the election results. Throughout the second round of the election campaign, opinion polls showed Macron with a comfortable 20-point edge, and in the end, he beat expectations, beating Marie Le Pen by a margin of 64% to 36%. Although Macron certainly “won big”, it should be noted that fully one third of French voters either abstained or voted a blank ballot as a protest vote. This means that Macron was viewed by many voters as a default choice, as he was seen as more palatable than Le Pen, head of the extremist right-wing party National Front. The markets won't have much time to dwell on this election, with parliamentary elections slated for mid-June. Macron's En Marche! party is barely a year old and is unlikely to win a majority, which would mean a power-sharing setup in parliament, likely between Macron's party and the center-right. One important factor in the presidential election was that in both rounds, opinion polls were surprisingly accurate – the concern that many voters would vote Le Pen but wouldn't admit it to the pollsters did not occur. (In the US election, a sizeable numbers of Trump voters were embarrassed to admit so before the vote, thus skewing opinion polls in favor of Hillary Clinton.) Similar to the presidential election, the parliamentary election is full of uncertainty, and opinion polls during the election campaign will be important as fundamental releases and should be treated as market-movers.
On Friday, the US released key employment numbers for March. The data was generally positive, and this means that a June rate hike has become more likely. Nonfarm Payrolls improved to 211 thousand, easily beating the forecast of 194 thousand. The unemployment rate fell to an impressive 4.4%, compared to the estimate of 4.6%. This was the lowest rate since May 2007. Wage growth remained weak at 0.3%, but still matched the forecast. Still, with such little slack in the labor markets, we should see wage growth start to move higher. If that happens sooner rather than later, the Fed will have to reconsider a third rate hike in 2017. As things stand now, two more moves is the likely scenario. The strong job numbers have cemented a rate hike in June, as the odds of a June hike continue to rise and are currently at 87%, according to the CME Group.
Technical Outlook: Spot Gold – Extended Consolidation Is Expected To Precede Fresh Downside
Spot Gold is trading with narrow range on Tuesday, failing to capitalize from reversal signal on Monday's inverted Hammer candle.
Near-term price action is consolidating above fresh seven-week low at $1220, where rising 100SMA offered temporary support after the price failed to sustain break below another strong support – daily cloud base at $1222.
Firmly bearish studies favor further downside following repeated close below $1229 (Fibo 38.2% of $1122/$1295 rally) with final break below $1220 handle to open way towards $1210 (weekly cloud base / 50% retracement of $1122/$1295).
Consolidation phase is expected to remain capped by daily cloud top ($1236) to keep focus at the downside.
Conversely, firm break above daily cloud would be seen as initial reversal signal.
Res: 1228, 1236, 1241, 1246
Sup: 1222, 1220, 1218, 1210
GBP/USD Candlesticks and Ichimoku Analysis
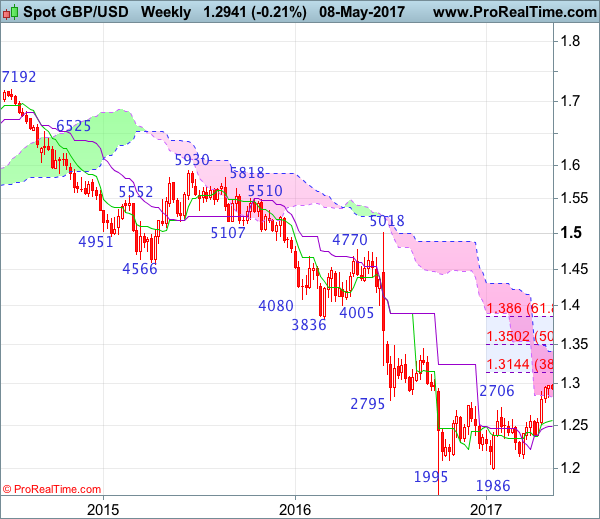
Weekly
• Last Candlesticks pattern: Long white candlestick
• Time of formation: 16 Jan 2017
• Trend bias: Down
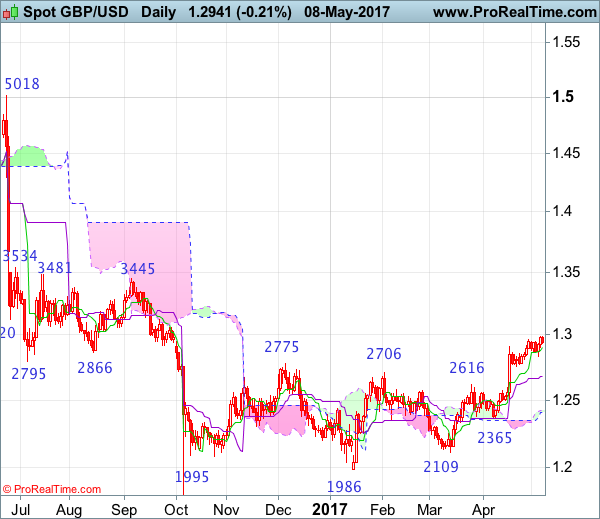
Daily
• Last Candlesticks pattern: Long white candlestick
• Time of formation: 18 Apr 2017
• Trend bias: Near term up
GBP/USD – 1.2928
As cable has maintained a firm undertone after resuming recent upmove, adding credence to our view that the rise from 1.1986 low (Jan low) is still in progress and bullishness remains for this move to bring retracement of early downtrend, hence further gain to 1.3000 psychological resistance, then 1.3050-60, however, loss of near term upward momentum should prevent sharp move beyond 1.3090-00 and reckon 1.3140-50 (38.2% Fibonacci retracement of 1.5018-1.1986) would hold on first testing, risk from there is seen for a retreat to take place later.
On the downside, whilst initial pullback to 1..2860-70 cannot be ruled out, reckon downside would be limited to 1.2800-10 would limit downside and bring another rise later. Only a daily close below support at 1.2757 would suggest top is possibly formed, bring weakness to 1.2700-10 but a daily close below the Kijun-Sen (now at 1.2678) would add credence to this view, bring correction to previous resistance at 1.2616, however, downside should be limited to 1.2575 and price should stay well above 1.2500, bring another rally later.
Recommendation: Buy at 1.2810 for 1.3010 with stop below 1.2710.
On the weekly chart, although cable’s firmness adds credence to our bullish view that the erratic rise from this year’s low at 1.1986 is still in progress and near term upside bias remains for this move to bring retracement of early decline, hence further gain to psychological resistance at 1.3000 and possibly towards 1.3090-00 would be seen, however, reckon upside would be limited to 1.3140-50 (38.2% Fibonacci retracement of 1.5018-1.1986) and price should falter well below 1.3200-10, bring retreat later.
On the downside, although initial pullback to 1.2860-70 cannot be ruled out, reckon downside would be limited to 1.2800-10 and bring another rise. Below previous resistance at 1.2706 would defer and suggest top is possibly formed, risk weakness to 1.2640-50, however, only a drop below another previous resistance at 1.2616 would add credence to this view, bring further fall to 1.2550-60 but reckon support at 1.2515 would hold, bring another rise later. Only a drop below 1.2500 would abort and signal top is formed instead, then test of the Kijun-Sen (now at 1.2489) would follow but support at 1.2365 should remain intact.
Saudi Arabia Says The November Oil Deal Can Be Extended Beyond 2017
Yesterday, Saudi Arabia's oil minister said he is confident that the November output-cut deal between major producers will be extended into the second half of the year, and possibly beyond. Indeed, recent comments from many OPEC and non-OPEC officials suggest there is an unofficial consensus that the accord is likely to be extended by at least 6 months at the Vienna meeting, scheduled on the 25th of May. As a result, we think that in order for oil prices to rebound notably ahead of that gathering, we need to see further hints that the deal is likely to be extended for a period longer than 6 months, and/or comments that there can be deeper production cuts than previously.
Having said that though, the path of oil prices over the next days will also depend on the updated US inventory data, due out every Wednesday. Recent data have suggested a build in inventories amid rising US production, a factor that has weighed significantly on prices. Further signs that US producers are coming back into the market could limit any potential gains oil may record on speculation that the cut agreement will indeed roll over into 2018.
WTI traded in a consolidative manner yesterday, staying between the support of 46.00 (S1) and 47.20 (R1). Although the price rebounded notably on Friday, the short-term outlook remains negative in our view. The price structure remains lower peaks and lower troughs below the downside line taken from the peak of the 20th of April. Therefore, we believe that there is high probability for the bears to take control again soon and drive the battle back below 46.00 (S1), perhaps aiming for another test near 44.00 (S2). The trigger for such a slide could be tomorrow's EIA data showing further increase in US inventories.
Aussie slides after soft retail sales data
The Australian dollar came under renewed selling interest overnight, following the release of the nation's disappointing retail sales data. The figure for March missed its forecast for a rebound and instead fell, while the data accounting for the whole Q1 – which exclude inflation – rose by less than anticipated. Coming on top of the latest plunge in iron ore prices, signs that Australia's consumer spending is easing may be another factor that keeps AUD under pressure.
AUD/USD slid overnight, breaking below the support (now turned into resistance) barrier of 0.7375 (R1). Looking at the 4-hour chart, we still see a negative short-term trend and thus, we expect the bears to remain in charge and perhaps challenge the 0.7330 (S1) support soon. A decisive dip below that level is possible to open the way for our next hurdle of 0.7285 (S2).
Today's highlights:
The economic calendar is very light today. From Germany, we get trade balance for March, while from the US, we get the NFIB small business optimism index for April and the JOLTS job openings for March. In Canada, building permits for March are due out.
As for the speakers, we have two on the agenda: Minneapolis Fed President Neel Kashkari and Dallas Fed President Robert Kaplan.
WTI
Support: 46.00 (S1), 44.00 (S2), 43.20 (S3)
Resistance: 47.20 (R1), 48.40 (R2), 49.50 (R3)
AUD/USD
Support: 0.7330 (S1), 0.7285 (S2), 0.7245 (S3)
Resistance: 0.7375 (R1), 0.7400 (R2), 0.7430 (R3)
Forex Technical Analysis: EUR/USD, USD/JPY, GBP/USD
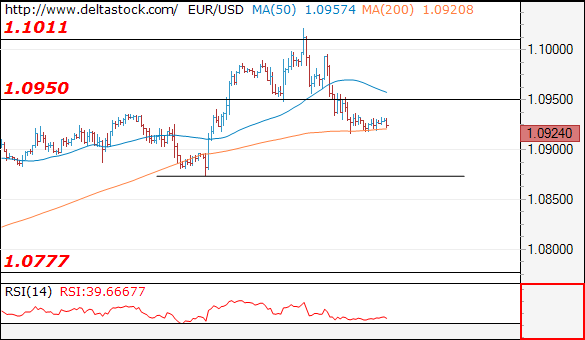
EUR/USD
Current level - 10924
The intraday bias is negative after the local peak at 1.1020, for a slide towards 1.0870 crucial area. A break through the latter will signal a continuation towards 1.0770. Key resistance lies at 1.0950.
| Resistance | Support | ||
| intraday | intraweek | intraday | intraweek |
| 1.0950 | 1.1020 | 1.0870 | 1.0780 |
| 1.1020 | 1.1150 | 1.0780 | 1.0676 |
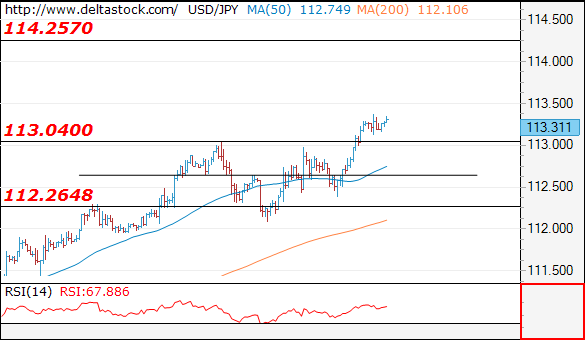
USD/JPY
Current level - 113.31
The bias is positive after 112.36 low, for a rise towards 114.25 zone, en route to 115.60 major hurdle. Initial intraday support lies at 113.00.
| Resistance | Support | ||
| intraday | intraweek | intraday | intraweek |
| 114.25 | 113.50 | 113.00 | 109.40 |
| 115.60 | 115.60 | 112.35 | 108.12 |
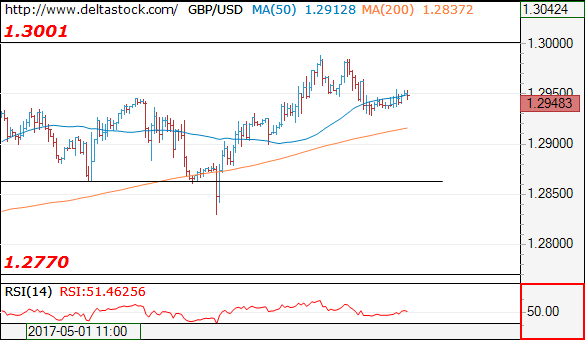
GBP/USD
Current level - 1.2948
My outlook here is rather neutral as the bias on the senior frames is still bullish above 1.2860 major support. Initial resistance lies around the sentiment 1.3000.
| Resistance | Support | ||
| intraday | intraweek | intraday | intraweek |
| 1.3000 | 1.3120 | 1.2860 | 1.2610 |
| 1.3000 | 1.3500 | 1.2770 | 1.2510 |
Swiss Unemployment Remains Stable
Australian dollar falls after weak retail sales
After falling 1.60% last week, the Australian dollar printed a fresh multi-month low amid disappointing retail sales.
AUD/USD reached $0.7353 on Tuesday morning as retail sales contracted -0.1%m/m in March, missing estimates of +0.3% but this was better than a downwardly revised figure of -0.2% in the previous month.
This was the icing on the cake for investors, especially after the massive debasement of iron ore prices that continues to add pressure on an already wounded mining sector. On the Dalian Commodity Exchange, September future contract slid 1.90%, falling to CNY 461 a metric ton, compared to CNY 685 in February.
Since the beginning of the year, investors have been quite enthusiastic regarding Australia’s economic outlook, especially against the backdrop of stabilisation in China. However, clouds started to gather on the horizon as investors have started to express worries regarding the huge level of indebtedness of the Chinese private sector.
All the conditions the been met for weaker growth in the first quarter. We therefore anticipate that the Aussie faces a tougher period ahead, especially as investors are still heavily positioned for further appreciation of the Aussie. The unwinding of the long speculative positions - net long non-commercial positions currently stand at almost 40% of total open interest as reported by the CFTC - can only accelerate AUD debasement.
Switzerland: Unemployment rate declines
The Swiss unemployment rate decreased to 3.3% in April - but we recall that since 2011, the unemployment rate has increased from 2.7%.
There are two major things that can be said about this. First, the Swiss economy is very resilient despite the strong franc and the jobless rate is still very low. Secondly, the trend is anyway somewhat negative, which shows that the economy is suffering from the strong franc.
After the French election, we are seeing the EURCHF back above 1.09, which is definitely taking away some more pressures from the SNB. The Swiss institution is certainly very happy, at least in the short-term, to see European political uncertainties moving away. In a few weeks the French parliamentary election will be held but we do not see opposition parties gaining the advantage at this stage.
The next SNB meeting will be held in June and we do not see any change in the market conditions. Rates are not going to be hiked or lowered and will likely stay at -0.75%. Swiss Monetary Policy is going to remain loose for some more time!
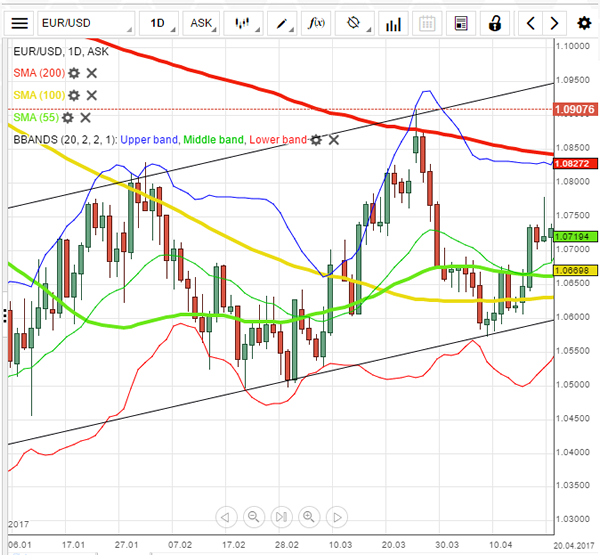
EUR/USD Analysis: Near 1.09 Mark
'The euro is a sell on rallies above 1.10 against the dollar as the ECB's senior leadership under Draghi and Praet remain cautious about the outlook for euro-zone inflation.' – Mansoor Mohiuddin, NatWest Markets (based on Bloomberg)
Pair's Outlook
On Tuesday morning the common European currency continued to depreciate against the US Dollar, as the currency exchange rate passed the support of the weekly S1, which is located at the 1.0916 level. From a technical perspective on the daily chart the currency exchange rate is likely to retreat down to the 1.0833 level, where the closest support cluster begins. However, on smaller timeframes the situation is different, as there are various short term support levels, which could slow down the fall of the Euro or even induce a rebound.
Traders' Sentiment
SWFX traders remain bearish, as 61% of open positions are short. Meanwhile, 54% of trader set up orders are to sell the Euro.
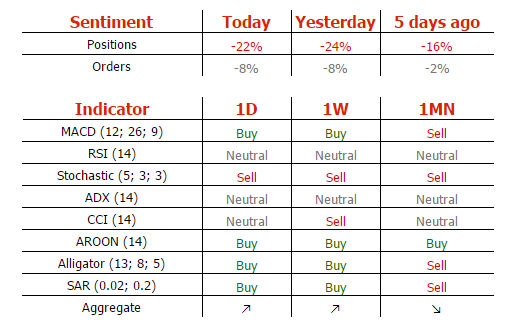
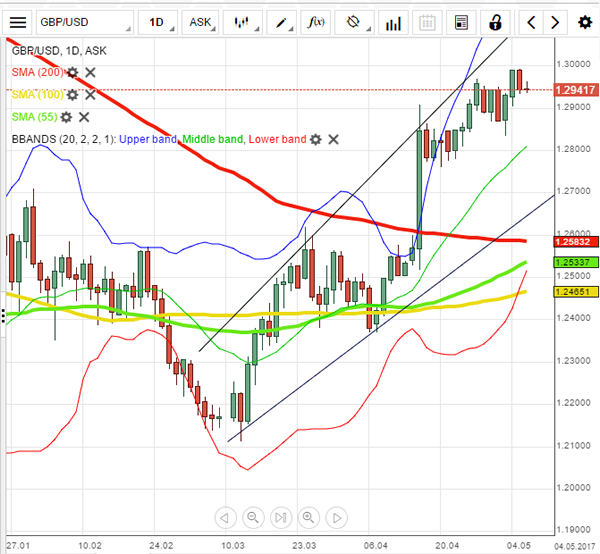
GBP/USD Analysis: Hovers Above The Weekly Pivot Point
'GBP-USD has seen a significant short squeeze from the March lows near 1.21. We expect further marginal upside into the 8 June UK general election and raised our forecast to 1.30 for Q2-2017 (from 1.18 previously).' – Standard Chartered (based on FXStreet)
Pair's Outlook
On Monday, the GBP/USD currency pair behaved in accordance with expectations, having edged slightly lower, with the weekly PP limiting the intraday losses. Although the Cable should continue edging lower, the technical indicators suggest a positive outcome is possible, but with the 1.30 mark remaining unmatched. However, due to lack of potential market movers, the Sterling is also capable of trading relatively flat against the US Dollar today, with risks still skewed to the upside. Ultimately, the 1.3120 handle should be the overall ceiling and the 1.2750–the bottom, as these levels mark the borders of the broadening rising wedge pattern, where the Cable is currently traded in.
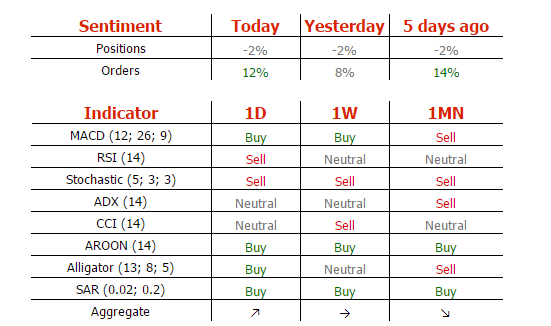
Traders' Sentiment
Traders retain a neutral outlook towards the Pound, with 51% of all open positions being short and the other 49% being long.