Sample Category Title
Gold Slide Continues
Gold continues to lose ground this week, and has lost close to 1 percent on Tuesday. In the North American session, the price for one ounce of spot gold is $1217.38, its lowest level since March 15. There are no major releases in the US on the schedule. There was more good news on the employment front, as JOLTS Jobs Openings remained unchanged at 5.74 million, above the estimate of 5.67 million.
Gold prices have dropped sharply in May, sliding 4.2 percent. The metal lost ground last week following the Federal Reserve rate statement, which was more hawkish than expected. Although the US economy had some hiccups in the first quarter, Fed policymakers chose to focus on the positive, and this immediately increased the likelihood of a June rate hike. This triggered a negative reaction from gold, which trades inversely to interest rate moves. The odds of a June hike have moved even higher this week, following strong US employment numbers in April. Nonfarm Payrolls improved to 211 thousand, easily beating the forecast of 194 thousand. The unemployment rate fell to an impressive 4.4%, compared to the estimate of 4.6%. This was the lowest rate since May 2007. Wage growth remained weak at 0.3%, but still matched the forecast. Still, with such little slack in the labor markets, we should see wage growth start to move higher. If that happens sooner rather than later, the Fed could raise rates three more times in 2017. As things stand now, two more moves is the likely scenario. Currently, the likelihood of a rate hike stands at 87%, according to the CME Group, and that figure could continue to rise.
Election campaigns often lead to volatility in gold prices, due to market uncertainty about the outcome. However, that was not the case in the French presidential election, as there were no real surprises in the outcome, save for the fact that Emmanuel Macron's margin of victory for was larger than expected. Throughout the second round of the election campaign, opinion polls showed Macron with a comfortable 20-point edge, and in the end, he beat expectations, beating Marie Le Pen by a margin of 64% to 36%. Although Macron certainly "won big", it should be noted that fully one third of French voters either abstained or voted a blank ballot as a protest vote. This means that Macron was viewed by many voters as a default choice, as he was seen as more palatable than Le Pen, head of the extremist right-wing party National Front. The markets won't have much time to dwell on this election, with parliamentary elections slated for mid-June. Macron's En Marche! party is barely a year old and is unlikely to win a majority, which would mean a power-sharing setup in parliament, likely between Macron's party and the center-right. One important factor in the presidential election was that in both rounds, opinion polls were surprisingly accurate – the concern that many voters would vote Le Pen but wouldn't admit it to the pollsters did not occur. (In the US election, a sizeable numbers of Trump voters were embarrassed to admit so before the vote, thus skewing opinion polls in favor of Hillary Clinton.) Similar to the presidential election, opinion polls during the election campaign will be important as fundamental releases and should be treated as market-movers.
Pound Shrugs Off Strong UK Retail Sales Report
GBP/USD is unchanged in the Tuesday session. In North American trade, GBP/USD is trading at 1.2940. On the release front, British BRC Retail Sales Monitor impressed with a gain of 5.6 percent. Over in the US, there was another strong employment report, as JOLTS Jobs Openings remained unchanged at 5.74 million, above the estimate of 5.67 million.
There was good news on the consumer spending front in the UK, as retail sales in BRC stores jumped 5.6% compared to a year ago. The sharp increase underscores that consumer spending remains resilient, but there are growing concerns that this trend will change in 2017. Analysts point to two major areas of concern. First, the weak British pound means that consumer purchasing power has decreased, since imported goods have become more expensive. Second, the triggering of Article 50 and the upcoming negotiations with the EU over Brexit is causing uncertainty about the economy and jobs, and this means that consumers will be holding back on buying major items. If consumer spending, a key driver of economic growth, weakens, the pound could follow suit and lose ground.
With the US posting strong employment numbers in April, it's a good bet that the Federal Reserve will raise rates at the June policy meeting. Nonfarm Payrolls improved to 211 thousand, easily beating the forecast of 194 thousand. The unemployment rate fell to an impressive 4.4%, compared to the estimate of 4.6%. This was the lowest rate since May 2007. Wage growth remained weak at 0.3%, but still matched the forecast. Still, with such little slack in the labor markets, we should see wage growth start to move higher. If that happens sooner rather than later, the Fed could raise rates three more times in 2017. As things stand now, two more moves is the likely scenario. The strong job numbers have cemented a rate hike in June, as the odds of a June hike continue to rise and are currently at 87%, according to the CME Group.
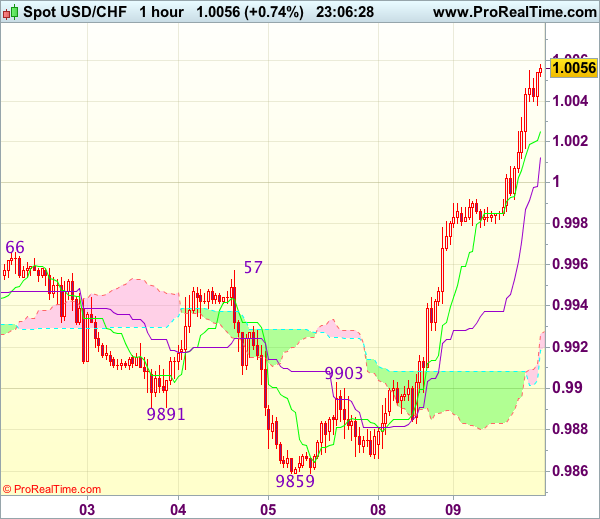
Trade Idea Wrap-up: USD/CHF – Buy at 0.9980
USD/CHF - 1.0060
Most recent candlesticks pattern : N/A
Trend : Near term up
Tenkan-Sen level : 1.0028
Kijun-Sen level : 1.0015
Ichimoku cloud top : 0.9926
Ichimoku cloud bottom : 0.9919
Original strategy :
Buy at 0.9980, Target: 1.0080, Stop: 0.9945
Position : -
Target : -
Stop : -
New strategy :
Buy at 0.9980, Target: 1.0080, Stop: 0.9945
Position : -
Target : -
Stop : -
As the greenback has rallied yesterday and broke above indicated resistance at 0.9966-69, adding credence to our view that low has been formed at 0.9859 and suggesting recent decline from 1.0108 top has ended, hence consolidation with upside bias remains for further gain to 1.0067 resistance, however, near term overbought condition should prevent sharp move beyond previous resistance at 1.0090 and price should falter below chart point at 1.0108, bring retreat later.
In view of this, would not chase this rise here and we are looking to buy dollar on dips as 0.9980 should limit downside. Below previous resistance at 0.9957 would defer and suggest top is possibly formed, bring test of 0.9920-25 but break of previous resistance at 0.9903 is needed to add credence to this view, brig further fall to 0.9880-85.
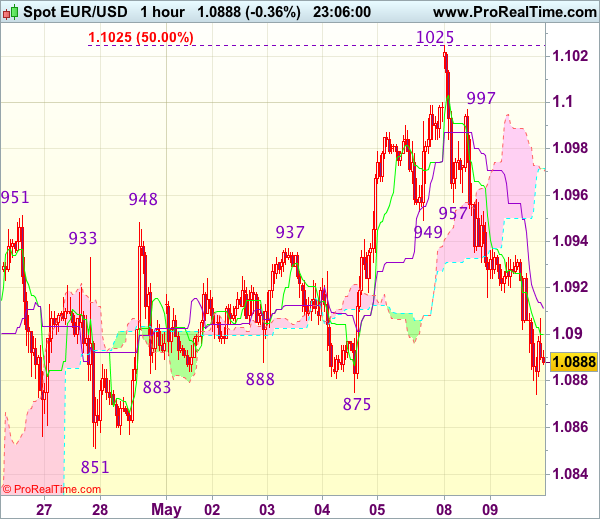
Trade Idea Wrap-up: EUR/USD – Sell at 1.0970
EUR/USD - 1.0890
Most recent candlesticks pattern : N/A
Trend : Near term up
Tenkan-Sen level : 1.0900
Kijun-Sen level : 1.0911
Ichimoku cloud top : 1.0972
Ichimoku cloud bottom : 1.0971
Original strategy :
Sell at 1.0970, Target: 1.0870, Stop: 1.1005
Position : -
Target : -
Stop : -
New strategy :
Sell at 1.0970, Target: 1.0870, Stop: 1.1005
Position : -
Target : -
Stop : -
Euro’s selloff after yesterday’s initial brief rise to 1.1025 suggests top has been formed there and consolidation with mild downside bias is seen for further fall to 1.0870-75 support, however, a sustained break below there is needed to add credence to this view, bring retracement of recent rise to 1.0851 support and possibly towards 1.0825-30 but reckon 1.0800 would hold from here due to near term overbought condition.
In view of this, we are looking to sell euro on recovery as 1.0970-80 should limit upside. Above resistance at 1.0997 would bring retest of said yesterday’s high at 1.1025, however, break there is needed to signal recent upmove from 1.0340 low has resumed for headway to 1.1050 but reckon upside would be limited to 1.1065-70 (61.8% projection of 1.0602-1.0951 measuring from 1.0851).
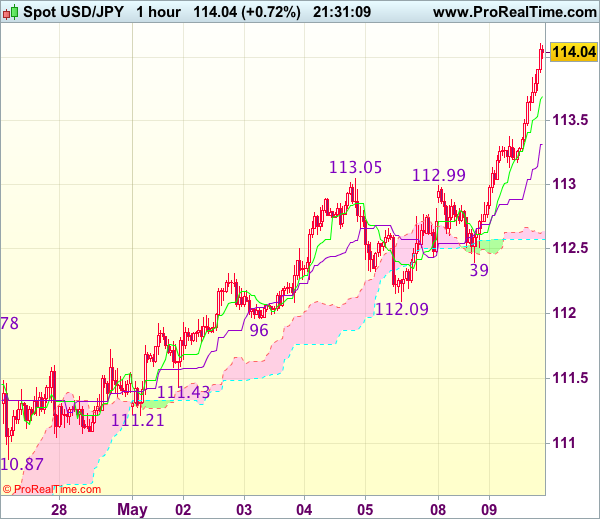
Trade Idea Wrap-up: USD/JPY – Buy at 113.35
USD/JPY - 114.09
Most recent candlesticks pattern : N/A
Trend : Near term up
Tenkan-Sen level : 113.85
Kijun-Sen level : 113.47
Ichimoku cloud top : 112.65
Ichimoku cloud bottom : 112.57
Original strategy :
Buy at 113.35, Target: 114.45, Stop: 113.00
Position : -
Target : -
Stop : -
New strategy :
Buy at 113.35, Target: 114.45, Stop: 113.00
Position : -
Target : -
Stop : -
As dollar’s upmove has gathered momentum, suggesting recent upmove is still in progress and bullishness remains for further gain to 114.25-30 (100% projection of 110.87-113.05 measuring from 112.09) and then 114.50-55 (100% projection of 108.13-111.78 measuring from 110.87), however, near term overbought condition should limit upside to 114.75-80 and price should falter below 115.00, bring retreat later.
In view of this, would not chase this rise here and would be prudent to buy dollar on pullback as the Kijun-Sen (now at 113.31) should contain downside. Only below previous resistance at 113.05 would defer and suggest top is formed, bring correction of recent upmove to 112.70-80 but reckon support at 112.39 would remain intact.
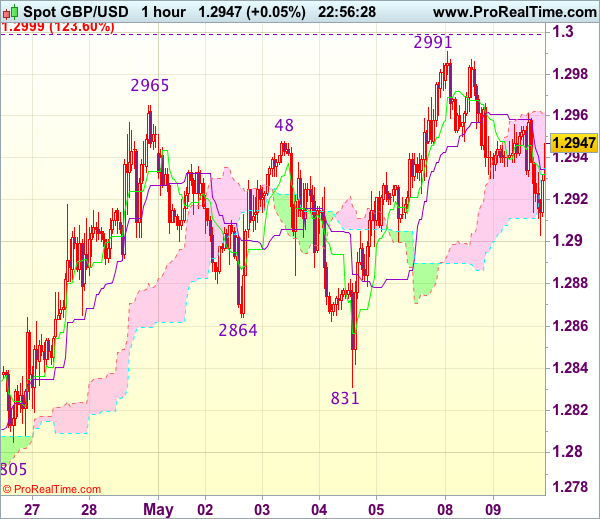
Trade Idea Wrap-up: GBP/USD – Stand aside
GBP/USD - 1.2951
Most recent candlesticks pattern : N/A
Trend : Near term up
Tenkan-Sen level : 1.2932
Kijun-Sen level : 1.2935
Ichimoku cloud top : 1.2963
Ichimoku cloud bottom : 1.2935
Original strategy :
Sell at 1.2960, Target: 1.2860, Stop: 1.2995
Position : -
Target : -
Stop : -
New strategy :
Stand aside
Position : -
Target : -
Stop : -
Despite intra-day euro-led retreat to 1.2903, as cable found good support there and has rebounded in NY morning, suggesting an intra-day low is possibly formed and consolidation with mild upside bias is seen for gain to 1.2960-65, however, break of indicated resistance at 1.2991 is needed to revive bullishness and signal recent upmove has resumed and extend gain to 1.2999-00 (1.236 times projection of 1.2109-1.2616 measuring from 1.2365 and psychological resistance), then towards 1.3040-50 which is likely to hold from here due to near term overbought condition.
In view of this, would be prudent to stand aside in the meantime. Below said support at 1.2903 would revive near term bearishness and suggest a temporary top has been formed at 1.2991, brig correction to 1.2875-80 but price should stay well above last week’s low at 1.2831, risk from there is seen for another rebound later.
From Euro Correction to USD Rebound
Headlines
European equity markets hold on to their positive momentum and gain up to 1%. US stock markets opened slightly higher as well with Nasdaq outperforming.
Manuel Valls, the former Socialist prime minister of France, will fight next month's National Assembly elections under the banner of Emmanuel Macron's centrist En Marche, as he declared his Socialist party "dead and gone".
US NFIB Small Business Optimism declined from 104.7 to 104.5 in April while consensus expected a bigger drop to 104. The indicator remains near multi-year highs.
South Korean voters were poised to elect Moon Jae-in as the country's next leader ending nine years of conservative rule and bringing to power a forceful advocate for closer ties with North Korea. The 64-yr-old former student activist, human rights lawyer, lawmaker and presidential aide thinks that South Korea needs to learn to say "no" to the US.
British PM May pledged to cap household energy prices if she is re-elected on June 8, which would be the biggest market intervention since the sector was privatised almost 30 years ago.
Rates
Outperformance Greek bonds continues
Global core bonds experienced an uneventful session. Recent trends continued with the Bund and US Note future under slight downward pressure. Investors already have key ECB and Fed meetings in June in mind, which might surprise in a hawkish manner. The eco calendar was empty apart from NFIB small business optimism which stabilised at a very high level. Stock markets gained ground while Brent crude remains stuck below $50/barrel.
At the time of writing, the German yield curve steepens with yield changes ranging between -0.3 bps (2-yr) and +3.7 bps (30-yr). Changes on the US yield curve range between +1.1 bp (30-yr) and +1.5 bps (5-yr). On intra-EMU bond markets, 10-yr yield spread changes versus Germany widened up to 2 bps with Austria (-1 bp; good auction) and Greece (-4 bps) outperforming. Greek bonds perform very well since last week's agreement between Greece and international creditors on additional structural reforms. It should pave the way for a new aid payment, debt relief talk and inclusion in the ECB's APP programme. Greek PM Tsipras said today that Greece is "closer than ever" to reaching a deal with its international lenders that will help ease its debt mountain. He added that negotiations on debt relief were ongoing and were expected to continue until the May 22 Eurogroup.
The Dutch debt agency tapped the on the run 5-yr DSL (€2.2B 0% Jan2022). The amount sold was in the lower end of the €2-3B target range, but that's often the case at Dutch auctions. The Austrian treasury auctioned the on the run 10-yr RAGB (€0.575B 0.5% Apr2027) and 30-yr RAGB (€0.425B1.5% Feb2047). The combined amount sold was the maximum targeted. The auction bid cover was good (2.06). The treasury set an additional 10% of each allotted volume aside for secondary market operations. The US Treasury starts its mid-month refinancing operation tonight with a $24B 3-yr Note auction. Currently, the WI trades around 1.56%.
Currencies
From euro correction to USD rebound
The risk rally resumed today after yesterday's pause. There were few eco data which hardly impacted trading. The safe haven currencies like the yen and the Swiss franc were sold. Contrary to what was the case of late, the dollar profited more from the risk-on sentiment and from the rise in core yields than the euro. USD/JPY revisits the 114 area. EUR/USD is drifting below 1.09. Apparently there was still some unwinding of excessive euro longs to do.
Overnight, Asian equity markets traded narrowly mixed in the absence of new eco info. EUR/USD stabilized in the 1.0930 area. USD/JPY maintained yesterday's gains and traded in the 113.30 area. The Aussie dollar was hurt by disappointing retail sales, pushing AUD/USD back sought to the 0.7355 area.
Yesterday's post-Macron profit taking on the European equity markets was short-lived. Good corporate results, solid EMU eco data (including a further rise of the German trade surplus) and the absence of high profile event risk were all good reasons for European equities to resume their uptrend. The risk-on trade weighed on safe havens like the Swiss franc (EUR/CHF 1.0940 area) and the yen (EUR/JPY> 124). Contrary to what was the case last week, the dollar this time profited more from the risk rally and from the rise in core yields than the euro. Interest rate differentials between the US and Germany didn't change much. If anything, they widened slightly in favour of the dollar. (2-y differential again at 200bps+ level). The market was still a bit too much long euro as investors raised euro long positions after the first round of the French presidential election, betting on a change in the ECB-policy guidance. There were also few data in the US. The NFIB small business confidence declined less than expected to 104.5. This remains a very high level in a historical perspective and suggests that the US recovery remains broad-based. The report is no market mover, but it also didn't hamper the case for further USD gains. EUR/USD trades currently in the 1.0885 area. USD/JPY is gaining further momentum an tries to regain the 114 big figure.
Global trends dominate sterling trading
Sterling trading was still driven by external factors rather than by UK specific issues. The Brexit quarrelling between the EU and the UK has eased a bit. This might be a slight help for sterling. EUR/GBP drifted cautiously lower in the 0.84 big figure, feeling a modest spill-over effect from the broader EUR/USD correction. The pair trades currently in the 0.8425 area. At the same time, cable is losing modest ground on the overall comeback of the dollar. However, at GBP/USD, 1.2920 sterling is holding strong. The recent top (1.2989) is still not that far away.
Dollar Climbs to 114 as Japanese Wage Growth Declines
USD/JPY has posted considerable gains in the Tuesday session. In North American trade, the pair is trading at 114.20, marking the first time that the dollar has broken above 114 yen since March 15. On the release front, Japanese wage growth declined by 0.4%, well off the forecast of a 0.4% gain. In the US, there was another strong employment report, as JOLTS Jobs Openings remained unchanged at 5.74 million, above the estimate of 5.67 million.
The dollar has pushed above the 114 line on Tuesday, as a soft Japanese wage growth report weighed on the yen. Wage growth declined 0.4% in March, marking the sharpest decline since June 2015. Prime Minister Abe's government has urged businesses to raise worker's wages, but the message has largely fallen on deaf ears, even with a tight labor market. A sluggish economy and weak consumer spending and dampened business confidence in the economy, so businesses are showing little appetite for raising wages and thus incurring more expenses.
The Japanese yen continues to lose ground, and has slipped 2.4% in the month of May. A weaker yen should result in a boost to the export sector, but on Saturday, BoJ Governor Haruhiko Kuroda said that this was not the case for Japan, since many Japanese companies were producing goods overseas. This argument may ring hollow with US president Trump and US exporters, who will likely cry foul if the yen move close to the 120 level. Early in his presidency, Trump accused Japan of manipulating the yen in order to gain a trade advantage over the US. The two sides have since agreed to let their foreign ministers handles issues related to currency matters, but flare-ups over the strength of the yen could emerge if the yen slide continues.
What's next for the US Federal Reserve? On Friday, the US released key employment numbers for March. The data was generally positive, and this means that a June rate hike has become very likely. Nonfarm Payrolls improved to 211 thousand, easily beating the forecast of 194 thousand. The unemployment rate fell to an impressive 4.4%, compared to the estimate of 4.6%. This was the lowest rate since May 2007. Wage growth remained weak at 0.3%, but still matched the forecast. Still, with such little slack in the labor markets, we should see wage growth start to move higher. If that happens sooner rather than later, the Fed will have to reconsider a third rate hike in 2017. As things stand now, two more moves is the likely scenario. The strong job numbers have cemented a rate hike in June, as the odds of a June hike continue to rise and are currently at 87%, according to the CME Group.
Sterling Steady in Data Void
Today's Highlights
- Sterling steady in data void
- Aussie Dollar weaker as retail sales drop
- No change expected from Reserve Bank of New Zealand
Current Market Overview
The Sterling-Euro exchange rate is a tad higher this morning after a lacklustre Monday. Sterling did gain half a cent or so against the Euro after The British Retail Consortium posted a strong 5.6% year-on-year gain in April's retail sales after a drop of 1.0% in March. It is unlikely the Pound will make further gains today as the data diary lacks anything UK related. Traders may twitch on rumours and speculation ahead of Thursday's Bank of England meeting, but that is about all.
For its part, the Euro is weakened by poor German industrial output figures. The data was better than expected but still showed a decline of 0.4% in March. EU data today is of a minor nature; i.e. nothing that is likely to significantly shift the Euro. Traders will be interested in tomorrow's speech by European Central Bank (ECB) President, Mario Draghi, though. His speech about monetary policy may yield hints as to when the ECB is going to be seeking rate hikes.
Overnight news from Australia showed a fall in March's retail sales. Slack wage growth and a soft labour market are being cited as the reasons for the 0.1% decline from the month earlier and the fact that retail sales only gained 0.1% in the first quarter of the year. The Reserve Bank of Australia is caught between these poor stats and fears over regional variations in house price rises. As such, no change is expected in Aussie interest rates any time soon. The Aussie Dollar weakened against the Pound for the sixth day in a row.
Overnight tonight we get the interest rate decision from the Reserve Bank of New Zealand (RBNZ) and, whilst no change is expected, we will be interested to see how the RBNZ sees the recent bout of NZD weakness affecting their decision making. Central banks always say they don't concentrate on the exchange rate, but of course they do. A weak NZD is very welcome for exports, but hampers their attempts to manage inflation. There will be NZ retail data released tonight, so a volatile NZD is likely overnight.
And I have to dash now, because I am off to buy some Nordstrom jeans. They are SO 'this year'. They come with actual caked on mud and grime and they're only $425 a pair. They are a must have for the budding Z list celebrity with gullible tattooed on their botoxed foreheads.
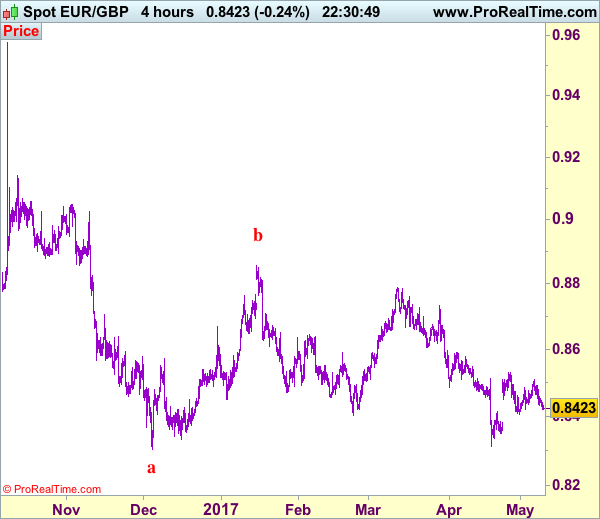
Trade Idea: EUR/GBP – Stand aside
EUR/GBP - 0.8423
Recent wave: Major double three (A)-(B)-(C)-(X)-(A)-(B)-(C) is unfolding and 2nd (A) has possibly ended at 0.6936.
Trend: Near term down
New strategy :
Stand aside
Position : -
Target : -
Stop : -
As the single currency has retreated after meeting resistance at 0.8509 late last week, retaining our view that further consolidation would be seen but only a break of indicated support at 0.8405 would signal the rebound from 0.8312 has ended, bring further fall to 0.8370-75, however, support at 0.8351 should remain intact, bring another rebound later.
On the upside, above 0.8475-80 would bring test of said resistance at 0.8509, however, reckon upside would be limited to resistance at 0.8531 and bring retreat later. Only a break of this level would add credence to our view that a temporary low has been formed at 0.8312 and extend the rebound from there for retracement of recent decline to 0.8550, however, reckon resistance at 0.8580 would limit upside and 0.8600-10 would hold from here. As near term outlook is mixed, would be prudent to stand aside in the meantime.
Our preferred count is that, after forming a major top at 0.9805 (wave V), (A)-(B)-(C) correction is unfolding with (A) leg ended at 0.8400 (A: 0.8637, B: 0.9491 and 5-waver C ended at 0.8400. Wave (B) has ended at 0.9413 and impulsive wave (C) has either ended at 0.8067 or may extend one more fall to 0.8000 before prospect of another rally. Current breach of indicated resistance at 0.9043 confirms our view that the (C) leg has ended and bring stronger rebound towards 0.9150/54, then towards 0.9240/50.