Sample Category Title
Trade Idea Wrap-up: USD/JPY – Buy at 110.60
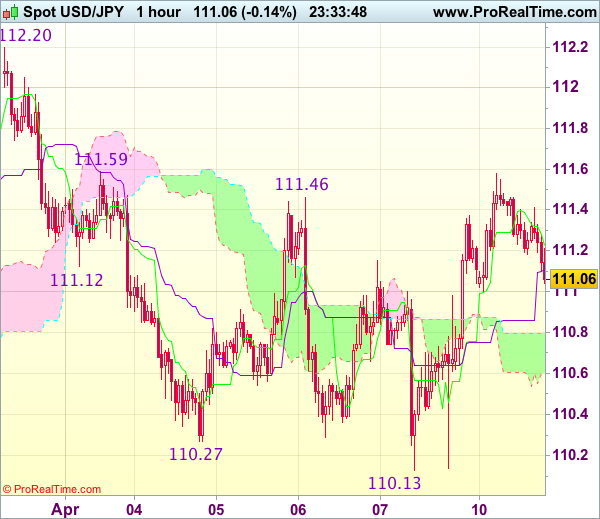
USD/JPY - 111.08
Most recent candlesticks pattern : N/A
Trend : Near term down
Tenkan-Sen level : 111.23
Kijun-Sen level : 111.11
Ichimoku cloud top : 110.80
Ichimoku cloud bottom : 110.60
Original strategy :
Buy at 110.90, Target: 111.90, Stop: 110.55
Position : -
Target : -
Stop : -
New strategy :
Buy at 110.60, Target: 111.60, Stop: 110.25
Position : -
Target : -
Stop : -
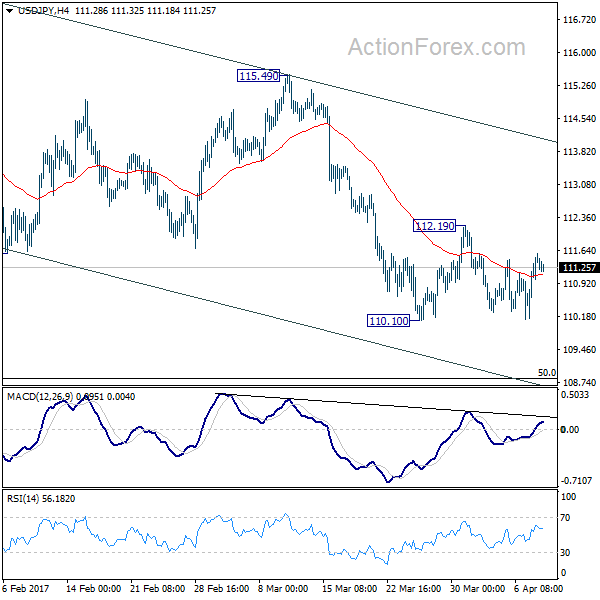
As dollar has retreated after faltering below indicated resistance at 111.59, suggesting consolidation below said resistance at 111.59 would be seen and initial downside risk is seen for test of the upper Kumo (now at 110.80), however, reckon the lower Kumo (now at 110.60) would hold and bring another rise later. A break of said resistance at 111.59 would add credence to our view that further consolidation above recent low at 110.11 would be seen and signal the fall from 112.20 has ended, then a stronger rebound to 111.90-00 would follow but said resistance at 112.20 should hold and choppy trading within 110.11-112.20 would continue.
In view of this, we are looking to buy dollar on dips but one should exit on such rebound. Below the lower Kumo (now at 110.60) would signal top is formed instead, risk weakness to 110.40 but only break of said support at 110.11-13 would confirm medium term decline has resumed for further subsequent fall to 109.80-85 (1.618 times projection of 112.20-111.12 measuring from 111.59) but price should hold above 109.50-55 (100% projection of 112.20-110.27 measuring from 111.46).
France Underperforms as Mélenchon Overtakes Fillon
Headlines
European stock markets lose slightly ground with the French CAC 40 underperforming as Mélenchon gains more ground in French presidential election polls. US stock markets shrug off Asian/European hesitance and open around 0.2% higher.
Sentix investor sentiment in the euro zone improved more than expected in April to remain at the highest level in almost 10 years, shrugging off risks linked to a closely watched presidential election in France.
Greek ministers and inspectors from the EU and the IMF will resume talks over a bailout review in Athens in late April, sources close to the negotiations said. Last week, Greece and its official lenders reached a preliminary deal on measures Athens must implement after its current bailout expires.
Czech central bank's exit from currency cap regime should be followed by increasing interest rates, Governor Rusnok said. He sees the tightening cycle start late 2017, early 2018. EUR/CZK declined further to 26.50. Czech inflation accelerated to 2.6% Y/Y in March, in line with expectations.
Brent crude rose towards $56/barrel, supported by another shutdown at Libya's largest oilfield and heightened tension over Syria following the US missile strike.
Rates
France underperforms as Mélenchon overtakes Fillon
Global core bonds initially profited from safe haven flows. The Bund outperformed the US Note future. Latest French election polls provided the bid for Bunds and caused French underperformance (stocks and bonds). Extreme-left candidate gains ground and currently polls third, overtaking Fillon with 18%. Frontrunners Macron and Le Pen still lead the bunch with around 24%. Mélenchon's rise increases the tail risk of a presidential run-off vote between extreme left and extreme right which is the worst outcome from a market point of view. Japanese finance Ministry & central bank data also showed that Japanese investors offloaded a record amount of French sovereign debt (€12.85B) in February. The up-leg of the Bund petered out around European noon amid an empty eco calendar. Brent crude continued its impressive rally. Since the end of March, the oil price rose from $50/barrel to $56/barrel. Since the start of US dealings, core bond trading remained confined to narrow ranges.
At the time of writing, the German yield curve bull steepens with yields 1 bps (2-yr) to 0.7 bps (30-yr) lower. The US yield declines by up to 1.5 bps (5-yr). On intra-EMU bond markets, 10-yr yield spread changes versus Germany vary between -9 bps (Greece) and +3 bps (France/Italy/Ireland). Greece continues to outperform following last Friday's agreement between the government and bailout monitors on additional reforms in exchange for the next aid tranche. The Italian and Irish underperformance is supply-related (auctions on Wednesday) while French bonds suffer from extreme-left candidate Mélenchon's gradual rise in the polls, overtaking Fillon in third place.
The US Treasury starts its mid-month refinancing operation later today with a $24B 3-yr Note auction. Currently, the WI trades around 1.54%.
Currencies
USD: Uneventful sideways trading
The dollar traded fairly uneventful in a news-poor Monday session. Some follow through USD/JPY buying during the Asian session and some minor French election-related risk-off spiced the sideways trading session. EUR/USD hovered between about 1.0595 and 1.0570 and trades now a shade off the 1.0590 opening level. USD/JPY made a trip to 111.60 from 111.10 in Asian trading, but gradually eased to 111.20 at the time of writing.
Overnight, USD/JPY in a follow up action after the US payrolls release on Friday made some further gains reaching an intraday high at about 111.60. However, the upward momentum faded and the pair slowly etched lower in the European morning session. Equities were under some pressure and German-French yield spreads widened as extreme-left candidate Mélenchon gains ground and currently polls third. He overtook Fillon with 18%. Frontrunners Macron and Le Pen still lead the bunch with around 24%. Mélenchon's rise increases the tail risk of a presidential run-off vote between extreme left and extreme right which is the worst outcome from a market point of view. It marginally weighed on the euro. EUR/USD slid from 1.0595 to an intraday low of 1.0570. around European noon. However, as equities stabilized order driven return action sent the EUR/USD pair back to opening levels as we close our report. US-German yield differentials didn't change and the eco calendar was nearly empty. USD/JPY hovered sideways in the afternoon session and changes hands at about 111.20, 10 ticks from opening levels.
Cable gains some ground after Friday's big losses
EUR/GBP remains prisoner in a tight 0.85 to 0.86 range. Today, sterling took the "upper hand" as the French election tail risk became a tad fatter. Far-left Mélenchon climbs higher in the polls and while he is still 7%-points behind Le Pen- Macron, it might still become more interesting. EUR/GBP very gradually slid from 0.8550 to 0.8530. Cable, which got hard hit on Friday, recouped some of its losses moving from 1.2370 to 1.2420. The move is technically irrelevant, but cable was nevertheless the top performer of the day. There wasn't really a story behind the move.
Trade Idea: EUR/GBP – Sell at 0.8620
EUR/GBP - 0.8537
Recent wave: Major double three (A)-(B)-(C)-(X)-(A)-(B)-(C) is unfolding and 2nd (A) has possibly ended at 0.6936.
Trend: Near term down
Original strategy :
Sell at 0.8620, Target: 0.8520, Stop: 0.8660
Position : -
Target : -
Stop : -
New strategy :
Sell at 0.8620, Target: 0.8520, Stop: 0.8660
Position : -
Target : -
Stop : -
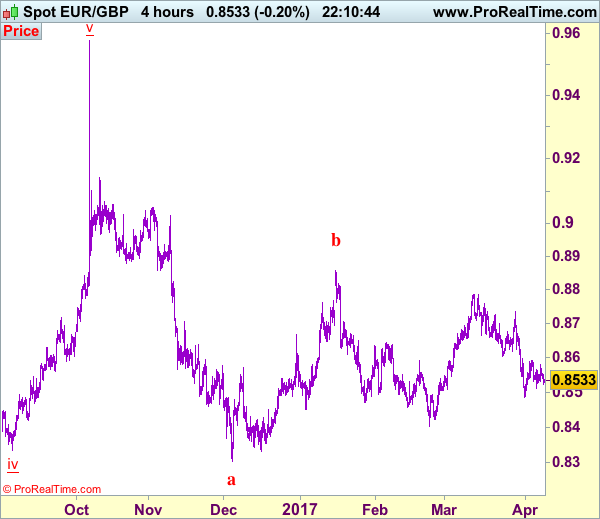
Although the single currency has retreated after meeting resistance at 0.8580 on Friday, break of 0.8500-10 is needed to retain bearishness and signal the rebound from 0.8485 has ended at 0.8592, bring retest of 0.8485, break there would add credence to our view that top has been formed at 0.8788 and bearishness remains for this fall from there to bring retracement of early upmove, hence further weakness to 0.8470 would be seen but oversold condition should prevent sharp fall below 0.8450.
If said support at 0.8500-10 continues to hold, then further choppy trading would take place and risk of another bounce to 0.8592 cannot be ruled out but upside would be limited to 0.8620-25, bring another decline later. In view of this, we are looking to sell euro on subsequent recovery as 0.8620-25 should limit upside. Only above 0.8660-65 would defer and suggest low is possibly formed, risk rebound to 0.8680, then 0.8700 but price should falter below said resistance at 0.8735, bring further choppy trading later.
Our preferred count is that, after forming a major top at 0.9805 (wave V), (A)-(B)-(C) correction is unfolding with (A) leg ended at 0.8400 (A: 0.8637, B: 0.9491 and 5-waver C ended at 0.8400. Wave (B) has ended at 0.9413 and impulsive wave (C) has either ended at 0.8067 or may extend one more fall to 0.8000 before prospect of another rally. Current breach of indicated resistance at 0.9043 confirms our view that the (C) leg has ended and bring stronger rebound towards 0.9150/54, then towards 0.9240/50.
Canadian Housing Starts Surge to Almost 10 Year-High in March
Highlights:
- Housing starts jumped to 254k in March, marking the highest 'standalone' reading since September 2007.
- Most of the monthly increase in March was accounted for by more multifamily dwelling starts, which are notoriously volatile, although single-unit starts (75k in March) were also at their highest level since November 2010.
- The increase was broadly-based on a regional basis. Starts jumped 35% in Alberta and an outsized 60% in B.C. (led by a spike in multiple-unit starts) with a strong 31% gain also posted in Quebec. Ontario rose a more modest 6%.
- On a year-over-year basis, starts were up in all regions, though led by gains in Quebec and the Prairies.
Our Take:
The surge in housing starts in March was largely concentrated in a jump in the volatile multiple-unit component that will very likely not be repeated to the same extent going forward. Single-unit starts have, nonetheless, also strengthened notably with the latest level in March (75k) marking the highest reading since mid-2010. Looking through monthly volatility, it remains the case that strength has generally been weighted to areas where housing markets have been tighter (eg. Ontario and B.C.); however, the aggregate level of starts nationally is still well-above most (including our own) estimates of the underlying pace of household formation. An earlier slowdown in the national resale market later in 2016 - in part, perhaps, related to the implementation of new macro-prudential policy measures in the fall - appears to have proven short-lived with demand picking up once again in early 2017, particularly in hotter markets in and around Toronto but also recent gains in Quebec and Alberta where sales have started to perk up once again. We expect stretched affordability conditions in some regions, a modest up-drift in lending rates, and potentially new regulatory measures, particularly in Ontario, will still eventually slow home demand this year with spillovers to new building activity; however, strong recent permit issuance (averaging 236k per month over the last three months to February) alongside strong demand in resale markets year-to-date suggests near-term building activity could continue to outperform expectations.
Elliott Wave Analysis: S&P500 Intraday View
Traders, welcome back for the US updates! We can see market mixed today, with USD turning slightly lower despite lower metals while stocks and crude oil are trading higher. In fact, we expect a resumption of an uptrend on stocks soon since S&P500 turned up in five waves from 2321 followed by recently completed expanded flat correction. Price is now trading near 2363 resistance where breakout may open door for 2378 once again.
S&P500, 1H
Trade Idea: USD/CAD – Stand aside
USD/CAD - 1.3348
Recent wave: Only wave v of c has ended at 0.9407 and wave C of major A-B-C correction is underway for headway to 1.4700
Trend: Near term up
Original strategy :
Exit long entered at 1.3375
Position: - Long at 1.3375
Target: -
Stop: -
New strategy :
Stand aside
Position: -
Target: -
Stop:-
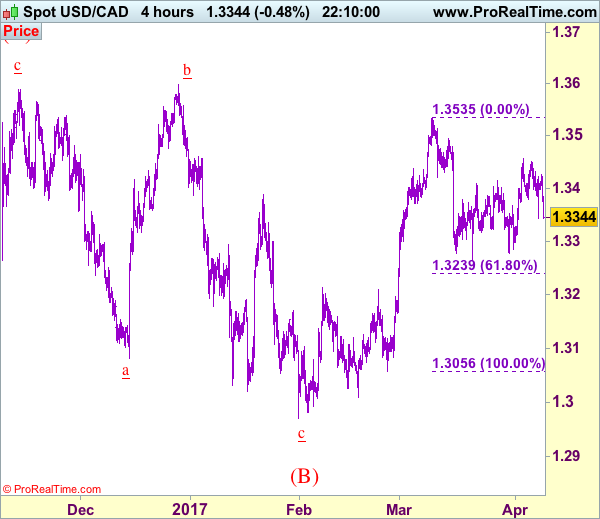
As the greenback has dropped again after meeting resistance at 1.3427, retaining our view that top has possibly been formed at 1.3456 earlier and downside risk has increased for weakness to 1.3310-20, however, break of 1.3277 support is needed to signal another leg of decline from 1.3535 top is underway for test of 1.3264, below there would add credence to this view and extend weakness to 1.3235-40 (61.8% Fibonacci retracement of 1.3056-1.3535) and then 1.3200-10.
In view of this, would be prudent to stand aside for now. Above 1.3430-35 would revive bullishness and bring retest of 1.3456 resistance, break there would add credence to our view that the correction from 1.3535 has ended and bring further gain to 1.3495-00 but break there is needed to signal upmove has resumed for retest of 1.3535, once this level is penetrated, this would extend recent recent upmove from 1.2969 to 1.3575-80 but previous chart resistance at 1.3599 should hold on first testing.
To recap, wave B from 1.3066 is unfolding as an a-b-c and is sub-divided as a: 1.2192, b: 1.2716 and wave c is a 5-waver with i: 1.1983, ii: 1.2506, extended wave iii with minor iii at 1.0206, wave iv ended at 1.0781 and wave v as well as wave iii has ended at 0.9931, hence the subsequent choppy trading is the wave iv which is unfolding as (a)-(b)-(c) with (a) leg of iv ended at 1.0854, followed by (b) leg at 1.0108 and (c) leg as well as the wave iv ended at 1.0674. The wave v is sub-divided by minor wave (i): 0.9980, (ii): 1.0374, (iii): 0.9446, (iv): 0.9913 and (v) as well as v has possibly ended at 0.9407, therefore, consolidation with upside bias is seen for major correction, indicated target at 1.3700 and 1.4000 had been met and further gain to 1.4700 would be seen later.
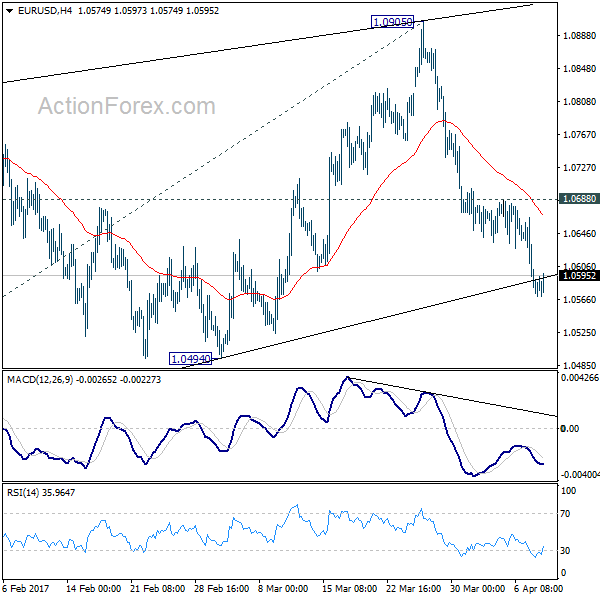
EUR/USD Mid-Day Outlook
Daily Pivots: (S1) 1.0558; (P) 1.0611 (R1) 1.0642; More....
Further decline is expected in EUR/USD for 1.0494 support. As noted before, corrective rise from 1.0339 is likely finished after being rejected by 55 week EMA. And, the larger down trend is ready to resume. Decisive break of 1.0494 support will confirm this bearish case and target 1.0339 low. Break of 1.0339 will confirm down trend resumption and target 100% projection of 1.1298 to 1.0339 from 1.0905 at 0.9946. On the upside, however, break of 1.0688 resistance will delay the bearish case and turn focus back to 1.0905 resistance instead.
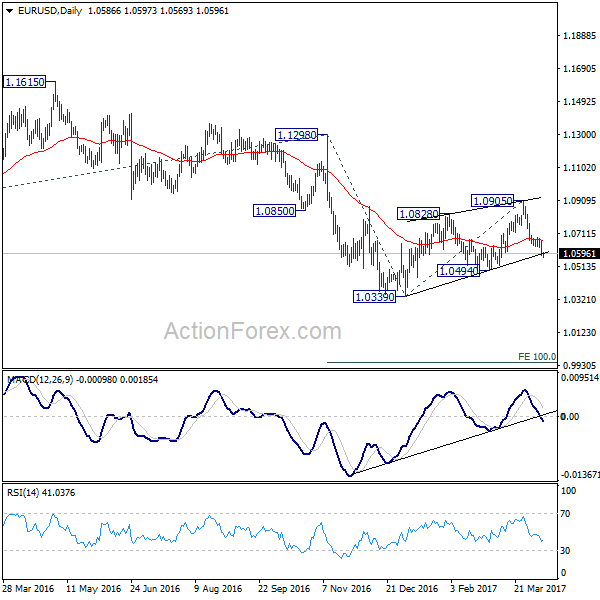
In the bigger picture, as long as 1.1298 key resistance holds, whole down trend from 1.6039 (2008 high) is still expected to continue. Break of 1.0339 low will send EUR/USD through parity to 61.8% projection of 1.3993 to 1.0461 from 1.1298 at 0.9115. However, considering bullish convergence condition in weekly MACD, break of 1.1298 will indicate term reversal. this would also be supported by sustained trading above 55 week EMA.
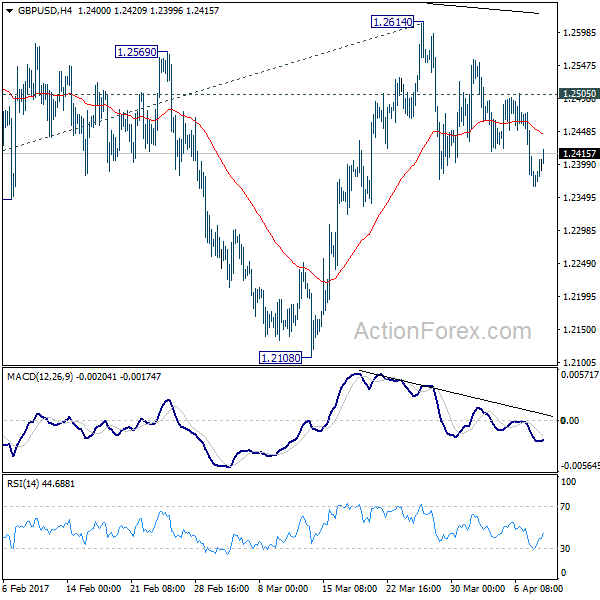
GBP/USD Mid-Day Outlook
Daily Pivots: (S1) 1.2332; (P) 1.2404; (R1) 1.2445; More...
No change in GBP/USD's outlook. Further is expected with 1.2505 minor resistance intact. Triangle pattern from 1.1946 could be finished with five waves to 1.2614 too. Deeper decline would be seen back to 1.2108 first. Decisive break there will argue that medium term down trend is resuming. In that case, GBP/USD should take out 1.1946/1986 support zone to 61.8% projection of 1.5016 to 1.1946 from 1.2614 at 1.0717. On the upside, however, break of 1.2505 resistance will invalidate this immediately bearish case. Then, it will turn bias back to the upside for 1.2614 resistance instead.
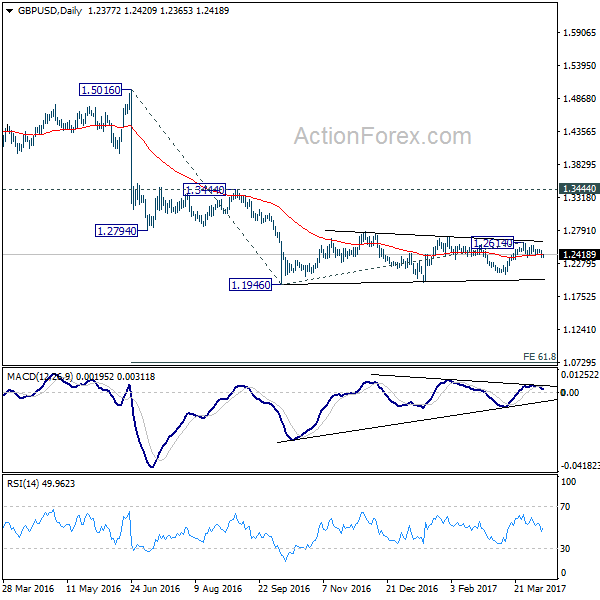
In the bigger picture, fall from 1.7190 is seen as part of the down trend from 2.1161. There is no sign of medium term reversal yet. Sustained trading below 61.8% projection of 2.1161 to 1.3503 from 1.7190 at 1.2457 will target 100% projection at 0.9532. Overall, break of 1.3444 resistance is needed to confirm medium term bottoming. Otherwise, outlook will remain bearish.
USD/JPY Mid-Day Outlook
Daily Pivots: (S1) 110.29; (P) 110.83; (R1) 111.57; More....
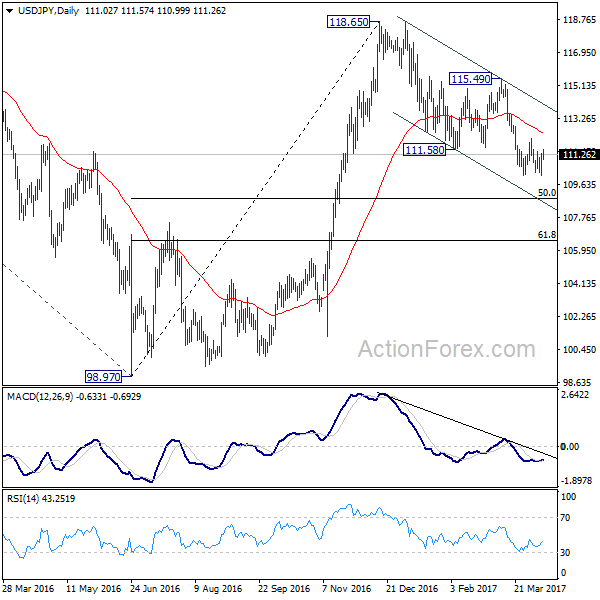
USD/JPY is bounded in range of 110.10/112.19 and intraday bias remains neutral first. The pair is staying in the near term falling channel and the correction from 118.65 could extend lower. Below 110.10 will turn intraday bias to the downside for 50% retracement of 98.97 to 118.65 at 108.81. On the upside, however, break of 112.19 resistance will indicate short term reversal and turn bias back to the upside for 115.49 resistance.
In the bigger picture, price actions from 125.85 high are seen as a corrective pattern. The impulsive structure of the rise from 98.97 suggests that the correction is completed and larger up trend is resuming. Decisive break of 125.85 will confirm and target 61.8% projection of 75.56 to 125.85 from 98.97 at 130.04 and then 135.20 long term resistance. Nonetheless, sustained trading below 55 week EMA (now at 111.15) will extend the consolidation from 125.85 with another fall through 98.97 before completion.
EUR/USD Bullish Divergence at Strong Support
The EUR/USD has formed a bullish divergence at the confluence - POC. The POC 1.0535-60 (historical buyers, M L3, W L3, W L4, bullish divergence) is at the strong support indicated by camarilla pivot points. If 1.0500 stays strong the POC could reject the price towards 1.0618, 1.0650 and 1.0700. Have in mind that these are counter trend movements and the trend is still bearish. However due to a potential reversal at POC, the pair could reject towards above mentioned levels.