Sample Category Title
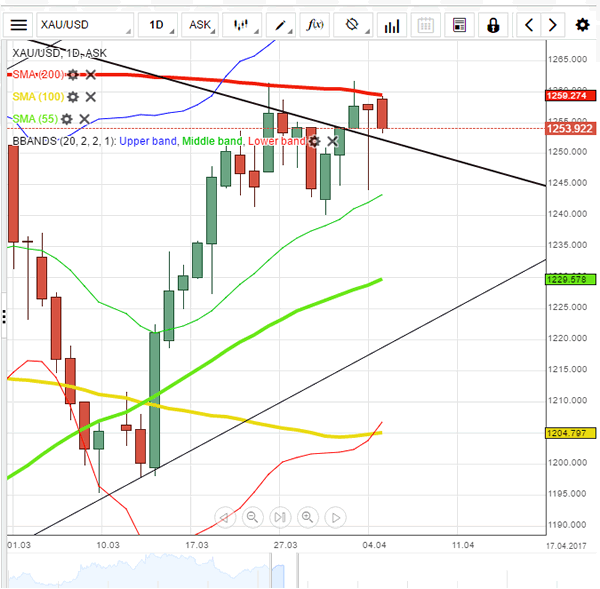
XAUUSD: Struggles Above 1,250 Mark
'It is kind of looking like gold is running out of steam in the short term.' – JJeffrey Halley, OANDA (based on Reuters)
Pair's Outlook
During the early hours of Thursday's trading session the yellow metal's price made another attempt to break higher. However, after a successful passing of the 200-day SMA the commodity price did not manage to reach the weekly R1, which is located at the 1,259.70 level. After the attempt the metal's price began a decline back below the mentioned levels of significance. It is likely that the bullion will retreat down to the support levels, which are located near the 1,250 mark. There it is most likely going to find support, as it did the same exact thing on Wednesday.
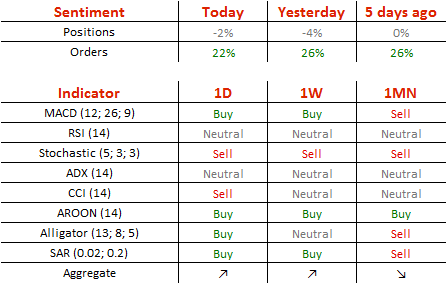
Traders' Sentiment
Traders are neutral bearish on Thursday, as 51% of open positions are short. Meanwhile, 61% of trader set up orders are to buy.
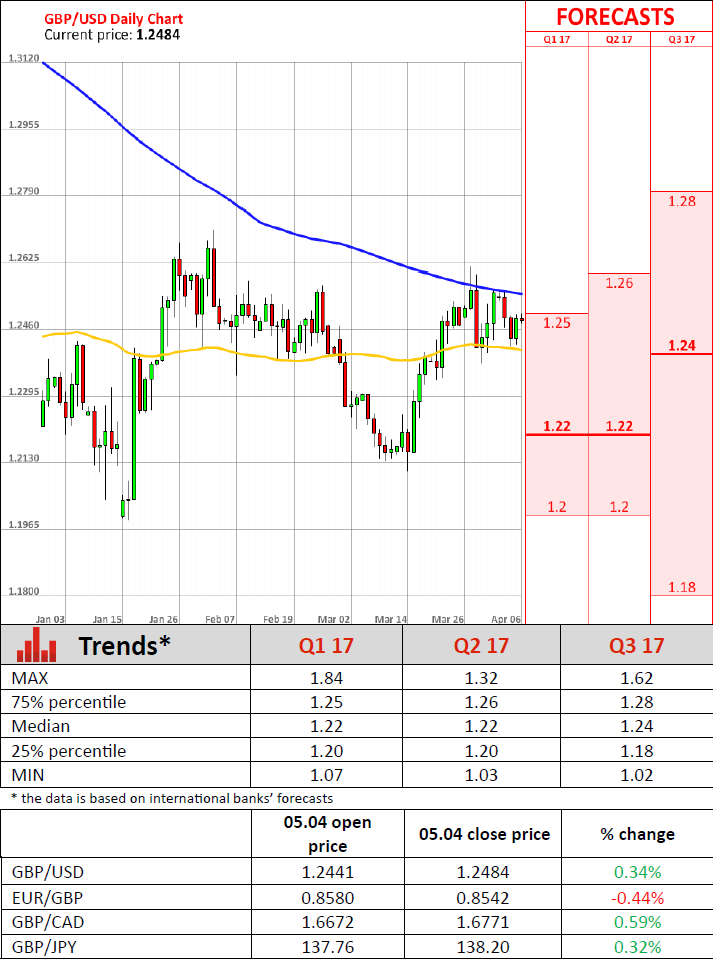
UK Services PMI Rises To Three-Month High
'The survey data indicate that UK business activity growth regained some momentum after having slipped to a five-month low in February, but the upturn fails to change the picture of an economy that slowed in the first quarter.' - Chris Williamson, IHS Markit
The PMI for the British services sector surprised many experts, who did not expect any significant change in March. According to IHS Markit, the PMI soared to 55.0 while analysts forecasted only a minor increase to 53.5. Thus, the PMI remained above the no-change value for the eighth consecutive month. This result showed that activity in the British services sector rebounded from five-month lows registered in the previous month. In March, business activity and new work creation grew at the fastest pace this year, so far. According to Markit, it was attributable to greater customers' demand and favourable economic conditions, such as the weak Pound. In fact, especially high demand on British services was recorded in the United States. The overall sentiment about business prospects among the surveyed companies remained positive. Thus, half of the respondents believed that their business activity would improve in the year-ahead. However, some companies continued to complain about the Brexit-related anxiety, which precluded investment inflows. Moreover, average prices charged by service providers increased at the highest rate since 2008, as input costs surged markedly in the recent months. In addition, experts also recorded the weakest job creation since August 2016.
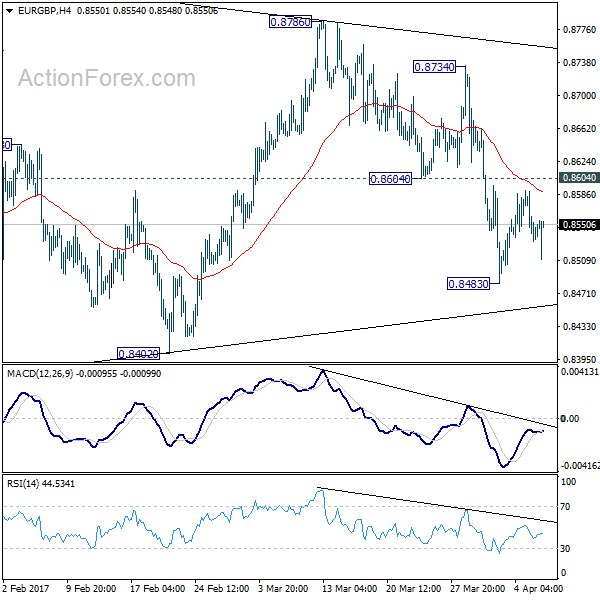
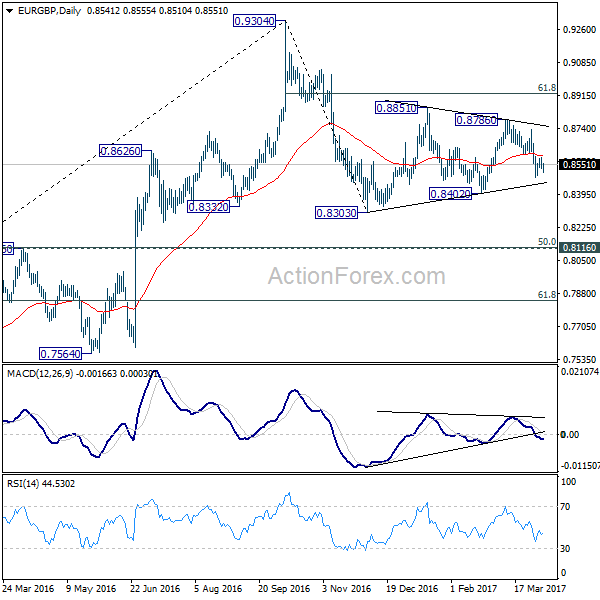
EUR/GBP Daily Outlook
Daily Pivots: (S1) 0.8517; (P) 0.8554; (R1) 0.8576; More...
EUR/GBP is staying in consolidation above 0.8483 and intraday bias stays neutral first. There is no change in the view that price actions from 0.8303 are a consolidation pattern. And, it's the second leg of the correction from 0.9304. Below 0.8430 will target 0.8402. Break of 0.8402 will resume the fall from 0.9304 to 0.8116/20 cluster support, where the correction should end. On the upside, above 0.8604 minor resistance will bring another recovery before fall from 0.9304 resumes.
In the bigger picture, price actions from 0.9304 are viewed as a medium term corrective pattern. Such decline is likely ready to resume and should make a new low below 0.8303. At this point, we'd expect strong support from 0.8116 cluster support (50% retracement of 0.6935 to 0.9304 at 0.8120) to contain downside. Break of 0.9304 will pave the way to 0.9799 (2008 high). However, sustained break of 0.8116 could bring deeper decline to next key support level at 0.7564 before the correction completes.
US ADP Reports 263,000 Job Gain In March, Services Activity Slows Last Month, Crude Oil Inventories Rise Unexpectedly
'The labour market is tight and it will get tighter. The labour shortage might be exacerbated by immigration issues.' - Mark Zandi, Moody's Analytics
US private companies created more jobs than markets expected last month, suggesting further tightening of the labour market. According to the ADP National Employment Report released on Wednesday, the US private sector added 263,000 new jobs to the economy in March, following the preceding month's downwardly revised gain of 245,000 and surpassing analysts' expectations for an increase of 184,000. The ADP data come ahead of the US Department of Labour's more comprehensive report on non-farm employment due on Friday. Yesterday's better-than-expected figures ratchet up analysts' expectations for Friday's numbers, who initially expected the NFP report to show a gain of 174,000 jobs. Other data released by the ISM on Wednesday revealed that US services activity slowed more than expected last month, with the ISM Non-Manufacturing PMI coming in at 55.2, down from the prior month's 57.6, while analysts anticipated a slight decrease to 57.0 points. In the meantime, the EIA reported US crude oil inventories climbed 1.6M barrels in the week ended March 31, missing expectations for a 0.1M barrel decrease, following the preceding week's gain of 0.9M barrels and raising concerns over the production cut agreement.
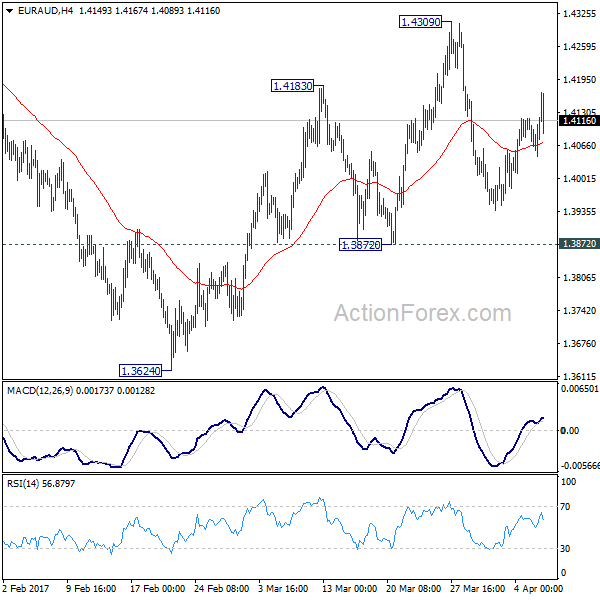
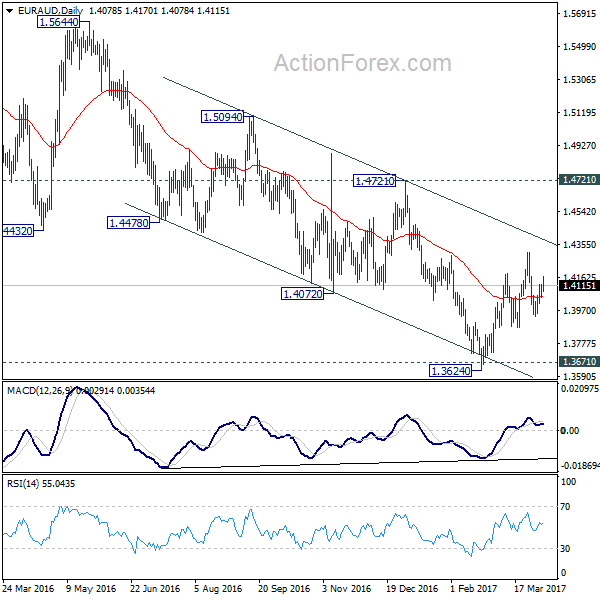
EUR/AUD Daily Outlook
Daily Pivots: (S1) 1.4049; (P) 1.4084; (R1) 1.4123; More...
EUR/AUD is staying in range of 1.3872/4309 and intraday bias remains neutral. We're holding on to the view of trend reversal after defending key support level at 1.3671. Another rise is expected as long as 1.3872 minor support holds. Break of 1.4309 will extend the rebound from 1.3624 to 1.4721 key resistance level next. Break should confirm larger trend reversal. However, firm break of 1.3872 support will dampen our bullish view. In such case, intraday bias will be turned back to the downside for 1.3624 low instead.
In the bigger picture, price actions from 1.6587 medium term top are viewed as a corrective pattern. Such correction could be completed after testing 1.3671 support. Break of 1.4721 cluster resistance (38.2% retracement of 1.6587 to 1.3624 at 1.4756) should confirm this case and target 61.8% retracement at 1.5455 and above. Overall, we'd expect the up trend from 1.1602 to resume later. However, sustained break of 1.3671 will invalidate our bullish view and would turn extend the fall from 1.6587 towards 1.1602 long term bottom.
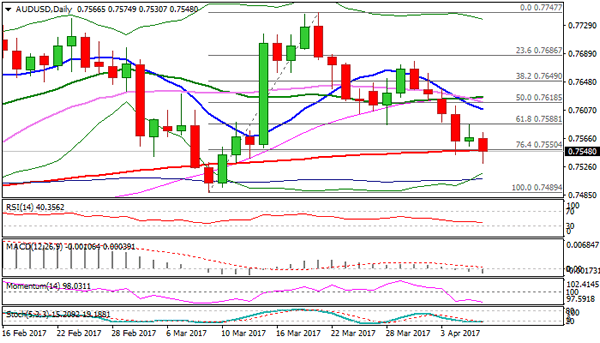
Technical Outlook: AUDUSD – Strong Bearish Signal On Probe Below 200SMA
The Aussie resumed lower after brief consolidation on Wednesday and is probing below 200SMA pivot at 0.7549 which held the action of past two days.
The pair currently riding on the wave C (from 0.7677) of five-wave cycle from 0.7747 peak that reached its 100% Fibonacci expansion at 0.7530 today.
The pair may extend weakness towards next supports at 0.7508 (100SMA) and 0.7489 (09 Mar trough) in strong bearish environment of technical studies, with close below 200SMA seen as strong bearish signal.
Extended wave C could travel to its FE138.2% at 0.7472, on break below 0.7508/0.7489 pivots.
The pair may spend some time in consolidation before resuming downtrend, as slow stochastic is oversold on daily chart.
South-moving daily Tenkan-sen (0.7604) is expected to cap extended upticks.
Res: 0.7574, 0.7585, 0.7604, 0.7618
Sup: 0.7530, 0.7508, 0.7489, 0.7472
EUR/CHF Daily Outlook
Daily Pivots: (S1) 1.0693; (P) 1.0709; (R1) 1.0731; More...
Intraday bias in EUR/CHF remains neutral for the moment. As long as 1.0734 resistance holds, deeper decline is expected in the cross. Below 1.0668 will target 1.0620/29 key support zone. Decisive break there will resume the larger fall from 1.1198. Nonetheless, break of 1.0734 will turn bias back to the upside for 1.0823 resistance instead.
In the bigger picture, the decline from 1.1198 is seen as a corrective move. Current development suggests that it's not completed yet. sustained trading below 38.2% retracement of 0.9771 to 1.1198 at 1.0653 will target 50% retracement at 1.0485. In any case, break of 1.0823 resistance is needed to be the first indication of reversal. Otherwise, deeper fall is still expected even in case of recovery.


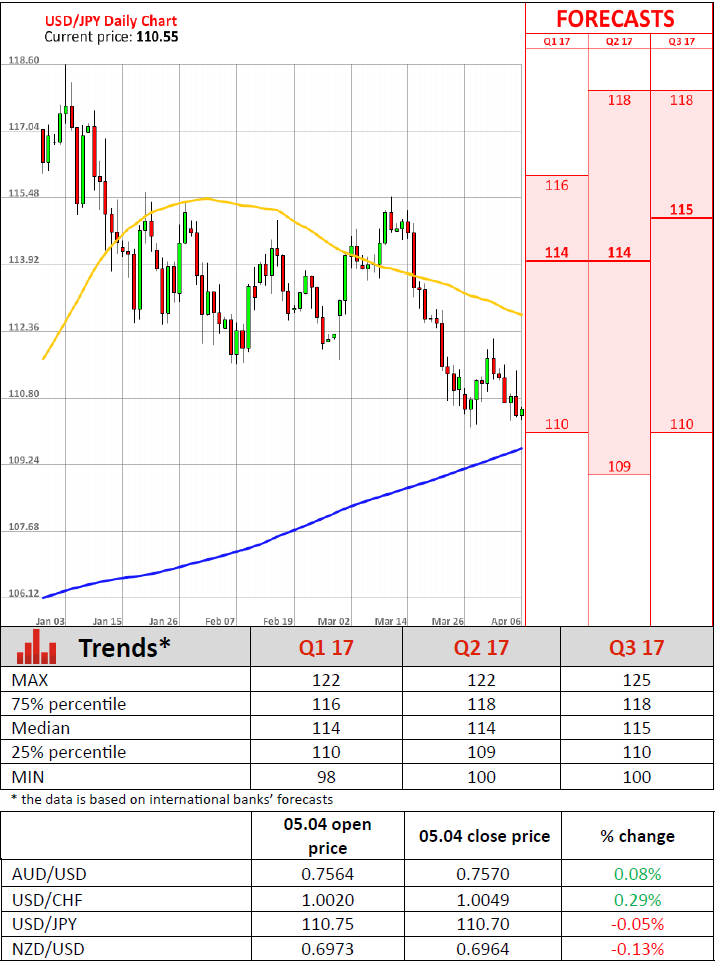
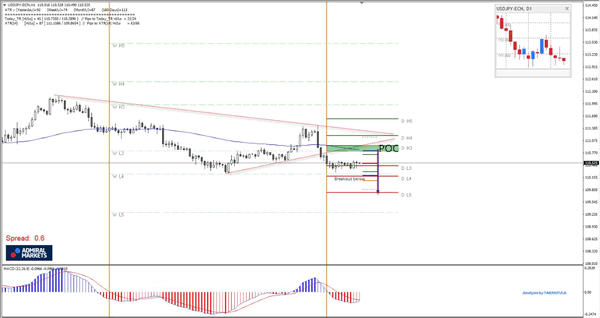
USD/JPY De-Risking Ahead Of Trump-Xi Meeting
As shown on Live Trading Session yesterday, the USD/JPY fell as expected due by overnight sell off in equities. Equities dropped due to de-risking ahead of Trump-Xi meeting, so we might see another bearish rejection on retracement. The POC 110.80-95 ( D H3, EMA89, ATR Pivot, trend line) could reject the price towards 110.18. Break below it should target 109.77 - the strongest daily support.
D H3 - Daily Camarilla Pivot (Daily Resistance)
POC - Point Of Confluence (The zone where we expect price to react - aka entry zone)
D L5 - Daily Camarilla Pivot (Strongest Daily Support)
W L4 - Weekly L3 Camarilla (Very Strong Weekly Support)
W L5 - Weekly L4 Camarilla (Strongest Weekly Support)
Markets Eye On The Trump-Xi Meeting
US President Trump and Chinese president Xi Jinping, are scheduled to meet today at Trump's Mar-a-Lago resort in Florida. This is the first meeting between the leaders of the two biggest economies in the world so markets will be looking for any comments made between these 2 world leaders.
There are some sensitive issues between the US and China, such as trade protectionism, currency manipulation, South China Sea claims and North Korea's nuclear program. President Trump stated that 'if China doesn't take actions to rein in the development of nuclear strength in North Korea then the US will act alone'.
President Xi has expressed his stance in March that the two countries should 'co-operate for mutual benefits'. Xi is now facing a big challenge to show his people that he can cope with the relationship with US well. Unlike Trump's frankness, Xi seems to be taking a more cautious stance on his comments. For both presidents, the outcome of the meeting will likely influence their prestige. Be aware that this political event will likely cause volatility for USD and outweigh the economic data performance.
The Federal Open Market Committee (FOMC) released the minutes from its mid-March meeting yesterday. The FOMC is considering shrinking its $4.5 trillion balance sheet later this year for monetary policy normalisation.
The FOMC stated that 'global economic growth has increased and global economic risks were balanced, the US economy continues to perform well and close to maximum employment and inflation has reached the Fed's target of 2% in February for the first time in five years'.
Most FOMC officials support gradual pace rate hikes. However, the fiscal stimulus is still viewed as an upside risk, therefore the FOMC will likely accelerate the pace to raise rates if they see the economy overheating. Some FOMC officials views stock prices as being too high. Per the CME's FedWatch tool; the probability of a rate hike in June has risen from 59% to 63.1% after the release of the minutes.
The dollar index hit a 3-week high of 100.95 ahead of the release of the minutes. Nevertheless, it fell around 70 points after the minutes as the pressure at the significant resistance level at 101.00 is heavy. This morning USD rallied from the support line at 100.30 hitting the intra-day high of 100.64.
US initial jobless claims (the week ending March 31) will be released at 13:30 BST, it will likely affect USD and USD crosses. FOMC non-voting member Williams will make a speech at 14:30 BST.
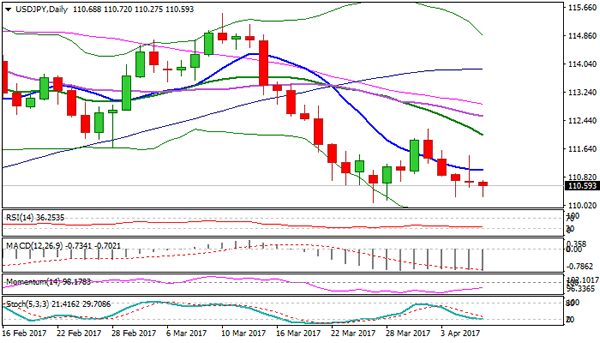
Technical Outlook: USDJPY – Key 110.00 Support Under Pressure After Strong Upside Rejection
The pair remains under strong pressure and eyes 110.00 support zone, after Wednesday's recovery attempts were capped by weekly cloud top (111.36) and subsequent strong bearish acceleration turned near-term focus lower again.
Probes above daily Tenkan-sen (111.14) were short-lived, keeping it as strong resistance, as Wednesday's daily candle with long upper shadow, heavily weighing on near-term action.
Strong bearish setup of daily studies maintains negative tone, however, hesitation ahead of pivotal 110.00 zone could be anticipated as slow stochastic is entering oversold territory.
Daily Tenkan-sen is expected to ideally cap, with Friday's close being in focus for stronger signals.
Close below weekly cloud top will be seen as strong bearish signal.
Res: 110.71, 111.02, 111.14, 111.36
Sup: 110.25, 110.09, 109.91, 109.30