Sample Category Title
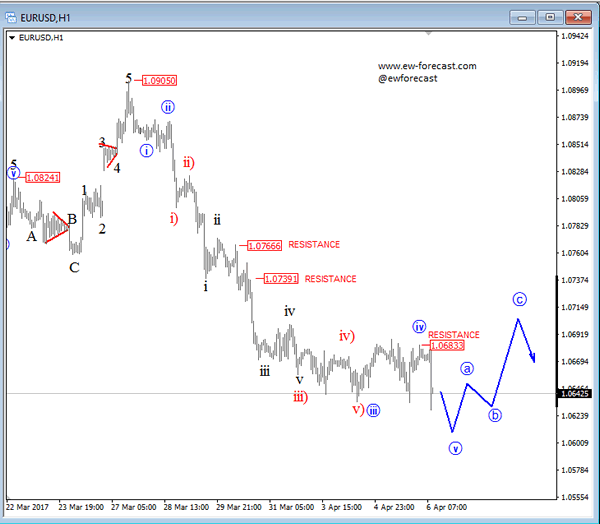
EURUSD Intraday View
EURUSD made a sharp drop in the past couple of hours, which could potentially be blue wave v, as part of an impulse. That said, wave v may find some support in the next few sessions and ideally make a three wave reversal into a-b-c. Regarding the fact, that we are looking at a wave 2 correction on higher degree time frames, the following three wave correction can potentially make a rally towards the 1.0767/1.0739 region, before again looking down.
EURUSD, 1H
ECB In Focus, FOMC Minutes Debrief
News and Events:
Fed surprises markets, further USD weakness cannot be ruled out in medium/long term
Given the lacklustre pace of recovery of the US economy, most participants expected the Fed to stick to its initial plan: gradual rate tightening. Instead, the minutes of the March FOMC meeting revealed that the members discussed extensively the strategy to start unloading the $4.5 trillion of bonds and mortgage-backed securities that currently sit on its balance. Technically, the Fed did not actually discuss selling those assets but rather changing the committee’s reinvestment policy later this year. Indeed, the central bank is currently reinvesting all principal payments from its Treasury, agency debt and agency MBS portfolios, which has the effect to maintain unchanged the size of its portfolio.
Until now, Fed members were only vaguely discussing about unwinding its bonds portfolio. In addition, the balance sheet discussions only recently started to gain traction. The market did not expect the Fed to move that fast as most analyst were expecting the Fed would start fine-tuning its reinvestment policy in the middle of 2018. This surprise move caught investors off guard and forced them to reassess the US economic outlook as well as the effect on the USD. Indeed, choosing to unload the balance sheet instead of tightening short-term rate has the advantage to limit, to some extent, USD appreciation.
On Wednesday, the Dollar erased completely its pre-FOMC minutes’ gains and ended the day flat against most of its peers. For now, the market is still digesting the minutes and its potential impact on the greenback. Investors are definitely cutting risk, pushing equities lower and the Japanese Yen higher. Overall, the backdrop of political uncertainty in the European Union favours the USD in the short-term. However, the reflation trade in the US is, more than ever, being questioned by market participants as President Trump’s administration has been unable to carry out any of its planned reforms. Therefore, further USD weakness cannot be ruled out in the medium and long-term.
ECB minutes and Alexis Tsipras meets European Council President
Today’s investors will carefully watch the ECB minutes. Indeed, at their last meeting in March, it turned out that the European Central Bank was more hawkish than expected.
However, recent declarations from policymakers are cooling down this view and the minutes should bring the confirmation that the European institution should not move far away from the purchase of €60 billion of bonds until year-end.
We do not expect a strong market movement after the release. Markets are not pricing in a too strong narrowing of the divergence between the Fed and the EU.
Staying in Europe, Alexis Tsipras is going to meet European Council President Donald Tusk ahead of the Eurogroup, composed of Eurozone Finance Ministers, which will be held tomorrow (Friday). Tsipras hopes to renegotiate the bailout terms. We recall Greece is seeing its debt-to-GDP ratio exploding since the first bailouts and that massive growth is required to only reimburse the charge of the debt.
Today's Key Issues (time in GMT):
- ECB President Draghi speaks in Frankfurt EUR / 07:00
- Mar CPI MoM, exp 0,20%, last 0,50% CHF / 07:15
- Mar CPI YoY, exp 0,50%, last 0,60% CHF / 07:15
- Mar CPI EU Harmonized MoM, exp 0,20%, last 0,60% CHF / 07:15
- Mar CPI EU Harmonized YoY, exp 0,50%, last 0,70% CHF / 07:15
- Mar Markit Germany Construction PMI, last 54,1 EUR / 07:30
- Mar Average House Prices, last 2.938m, rev 2.950m SEK / 07:30
- ECB Executive Board member Praet speaks in Frankfurt EUR / 07:30
- Mar Markit Germany Retail PMI, last 51,2 EUR / 08:10
- Mar Markit Eurozone Retail PMI, last 49,9 EUR / 08:10
- Mar Markit France Retail PMI, last 51,7 EUR / 08:10
- Mar Markit Italy Retail PMI, last 45,5 EUR / 08:10
- Apr 6 RBI Repurchase Rate, exp 6,25%, last 6,25% INR / 09:00
- Apr 6 RBI Reverse Repo Rate, exp 5,75%, last 5,75% INR / 09:00
- Apr 6 RBI Cash Reserve Ratio, exp 4,00%, last 4,00% INR / 09:00
- ECB's Weidmann Speaks in Berlin EUR / 09:40
- May FGV Inflation IGP-DI MoM, exp 0,00%, last 0,06% BRL / 11:00
- May FGV Inflation IGP-DI YoY, exp 4,78%, last 5,26% BRL / 11:00
- Mar Challenger Job Cuts YoY, last -40,00% USD / 11:30
- ECB account of the monetary policy meeting EUR / 11:30
- mars.31 Foreigners Net Bond Invest, last $399m TRY / 11:30
- mars.31 Foreigners Net Stock Invest, last -$59m TRY / 11:30
- ECB Vice President Constancio speaks in Malta EUR / 11:45
- Feb Building Permits MoM, exp 1,30%, last 5,40% CAD / 12:30
- Apr 1 Initial Jobless Claims, exp 250k, last 258k USD / 12:30
- mars.25 Continuing Claims, exp 2030k, last 2052k USD / 12:30
- mars.31 Gold and Forex Reserve, last 399.0b RUB / 13:00
- Fed's Williams Speaks on a Panel in Frankfurt USD / 13:30
- Apr 2 Bloomberg Consumer Comfort, last 49,7 USD / 13:45
- Mar Vehicle Production Anfavea, last 200385 BRL / 14:20
- Mar Vehicle Sales Anfavea, last 135665 BRL / 14:20
- Mar Vehicle Exports Anfavea, last 66268 BRL / 14:20
- ECB Executive Board member Praet speaks in Malta EUR / 16:40
- ECB Vice President Constancio speaks in Valletta, Malta EUR / 17:15
The Risk Today:
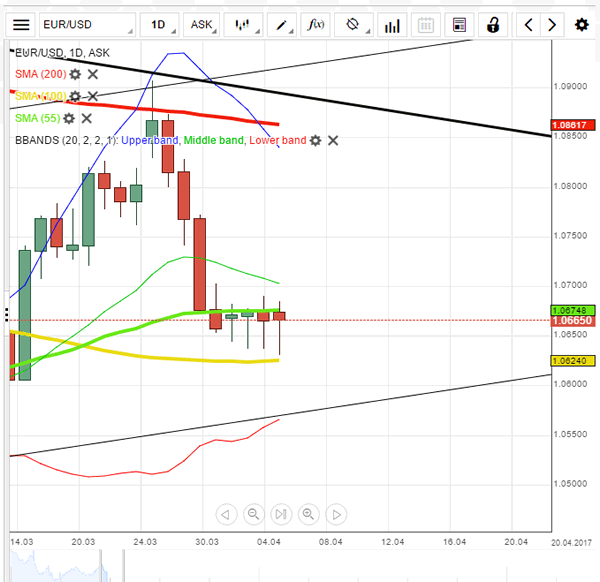
EUR/USD is now consolidating. The pair is heading lower since the pair failed to hold above former resistance given at 1.0874 (08/12/2017 high). Hourly support can be found at 1.0630 (intraday low). Stronger support can be found at 1.0494 (22/02/2017 low). Expected to see further short-term weakness. In the longer term, the death cross late October indicated a further bearish bias. The pair has broken key support given at 1.0458 (16/03/2015 low). Key resistance holds at 1.1714 (24/08/2015 high). Expected to head towards parity.
GBP/USD's bullish pressures have faded abruptly. Hourly resistance is located at 1.2615 (27/03/2017 high) while hourly support can be found at 1.2324 (03/17/2017 low). Expected to show continued strengthening towards stronger resistance at 1.2775 (06/12/2016 high) if support area around 1.24 stands. The long-term technical pattern is even more negative since the Brexit vote has paved the way for further decline. Long-term support given at 1.0520 (01/03/85) represents a decent target. Long-term resistance is given at 1.5018 (24/06/2015) and would indicate a long-term reversal in the negative trend. Yet, it is very unlikely at the moment.
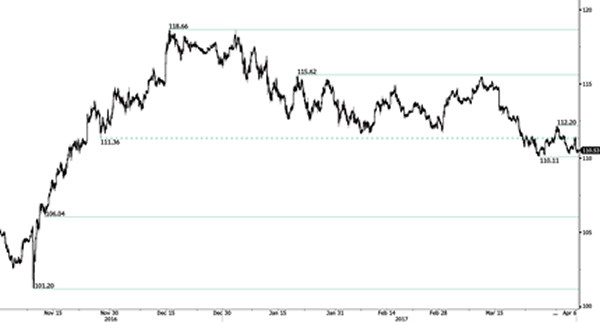
USD/JPY's momentum is slowing down. Hourly resistance is given at 112.20 (31/03/2017 high). Stronger resistance can be located at 113.57 (16/03/2017 high) while support is given at 110.11 (27/03/2017 low). We favor a long-term bearish bias. Support is now given at 96.57 (10/08/2013 low). A gradual rise towards the major resistance at 135.15 (01/02/2002 high) seems absolutely unlikely. Expected to decline further support at 93.79 (13/06/2013 low).
USD/CHF is strengthening. Hourly support is given at 0.9814 (27/03/2017 low). Key resistance can be found at a distance at 1.0344 (15/12/2016 high). Expected to show another leg higher. In the long-term, the pair is still trading in range since 2011 despite some turmoil when the SNB unpegged the CHF. Key support can be found 0.8986 (30/01/2015 low). The technical structure favours nonetheless a long term bullish bias since the unpeg in January 2015.
| EURUSD | GBPUSD | USDCHF | USDJPY |
| 1.1300 | 1.3121 | 1.0652 | 118.66 |
| 1.0954 | 1.2775 | 1.0344 | 115.62 |
| 1.0906 | 1.2706 | 1.0171 | 112.20 |
| 1.0653 | 1.2462 | 1.0060 | 110.67 |
| 1.0494 | 1.2377 | 0.9814 | 108.50 |
| 1.0341 | 1.2110 | 0.9550 | 106.04 |
| 1.0000 | 1.1986 | 0.9444 | 101.20 |
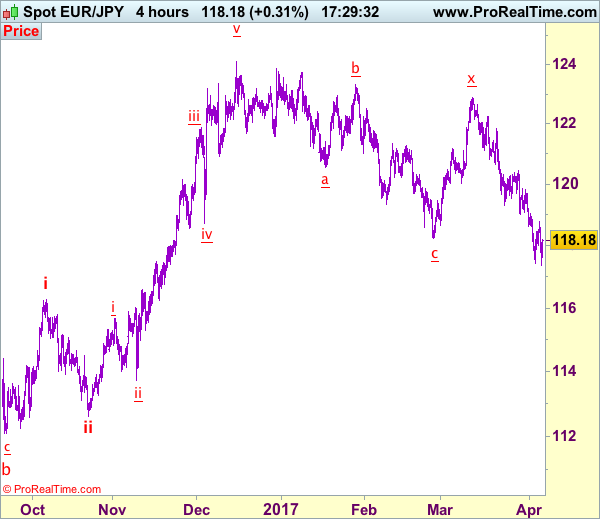
Trade Idea: EUR/JPY – Sell at 119.00
EUR/JPY - 118.13
Recent wave: wave v of (C) ended at 94.12 and major correction in wave A has ended at 149.79
Trend: Near term down
Original strategy:
Sell at 118.85, Target: 116.60, Stop: 119.45
Position: -
Target: -
Stop: -
New strategy :
Sell at 119.00, Target: 117.00, Stop: 119.60
Position: -
Target: -
Stop:-
As the single currency has remained under pressure, suggesting recent erratic decline from 124.10 top (2016 high) is still in progress and bearishness remains for this move to extend weakness to 117.00 but oversold condition should prevent sharp fall below 116.50-60 and reckon 116.15-20 would hold from here, bring rebound later.
In view of this, would not chase this fall here and would be prudent to sell euro on subsequent rebound as 118.90-00 should limit upside. Above 119.06 resistance would defer and suggest a temporary low is possibly formed, risk rebound to 119.40-50 but price should falter below resistance at 119.85, bring another selloff.
Our latest preferred count is that wave (ii) is ABC-X-ABC which ended at 123.33 and wave (iii) is unfolding with wave iii ended at 100.77, followed by wave iv at 111.57 and wave v as well as the wave (iii) has ended at 97.04, followed by wave (iv) at 111.43 and wave (v) has ended at 94.12 which is also the end of the larger degree v, this also implied the major wave (C) has also ended there, hence major correction has commenced from there with (A) leg unfolding in its lower degree wave c which has possibly ended at 145.69. Under this count, A-B-C wave (B) has commenced with A leg ended at 136.23, wave B at 143.79 and wave C has possibly ended at 149.79.
Our larger degree count is that the decline from 139.26 is wave (C) and is sub-divided into a diagonal triangle i-ii-iii-iv-v with wave i - 105.44, wave ii- 123.33, wave iii - 97.03, wave iv - 111.43, followed by the final wave v as well as the end of wave (C) at 94.12, this also mark the bottom of larger degree wave B. Under this count, major rise in wave C has commenced as an impulsive wave with minor wave III ended at 145.69, wave V is still in progress for further gain to 150.00. Having said that, this so-called wave V could well be the first leg of larger degree 5-waver wave C and this wave C should bring at least a retest of wave A top at 169.97 (July 2008).
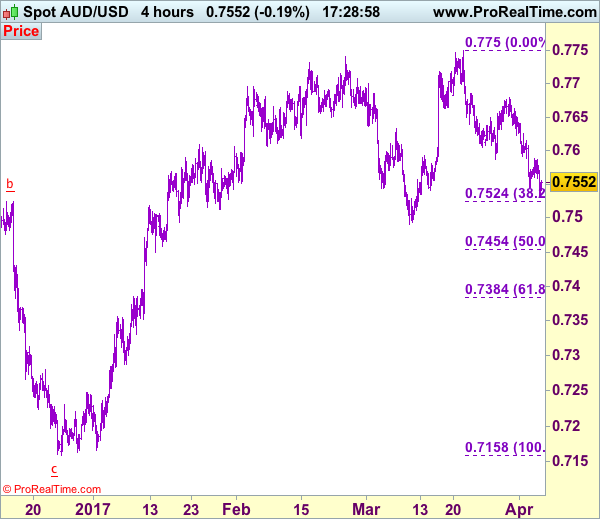
Trade Idea: AUD/USD – Buy at 0.7525
AUD/USD – 0.7552
Recent wave: Wave 5 ended at 1.1081 and major correction has commenced for fall to 0.7000 and then towards 0.6500-10
Trend: Near term up
Original strategy :
Sell at 0.7605, Target: 0.7410, Stop: 0.7665
Position: -
Target: -
Stop: -
New strategy :
Buy at 0.7525, Target: 0.7680, Stop: 0.7465
Position: -
Target: -
Stop:-
Although aussie has fallen again after brief recovery to 0.7588 and near term downside risk remains for the fall from 0.7750 to extend weakness to 0.7520-25 (38.2% Fibonacci retracement of 0.7158-0.7750), loss of near term downward momentum should prevent sharp fall below there and reckon indicated support at 0.7491 would hold, bring rebound later, above said resistance at 0.7588 would suggest a temporary low is possibly formed, bring rebound to 0.7625-30 and later towards resistance at 0.7680-85.
In view of this, we are inclined to buy aussie on next decline. Below said support at 0.7491 would signal the fall from 0.7750 is still in progress for further weakness to 0.7450-55 (50% Fibonacci retracement of 0.7158-0.7750), however, oversold condition should limit downside to 0.7380-85 (61.8% Fibonacci retracement), risk from there is seen for a rebound later.
On the 4-hour chart, the move from 0.8066 is the wave 5 with i: 0.8860, ii: 0.8315, wave iii is an extended move ended at 1.0183, iv: 0.9706 and wave v has ended at 1.1081 (also the top of entire wave 5). The subsequent selloff is the major correction which is unfolding as ABC-X-ABC and 2nd A leg has ended at 0.8848, followed by a-b-c wave B which ended at 0.9758, hence, 2nd C wave is now in progress and indicated downside target at 0.7000 and 0.6950 had been met, so further fall to 0.6710-20 cannot be ruled out.
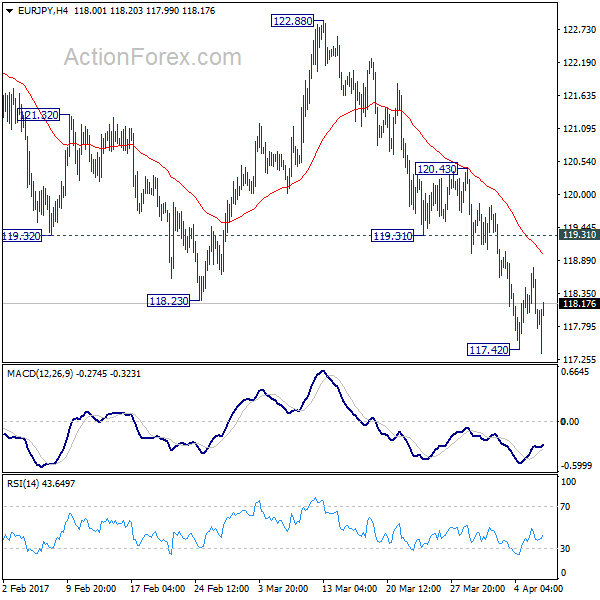
EUR/JPY Daily Outlook
Daily Pivots: (S1) 117.77; (P) 118.27; (R1) 118.54; More...
With 119.31 support turned resistance intact, deeper fall is expected in EUR/JPY. Current development suggests that medium term rise from 109.20 has completed at 124.08 already. Below 117.42 will target 61.8% retracement of 109.20 to 124.08 at 114.88 next. Nonetheless, sustained break of 119.31 will turn focus back to 120.43 resistance instead.
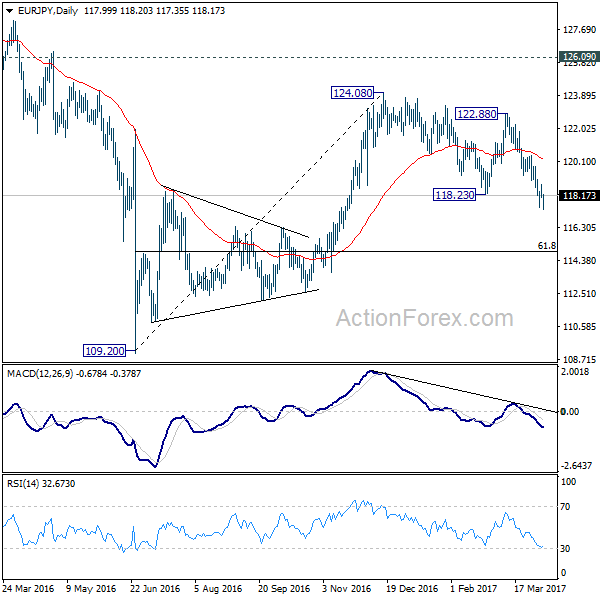
In the bigger picture, the firm break of 38.2% retracement of 109.20 to 124.08 at 118.39 indicates that medium term rise from 109.20 is completed at 124.08. That's well below 126.09 key support turned resistance. Also, EUR/JPY failed to sustain above 55 week EMA. Deeper decline would now be seen back to 109.20 low. Overall, the down trend from 149.76 (2014 high) is not completed yet. Break of 109.20 will resume such down trend towards 94.11 low. In any case, break of 126.09 is needed needed to confirm medium term reversal.
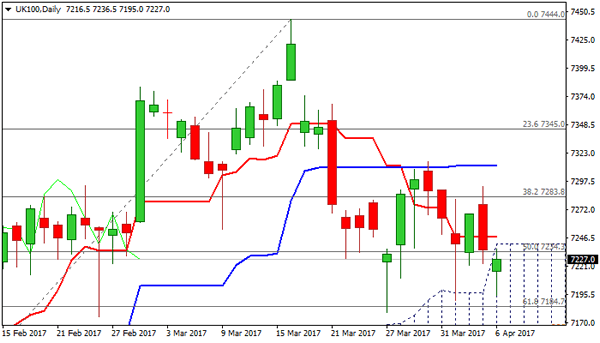
Technical Outlook: FTSE100 – Break Into Daily Cloud Weakens Near-Term Structure
FTSE broke into daily cloud in extension of Wednesday's strong fall (the biggest one-day loss since 21 Mar).
Fresh weakness on strengthening pound neutralized hopes of stronger upside action, signaled by Diamond bottom pattern that usually signals reversal.
Instead, the price penetrated daily cloud top which underpinned the rally since mid-Dec 2016, and re-focus key support at 7179 (27 Mar correction low / bottom of near-term 7179/7315 congestion, also near Fibo 61.8% of 7024/7444 upleg).
Wednesday's long bearish candle weighs on near-term action, with repeated close in daily cloud, needed to maintain bearish pressure.
Sustained break below 7179 trigger would signal continuation of correction from 7444 (01 Mar fresh record high).
Broken daily cloud top and Tenkan-sen line (7141/47 respectively) mark solid barriers which are expected to ideally cap.
Conversely, lift above daily Tenkan-sen would ease immediate bearish pressure and re- focus upper pivots at 7280 and 7311.
Res: 7241, 7247, 7280, 7311
Sup: 7195, 7179, 7123, 7100
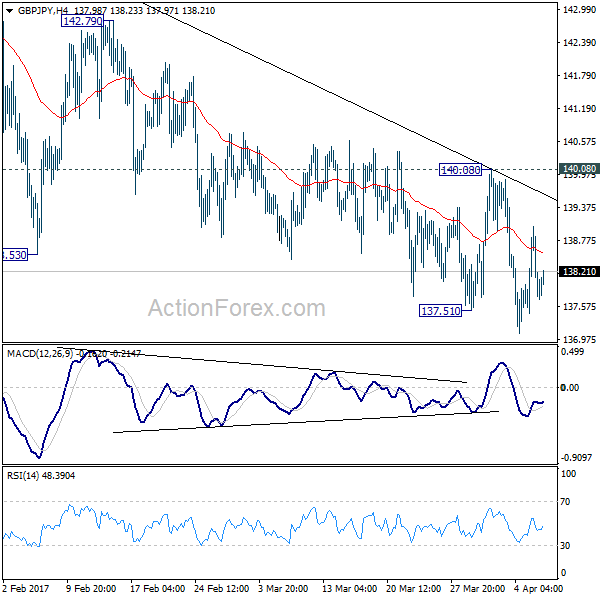
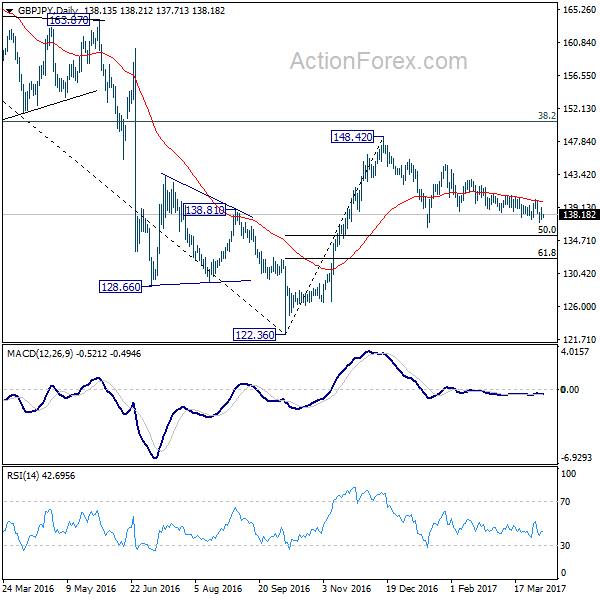
GBP/JPY Daily Outlook
Daily Pivots: (S1) 137.41; (P) 138.22; (R1) 139.00; More...
With 140.08 resistance intact, further fall is expected in GBP/JPY. Decline from 144.77 would target medium term fibonacci level at 135.39. Overall, price action from 148.42 are seen as a consolidation pattern. We'll look for bottoming around 135.39. Meanwhile, break of 140.08 resistance is needed to indicate short term reversal. Otherwise, outlook will remain bearish in case of recovery.
In the bigger picture, price actions from 122.36 medium term bottom are still seen as a corrective pattern. Main focus is on 38.2% retracement of 195.86 to 122.36 at 150.42. Rejection from there will turn the cross into medium term sideway pattern. Or, sustained break of 50% retracement of 122.36 to 148.42 at 135.39 will turn outlook bearish for a test on 122.36 low. Though, sustained break of 150.42 will extend the rebound towards 61.8% retracement of 195.86 to 122.36 at 167.78.
GBP/USD: Attempts To Retake 1.25
'We do not believe the USD will weaken through key technical and psychological levels in the coming month.' – HSBC (based on PoundSterlingLive)
Pair's Outlook
Even though the ADP data surprised to the upside yesterday, the FOMC Minutes weighed on the US Dollar, allowing the Pound to erase most of Tuesday's losses. Another positive development is expected today, with the Cable reclaiming the 1.25 major level. However, there are doubts the exchange rate will be able to stabilise above the 1.2516 mark, namely the weekly PP, as there are no solid market drivers present today. On the other hand, the Buck has a tendency of strengthening the day ahead of the NFP data; therefore, a slide back towards the support cluster circa 1.2425 is not out of the question.
Traders' Sentiment
Traders' sentiment remains bullish, now with 58% of all open positions being long (previously 57%). At the same time, the share of purchase orders inched up from 51 to 55%.
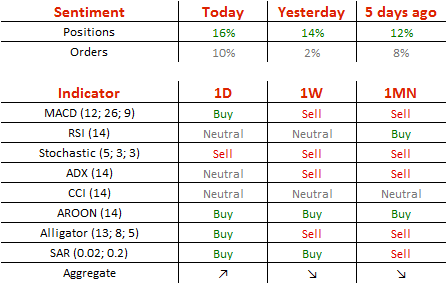
EUR/USD: Trades In Established Range
'The FOMC minutes were clear that officials are contemplating beginning to address the balance sheet.' – March Chandler, Brown Brothers Harriman (based on investing.com)
Pair's Outlook
On Thursday morning the common European currency traded against the US Dollar below the resistance cluster, which it faced previously. The currency exchange rate has been trading in the same range since April 2, as it is squeezed in between the resistance put up by the 55-day SMA at 1.0674, together with the monthly PP at 1.0685, and the support of the 23.60% Fibonacci retracement level, which is located at the 1.0639 level. The pair is set to continue the fluctuations between the two mentioned levels until a fundamental event sets the pairs future course.
Traders' Sentiment
SWFX traders remain bearish on the pair, as 54% of open positions are short. However, 54% of trader set up orders are to buy the Euro.
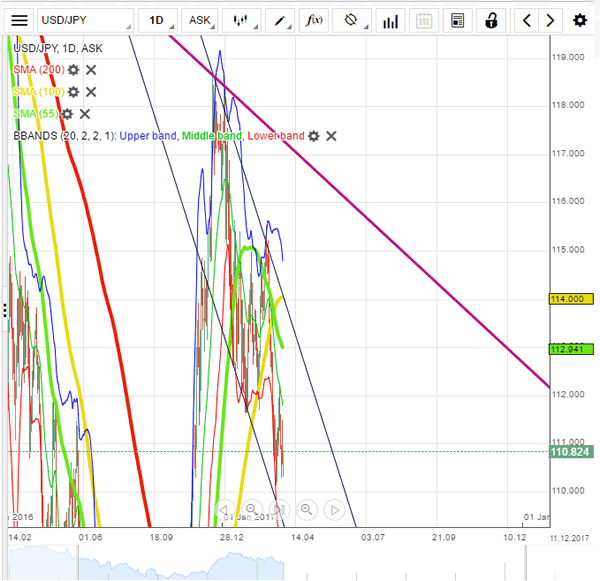
USD/JPY: Stuck Around 110.75
'The foreign exchange market's main focus remains whether or not Trump can carry out his policies, and whether the U.S. economy will stay strong enough for the Fed to stick to the path of rate hikes.' – Sony Financial Holdings (based on Business Recorder)
Pair's Outlook
The USD/JPY currency pair weakened for the fourth time in a row yesterday, unable to maintain trade in the green zone. According to technical studies, another leg down should take place, however, that might not be the case. The weekly S1 is providing immediate support at 110.27, while the 110.50 level is providing additional psychological support, which altogether could help the Greenback to post a mild recovery. Nevertheless, gains are unlikely to exceed 50 pips, as the weekly PP represents the upper border at 111.23. The pair is expected to remain within this trading range, namely between the weekly S1 and PP.
Traders' Sentiment
Although not as strong as yesterday, but market sentiment remains bullish at 67%. The portion of sell orders surged from 37 to 66%.