Sample Category Title
FOMC Minutes: Quantitative Tightening Is Moving Closer
In terms of the economic development there was not much new in the FOMC minutes, as the FOMC members have already been quite outspoken since the meeting. The overall message from the meeting was that the Fed is on track and delivered one of the three hikes it projected back in December 2016 - the Fed has not become more hawkish, see FOMC Review: Fed says it is on track, not more hawkish, 15 March. The Fed signalled a total of three Fed hikes both this year and next year, more or less in line with our expectations. We expect the Fed to hike in July and December and 3-4 times next year.
However, as Yellen had hinted at, the FOMC participants discussed when to change their current reinvestment strategy (which states that the Fed will continue to reinvest principal payments until the normalisation of the Fed funds rate is 'well under way'). The minutes say that 'a change to the Committee's reinvestment policy would likely be appropriate later this year'. We still expect the Fed to begin shrinking its balance sheet in Q1 18 (what we call quantitative tightening), while consensus among both primary dealers and analysts is mid-2018, but risk is skewed towards already by the end of this year (perhaps December). We think an announcement on what could trigger quantitative tightening is likely in connection with the June meeting. The FOMC members still want quantitative tightening to be 'conducted in a passive and predictable manner'.
We have written intensively on quantitative tightening recently. Rising demand for currency, change in US treasury cash balance policy and financial regulation limit the scope for a reduction of the balance sheet. The risk is that quantitative tightening could lead to an unwarranted tightening of USD liquidity. For more see also Research US: Fed's regulatory hurdle for starting quantitative tightening, 13 March.
The participants also discussed whether the timing of quantitative tightening should be based on a quantitative threshold or on a qualitative judgement. Based on the minutes, 'several' participants prefer the former while 'some' prefer the latter, meaning that quantitative tightening would likely depend on the Fed funds target range or the level of an economic variable (possibly the PCE inflation rate or the unemployment rate, as was the case with the Evans rule).
The minutes indicate that the FOMC members 'generally preferred to phase out or cease reinvestments of both Treasury securities and agency MBS'. This is slightly new, as the Fed has previously indicated it preferred to reduce its holding of MBS. The FOMC members also discussed pros and cons about whether to phase out or cease reinvestments all at once without being specific about what they prefer.
Also interesting, the Fed staff still expects the Trump administration to ease fiscal policy but has 'pushed back the timing of when those policy changes were anticipated to take effect'. We have also become more pessimistic on the outlook for Trumponomics after the Republicans' failure to change Obamacare. Changes to US economic policy are likely to come later and be smaller than previously expected due to the uncertainty within the Republican Party. For more details see also Strategy: Trumponomics postponed further, 24 March.
Daily Technical Analysis: EURUSD, GBPUSD, USDJPY, USDCHF
EURUSD
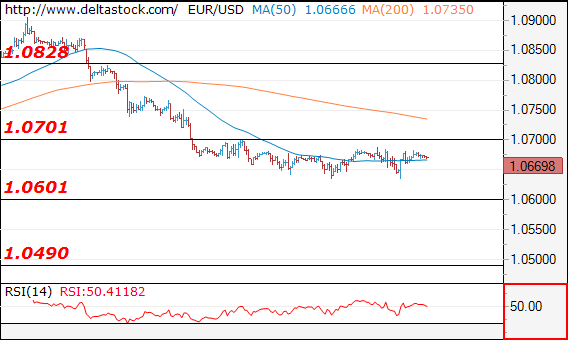
The EURUSD had another indecisive movement yesterday. The bias remains neutral in nearest term. Price has been moving sideways between 1.0635 – 1.0700 range area as you can see on my H1 chart below suggests a consolidation phase. That said, price is still in a bearish short-term trend after formed a 'shooting star' formation on daily chart last week and broke below the trend line support as you can see on my H1 chart below, targeting 1.0600 region. Immediate resistance is seen around 1.0700. A clear break above that area could trigger further bullish pressure but only a clear break and daily close above 1.0750 would end the current bearish short-term bias. Fundamental focus will be on the US NFP on Friday. Overall I remain neutral.
GBPUSD
The GBPUSD failed to continue its bearish momentum yesterday topped at 1.2497 and hit 1.2501 earlier today in Asian session. The bias is neutral in nearest term. As you can see on my H1 chart below, price is moving inside a triangle formation suggests a consolidation phase after a bullish run from 1.2108 on March 14. Price needs to break above the triangle (1.2525) to continue this bullish run retesting 1.2615 region. On the downside, the lower line of the triangle located around 1.2425 and 1.2375 are key supports at this phase. Fundamental focus will be on the US NFP on Friday. Overall I remain neutral.
USDJPY
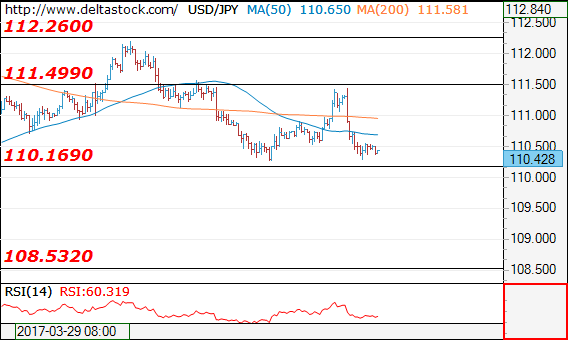
The USDJPY attempted to push higher yesterday but whipsawed to the downside and closed lower at 110.67 after a rejection to break above 111.30 key resistance. The bias is bearish in nearest term but note that we need a clear break and daily close below 110.10 key support to establish a new and longer bearish trend with nearest target seen around 108.50 area. On the upside, a clear break and daily close back above 111.30 would expose 112.00 or higher. Fundamental focus will be on the US NFP on Friday.
USDCHF
The USDCHF had a bullish momentum yesterday topped at 1.0076 but closed lower at 1.0049 and hit 1.0026 earlier today in Asian session. For me this is a false breakout above 1.0060 resistance. The bias is bearish in nearest term testing 0.9990. On the upside, any sustained movement above 1.0060 would expose 1.0120 or higher. Fundamental focus will be on the US NFP on Friday. Overall I remain neutral.

APAC Session: North Korea Worries Weigh On Yen/Nikkei
USD/JPY trades heavier along with the Korean Won as North Korea tensions also weigh on Japan stocks.
North Korea tensions were the highlight of the Asia session, eclipsing last night's blockbuster ADP Employment Change, and the FOMC minutes Federal Reserve balance sheet unwind bombshell. President Trump spoke with Prime Minister Abe about the situation ahead of his meeting with China's President Xi, reiterating it seems nothing is off the table. Unsurprisingly, the USD/KRW has traded higher throughout the session, up 9 Won or 0.80% to 1133.
USD/JPY has also traded heavily, down 40 points to 110.30 at one stage before settling at 110.50 as the Nikkei dropped one percent on safe-haven flows. This is in exception to most of the G-10 where the USD has been flat to small up on the day. Clearly, regional worries are taking precedence over a massive ADP figure of 263,000 and the news that the FOMC are looking at a balance sheet run down to start later in the year. The latter in particular is significant, as to my mind it adds up to a potentially 3rd effective tightening to come making it four for the year.
The focus will now be on the important 110.00/110.10 support level on USD/JPY where we expect to see a lot of two-way interest with the possibility of stop-losses behind setting a new trading range. Ahead of this, there is support at 110.25, with resistance at yesterday's high at 110.75 and then 111.50. As equities and metals rolled over last night on the FOMC news, it was surprising that USD yields in fact fell.
As equities and metals rolled over last night on the FOMC news, it was surprising that USD yields in fact fell. A catch-up correction higher is possibly the only thing that could prevent at least a test of the 110 area. Tonights Non-Farm Payrolls becomes even more important in this context with estimations marked higher materially following the ADP overnight.
AUD/USD
The Aussie Dollar has been the other main mover in the Asian session with a double whammy from the banking regulator and China data. APRA, the Australian Banking Regulator, intends to make banks hold more capital against risky mortgage lending. Housing Capital: source AFR This followed already announced limits to interest-only lending recently announced.
The March China CaixinPMI Services then came in at a six-month low of 52.2.
CHINA MAR CAIXIN PMI SERVICES: 52.2 (6-month low and 3rd straight sequential decline) V 52.6 PRIOR,
The AUD dropped 40 points to a low of 7530 before a slight recovery to 7542. Having broken down on the AUD/JPY cross the AUD/USD is now eyeing the important support zone of 7490/7500. A daily close below suggests a new and lower trading range is on the card. Up above AUD now has resistance at 7590 and then 7680.
FOMC Minutes: Balance Sheet Reduction is on the Horizon
Yesterday, the Fed minutes from the latest FOMC gathering revealed that policymakers are considering how, when, and at what speed they should begin reducing the Fed's gigantic balance sheet, which was inflated while the Bank was purchasing assets under its prior QE operations. The Committee would like to see this process begin later this year, with a clearly communicated plan in order to avoid any financial instability.
These signals should have normally been seen as somewhat optimistic by the market, as they imply further reduction in accommodation. However, the reaction in USD was volatile, with the currency unable to assume a clear direction after the release. EUR/USD continued to oscillate between 1.0640 (S1) and 1.0700 (R1) and therefore, we keep the view that the short-term outlook of the pair is neutral for now.
The focus for USD traders now turns to the Trump - Xi Jinping meeting today (see below), as well as tomorrow's employment data. In our opinion, EUR/USD is likely to continue trading within the range between 1.0640 (S1) and 1.0700 (R1), waiting for Friday's jobs data to assume a short-term direction. Bearing in mind that the ADP print exceeded its forecast by far, there is the possibility for the NFP number to also beat its forecast of 180k. Something like that could encourage EUR/USD bears to drive the battle below 1.0640 (S1) and perhaps target initially the crossroad between the 1.0600 (S2) territory and the upside support line taken from the low of the 3rd of January.
Trump and Xi Jinping will meet to discuss trade
With regards to the meeting between US President Trump and the Chinese President Xi Jinping, we believe that it will be closely watched by investors, as the two are expected to discuss trade. Considering that the issue of unfair trade practices by other nations and specifically China was a monumental theme of Trump's campaign, this meeting may be seen as a risk to continued free trade.
In our view, any talks of increased protectionism between the world's two biggest economies could heighten concerns regarding protectionism on a global scale and thereby, weigh on the currencies of heavily trade-oriented nations, such as Australia and New Zealand. AUD/USD slid yesterday after finding resistance near the 0.7585 (R2) barrier, to break below the support (now turned into resistance) of 0.7545 (R1). Given that the pair continues to trade within the downward sloping channel that has been containing the price action since the 17th of March, we believe that the short-term outlook remains negative. Nevertheless, given our proximity to the lower bound of that channel, we would be careful of a corrective rebound before sellers decide to take control again.
As for the rest of today's highlights:
During the European day, the economic calendar is very light. The only release that could attract some attention are the minutes from the ECB's March policy meeting. Even though these are usually not a major market mover, given the relatively hawkish signals we got at that meeting and the subsequent Reuters article that investors over-interpreted those signals, the minutes could attract some attention.
As for the economic data, from the US we get initial jobless claims for the week ended on the 31st of March, while in Canada, building permits for February are due out.
We have four ECB speakers on the agenda: President Mario Draghi, Vice President Vitor Constancio, as well as Executive Board members Peter Praet and Jens Weidmann.
EUR/USD
Support: 1.0640 (S1), 1.0600 (S2), 1.0570 (S3)
Resistance: 1.0700 (R1), 1.0725 (R2), 1.0770 (R3)
AUD/USD
Support: 0.7525 (S1), 0.7500 (S2), 0.7460 (S3)
Resistance: 0.7545 (R1), 0.7585 (R2), 0.7600 (R3)
Forex Technical Analysis: EUR/USD, USD/JPY, GBP/USD
EUR/USD
Current level - 10669
My outlook here remains bearish below 1.0700 resistance, for a break through 1.0600 support, towards 1.0490 lows.
| Resistance | Support | ||
| intraday | intraweek | intraday | intraweek |
|
1.0700 |
1.0904 |
1.0600 |
1.0600 |
|
1.0828 |
1.1010 |
1.0490 |
1.0490 |
USD/JPY
Current level - 110.42
The recent spike to 111.50 sets the finale of the consolidation pattern above 110.16 and I favor a break through that low to initiate a slide towards 108.50 zone.
| Resistance | Support | ||
| intraday | intraweek | intraday | intraweek |
|
111.50 |
113.50 |
110.16 |
109.75 |
|
112.26 |
115.65 |
108.50 |
107.80 |
GBP/USD
Current level - 1.2486
The intraday bias is rather neutral within the tight consolidation range, so allow a short-lived rise above 1.2500, before drowning towards 1.2235 zone
| Resistance | Support | ||
| intraday | intraweek | intraday | intraweek |
|
1.2550 |
1.2620 |
1.2375 |
1.2230 |
|
1.2620 |
1.2705 |
1.2235 |
1.2107 |
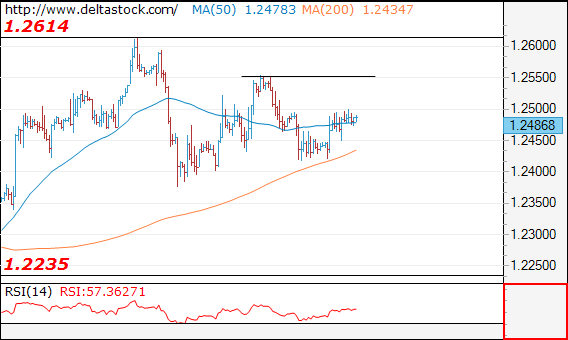
GBPUSD – Break Above Daily Tenkan-Sen To Trigger Fresh Bullish Acceleration, Thick Hourly Cloud Underpins
Cable is holding on the front foot in early Thursday's trading, following strong bounce from 100 SMA support (1.2414), driven by upbeat UK data on Wednesday. The price emerged above daily cloud but remains capped by daily Tenkan-sen (1.2494) for now. Daily cloud is narrowing and will twist next week that may drag sterling lower again. Studies on daily chart remain bullishly aligned and favor further upside, which needs sustained break above Tenkan-sen barrier. Also, thick hourly cloud (1.2484/1.2440) continues to underpin (near-term action is holding around cloud top) This scenario requires top of narrowing daily cloud (currently at 1.2457) to keep the downside protected. Conversely, extended weakness below hourly cloud would generate bearish signal and risk retest of 100 SMA pivot.
Res: 1.2494; 1.2529; 1.2553; 1.2594
Sup: 1.2471; 1.2457; 1.2440; 1.2414
Technical Outlook: EURUSD Remains In Extended Consolidation, Violation Of Pivotal Points At 1.0622 And 1.0700 To Signal Near-Term Direction
The Euro remains directionless for the fifth day, ranging between 100SMA (1.0622) and daily Kijun-sen (1.0700) in consolidation phase of recent strong fall from 1.0905 (27 Mar high). Overall bearish bias keeps selling upticks strategy in play on existing risk of renewed attempts below 100 SMA and thinning daily cloud (currently spanned between 1.0611 and 1.0583) for resumption of near-term downtrend from 1.0905. On the other side, repeated failures to close below important support at 1.0650 (Fibo 61.8% of 1.0493/1.0905 ascend) require caution on continued signals of downtrend's stall and basing attempts. Stronger reversal signals could be expected on firm break above 1.0700 that should sideline bearish strategies and look for further bullish signals on extension above next pivots at 1.0737 (Fibo 38.2% of 1.0905/1.0633 fall) and 1.0769 (daily Tenkan-sen) in extension.
Res: 1.0687, 1.0700, 1.0737, 1.0769
Sup: 1.0650, 1.0633, 1.0622, 1.0611
Currencies: Dollar Declines As Fed Minutes Trigger Risk-Off Correction
Sunrise Market Commentary
Rates: FOMC' warning on equity valuations triggers risk aversion
FOMC Minutes showed that a sudden stop or tapering of reinvestments of maturing assets on the Fed's balance sheet could already stop at the end of 2017. US Treasuries gained ground despite this hawkish shift, profiting from safe haven flows as stocks fell prey to profit taking because of a reference to “quite high” prices in those some Minutes.
Currencies: Dollar declines as Fed Minutes trigger risk-off correction
Yesterday evening, the dollar reversed earlier gains after the Fed Minutes. The Fed signaled that more policy normalization is likely. However, it didn't help the dollar as some members warned on equity valuation, pushing USD/JPY back towards the recent lows. However, at some point, the prospect of tighter US monetary conditions should support the dollar
The Sunrise Headlines
- US equities had a late-day change of hearts after FOMC Minutes showed that some members thought that equity prices were “quite high” relative to standard valuation measures. Overnight, Asian stocks lose ground as well.
- March FOMC Minutes showed that the Fed would likely begin shrinking a $4.5T portfolio of Treasury and mortgage securities later this year, though they remained undecided on how quickly to reduce the holdings and to what level.
- An independent gauge of China's services sector (Caixin PMI) declined from 52.6 to 52.1 and diverged further from its official counterpart in March, suggesting growth at smaller and private firms slowed markedly in the first quarter.
- Theresa May has begun to dismantle roadblocks to a Brexit deal, including accepting the possible extension of free movement, as the European Parliament agreed to open the way to a potential “association agreement”.
- US House of Representatives Speaker Ryan said that tax reform will take longer to accomplish than repealing and replacing Obamacare would, saying Congress and the White House were initially closer to agreement on healthcare legislation than on tax policy.
- Oil prices fell as record US crude inventories underscored that crude markets remain bloated, despite efforts led by OPEC to cut output and prop up prices. Brent crude declined from $55/barrel to $54/barrel.
- Today's eco calendar is rather uninspiring with only weekly jobless claims and ECB Minutes. Spain and France tap the market while several ECB and Fed members are scheduled to speak
Currencies: Dollar Declines As Fed Minutes Trigger Risk-Off Correction
USD declines as Fed signals policy normalization
The dollar (especially USD/JPY) initially profited from a strong ADP labour report yesterday. This move was reversed after the FOMC Minutes. Most Fed members anticipated that gradual rate increases would continue and that a change in the reinvestment policy would be appropriate later this year. Some members also considered equity valuations as “quite high”. US bond yields and the dollar declined after the Minutes. Risk-off sentiment weighed. Markets apparently also assume that a shrinking of the balance sheet could lead to slower Fed rate hikes. USD/JPY reversed early gains to finish the session at 110.70. EUR/USD touched a miner intraday low at the time of the publication, but rebounded to close the session at 1.0663.
Overnight, WS risk off sentiment also affected Asian markets. Most indices show losses of 0.5%/1.0% , with China outperforming and Japan underperforming. The Chinese Caixin PMI's eased slightly in March (low 52 area). USD/JPY retested this week's lows (110.30), but no break occurred yet (currently 110.45 area). EUR/USD holds in the 1.0675 area. Risk aversion also weighed on the Aussie dollar. AUD/USD dropped to the 0.7535 area, even as the dollar is under pressure across the board. Selling in the likes of AUD/JPY probably weighs.
Today, the eco calendar is thin. US weekly jobless claims have gone up in past weeks. For the latest week a drop to 250 000 from 258 000 is expected. We don't expect much market reaction on the eve of the publication of the US payrolls. ECB speakers include Draghi, Praet (2X), Weidmann and Constancio (2X). Fed Williams speaks, too. The ECB publishes the Minutes of its March meeting. Given the controversy about the interpretation of the communication after the meeting, the ECB minutes might be more interesting than usual.
Last week, the dollar correction slowed on decent US eco data and as Fed speakers confirmed further policy normalization in 2017. At the same time, the euro lost momentum as speculation on an early ECB policy normalization eased. However, the dollar rebound had no strong legs as US yields remain relatively low near key support levels. Yesterday's data and the Fed Minutes didn't help the dollar. The Fed's warning on equity valuations was a US negative. At the same time, the Fed repeated its firm intention to continue policy normalization both by raising the policy rate and by shrinking the balance sheet. The (FX) market apparently anticipates that reducing the balance sheet might slow the pace of Fed rate hikes. Both measures could go hand in hand if the US economy remains on track. In any case, further down the road, US monetary policy conditions will mostly be tightened which should be USD supportive.
Question is where the USD correction will stop. In a day-to-day perspective, a negative risk sentiment might still push US yields a few bps lower with a test of 2.3% support in the US 10-yr yield. As we assume that this level will hold, we also look for a bottoming out process of the dollar. From a technical point of view, USD/JPY last week failed to regain the 111.36/60 previous range bottom. A decline below 110 would signal more trouble ahead. We remain cautious on USD/JPY ST and first want a clear sign that a solid bottom is in place. EUR/USD extensively tested the topside of the MT range, but the test was rejected last week. The 1.0874/1.0906 area now looks a solid resistance. EUR/USD might return lower in the previous 1.0875/1.05 trading range.
EUR/USD: correction slows as USD rebound fails to gain traction
EUR/GBP
Sterling holds near the recent highs
Yesterday, the UK services PMI was the key driver for sterling trading. The January and February PMI's showed a loss of momentum in UK services' growth (Feb 53.3). However, the March measure surprised again on the upside and printed at a solid 55.00. Sterling jumped higher upon the publication of the report. EUR/GBP dropped from the 0.8585 area to the mid 0.85 area. In a similar way, cable jumped from the 1.2440 area to the 1.2480 area. After this reset, both EUR/GBP and cable settled again in very tight intraday ranges. EUR/GBP closed the session at 0.8542. Cable closed the session at 1.2483 supported by post-Fed USD softness
Later today, there are no important eco data on the agenda in the UK. The political bickering between the UK and the EU on the start of the Brexit negotiations continues. However, for now there is no big impact on sterling. A slightly risk-off sentiment is most often a (slightly) negative for sterling. However, with the dollar trading soft, the impact might also remain modest. So, a calm order driven session can be expected for sterling trading. Mid-March, sterling found a better bid after higher than expected UK inflation and a more hawkish tone from the BoE. We changed our short-term bias on EUR/GBP from positive to neutral. The EUR/GBP 0.88/0.84 range should guide EUR/GBP trading medium term. Since late last week, the sterling rally/short-squeeze shows tentative signs of running into resistance, but we see no trigger for a real change in sentiment yet. Longer term, Brexit-complications remain a potential negative for sterling. We are not convinced that the BoE will raise rates anytime soon, even not after recent higher inflation data
EUR/GBP sterling short-squeeze is easing, but no sustained sterling correction yet
Appetite To Risk Evaporated As Fed Signalled Double Tightening Whammy
Equities across Asia fell on Thursday following Wall Street's biggest one-day reversal in 14 months after the Fed minutes indicated that officials are ready to target the over bloated balance sheet.
The Japanese Yen led the gains in currency markets, touching its highest levels in more than four months against the dollar. Government bond yields dropped across the globe, and futures markets are indicating further declines in U.S. equities.
Yesterday's Fed minutes sent a couple of warning signs which have led to this reversal. The expected gradual increase in interest rates was not one of them given that this factor has already been priced in the markets. However, the discussions of reducing the balance sheet, currently at $4.5 trillion, wasn't received with open arms as it suggests a double tightening policy, “combination of higher rates and reduction in QE.” This is likely to be the next hot topic in monetary policy actions, and the key question is going to be; will the Fed successfully remove unconventional policies without disrupting the markets?
The more compelling message was related to equity valuations. Some Fed participants viewed equity prices as quite high relative to standard valuation measures. Well, there's nothing new here. Whoever is buying into this market already knows that valuations are overstretched, but this isn't the kind of message an investor wants to hear from the system which supported the 8-year bull market. We rarely receive such comments from monetary policy makers, and while it doesn't necessarily mean a correction is due immediately, investors should become more cautious.
The biggest one-day reversal in 14 years was significant enough to make headlines, but overall, markets still believe that Trump has their back, and whatever we're experiencing now is just some noise. However, in my opinion, valuations are not just high relative to standard measures, they are unrealistic. Earnings remain the key missing component of the most recent rally, and if we don't see a significant improvement in the next two-quarters, there's very little chances to keep going north.
Today's Xi-Trump meeting will attract all of the market's attention. Trump already assumes it willbe a “very difficult” meeting, criticizing the trade deficit with China and job losses. The discussions will focus on global, regional, and bilateral issues of mutual concern according to the White House, but traders' spotlight will be on the trade part. The best-case scenario is the meeting ends peacefully, with both presidents shaking hands and probably playing some golf. But given that the two men are at opposite sides on several issues, it is unlikelythe meeting will end in such a way. If they don'tget along and the US-China relationship becomes gloomy, expect another wave of risk aversion to hit the markets.
Trade Idea : USD/CHF – Buy at 0.9950
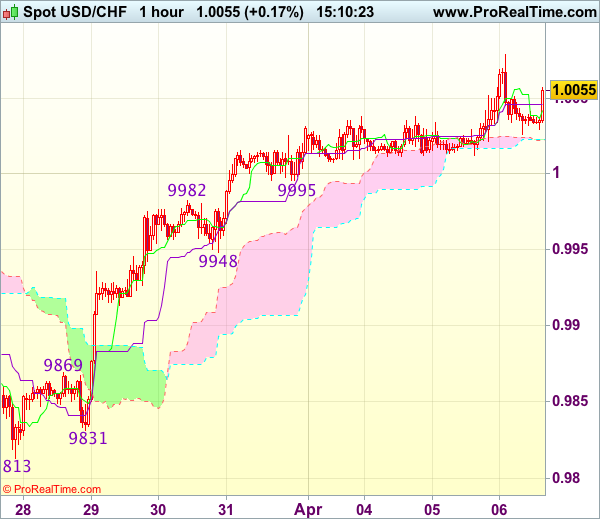
USD/CHF - 1.0063
Most recent candlesticks pattern : N/A
Trend : Near term up
Tenkan-Sen level : 1.0047
Kijun-Sen level : 1.0046
Ichimoku cloud top : 1.0023
Ichimoku cloud bottom : 1.0022
Original strategy :
Buy at 0.9950, Target: 1.0050, Stop: 0.9915
Position : -
Target : -
Stop : -
New strategy :
Buy at 0.9950, Target: 1.0050, Stop: 0.9915
Position : -
Target : -
Stop : -
As the greenback has maintained a firm undertone after last week’s rally above 1.0003 resistance, suggesting recent rise from last week’s low at 0.9813 is still in progress and bullishness remains for this move to 1.0080, then towards previous resistance at 1.0109, however, loss of upward momentum should prevent sharp move beyond latter level and reckon 1.0140-50 would hold, risk from there has increased for a retreat to take place later.
In view of this, would not chase this rise here and would be prudent to buy dollar on pullback as support at 0.9948 should limit downside. Below 0.9925-30 would abort and signal top is formed instead, bring correction to 0.9905-10 but reckon previous resistance at 0.9869 would hold from here.