Sample Category Title
Bitcoin’s (BTC/USD) Rocket Ride to Near $100,000, More to Come?
- Bitcoin’s price surge is fueled by institutional demand, growing mainstream acceptance, and a derivatives market boom.
- The derivatives market surge, while driving prices higher, also increases volatility and the risk of liquidations.
- ETF inflows have approached $2 billion in three days, further boosting Bitcoin’s rally.
Bitcoin prices continue to rise and print fresh highs as speculation continues to grow around a favorable outlook toward crypto from the incoming Trump administration. To further support these rumors, leaks about a potential White House crypto expert appointment and rumors of Trumps social media companies interest in a buyout of crypto trading firm Bakkt has aided the rally.
The Crypto Fear and Greed index shows markets are in a period of extreme greed.
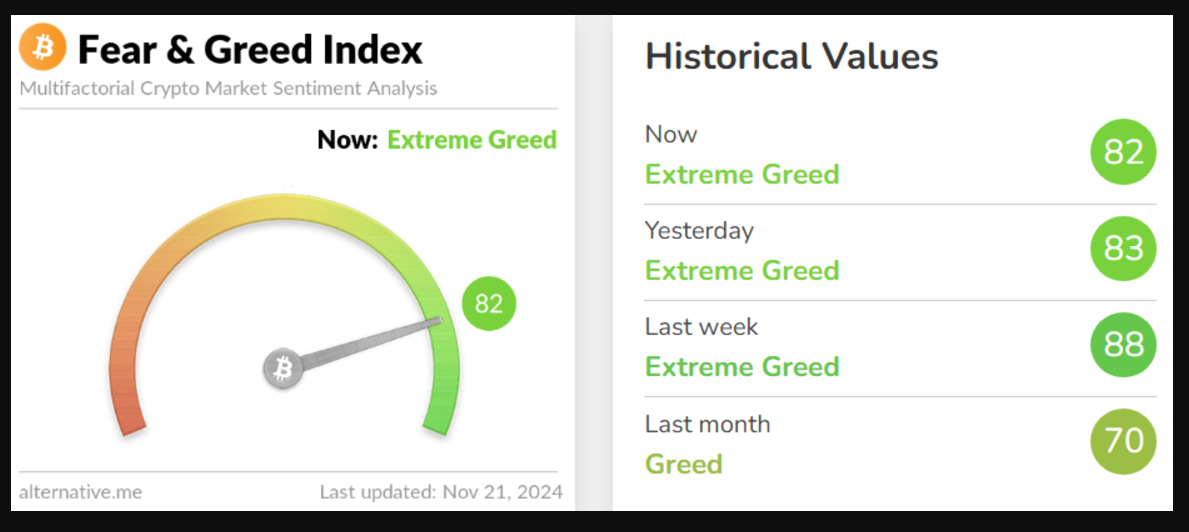
Source: FinancialJuice
The question is whether this will lead to pullback or are we set for more gains in the coming weeks?
Bitcoin’s Impressive Climb Amid Derivative Market Surge
One big reason Bitcoin’s price has gone up is because institutional demand continues to rise.. They’re putting a lot of money into Bitcoin, which makes it more trustworthy. For example, MicroStrategy has bought a lot of Bitcoin and made a good profit as its value has increased.
The way the market works also helps. More people are accepting Bitcoin as a real type of investment. Since there’s only a limited amount of Bitcoin available and more people want it, the price keeps going up on the basic rule of supply and demand.
The derivatives market is a big factor in Bitcoin’s price increase. Bitcoin’s Open Interest, which shows how many contracts are active, has reached $63 billion. This is a record amount and is much higher than in 2021 when it was over $20 billion. Back then, Bitcoin’s price was at its highest, around $69,000.
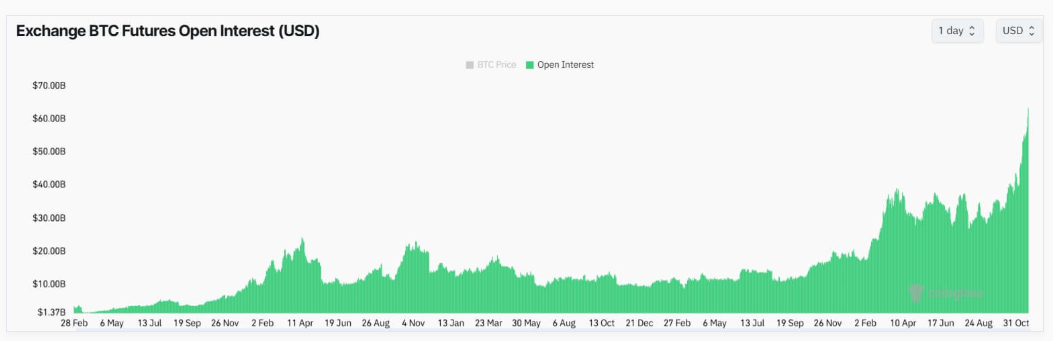
Source: Coinglass
The derivatives market surge does pose risks however with volatility expected to be higher and price swings a more common occurrence. This is simply down to leverage with wild price swings likely to lead to an increase in liquidations.
Over the past 24 hours, liquidations have totaled $450 million with around 60% of this coming from short positions. The old adage rings true for Bitcoin as well, ‘the trend is indeed your friend’.
ETF Flows Surge Approaches $2 Billion in Three Days
ETF flows have only increased over the past few days with a total nearing $2 billion over the period 18-20 November. Since November 1, Bitcoin ETFs have only experienced 5 days of outflows with 9 days of inflows.
The rise in ETF adoption is likely to continue now given the hype around the Trump Presidency and his perceived pro crypto stance. If the ETF flows continue to grow it is likely that we have not seen the last of the current Bitcoin rally.
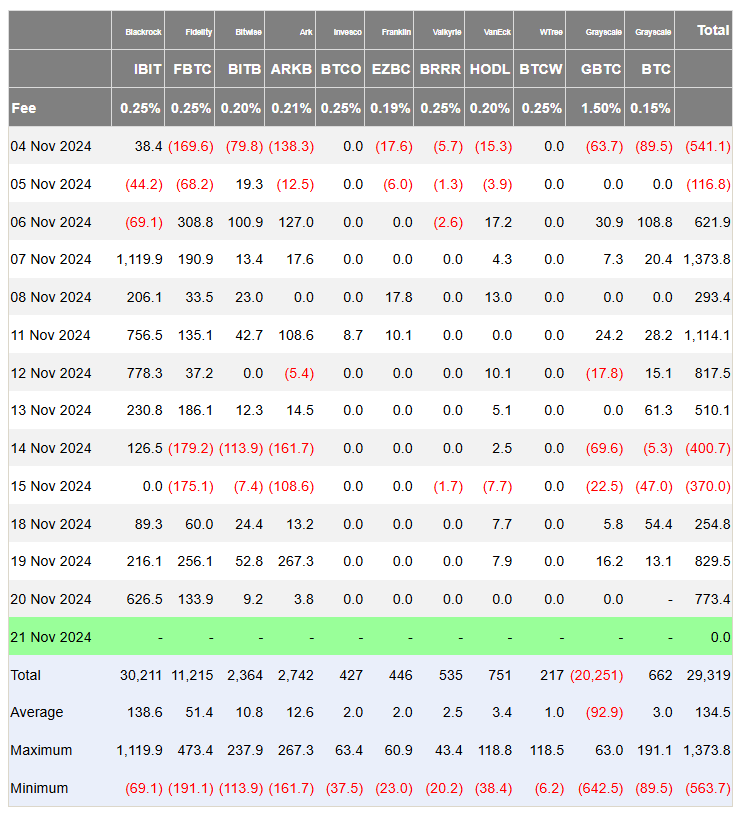
Source: Coinglass
Technical Analysis BTC/USD
Bitcoin (BTC/USD) is on a tear this week in particular, having traded just below $90k handle on Monday.
Since then, we have had 3 consecutive days of gains boosted by a combination of factors. The difficult part about the technical outlook is that there is no historical price action to base any analysis off.
As we discussed earlier in the article, there is the risk of swings due to the surge in the derivatives market. Looking at the RSI, it has been in overbought territory since Bitcoin has breached $75k. Another sign that despite the RSI being in overbought territory there is no guarantee that a pullback will materialize.
For now, immediate support is at 95000 with a break lower eyeing a move toward 91804 and then the 90000 psychological level.
Looking at a move to the upside and the 100000 mark could lead to some wild price swings as market participants may eye some profit taking as well. Beyond this at the moment, I will be keeping an eye on the round numbers/psychological numbers around 105000 and 110000.
Bitcoin (BTC/USD) Daily Chart, November 21, 2024
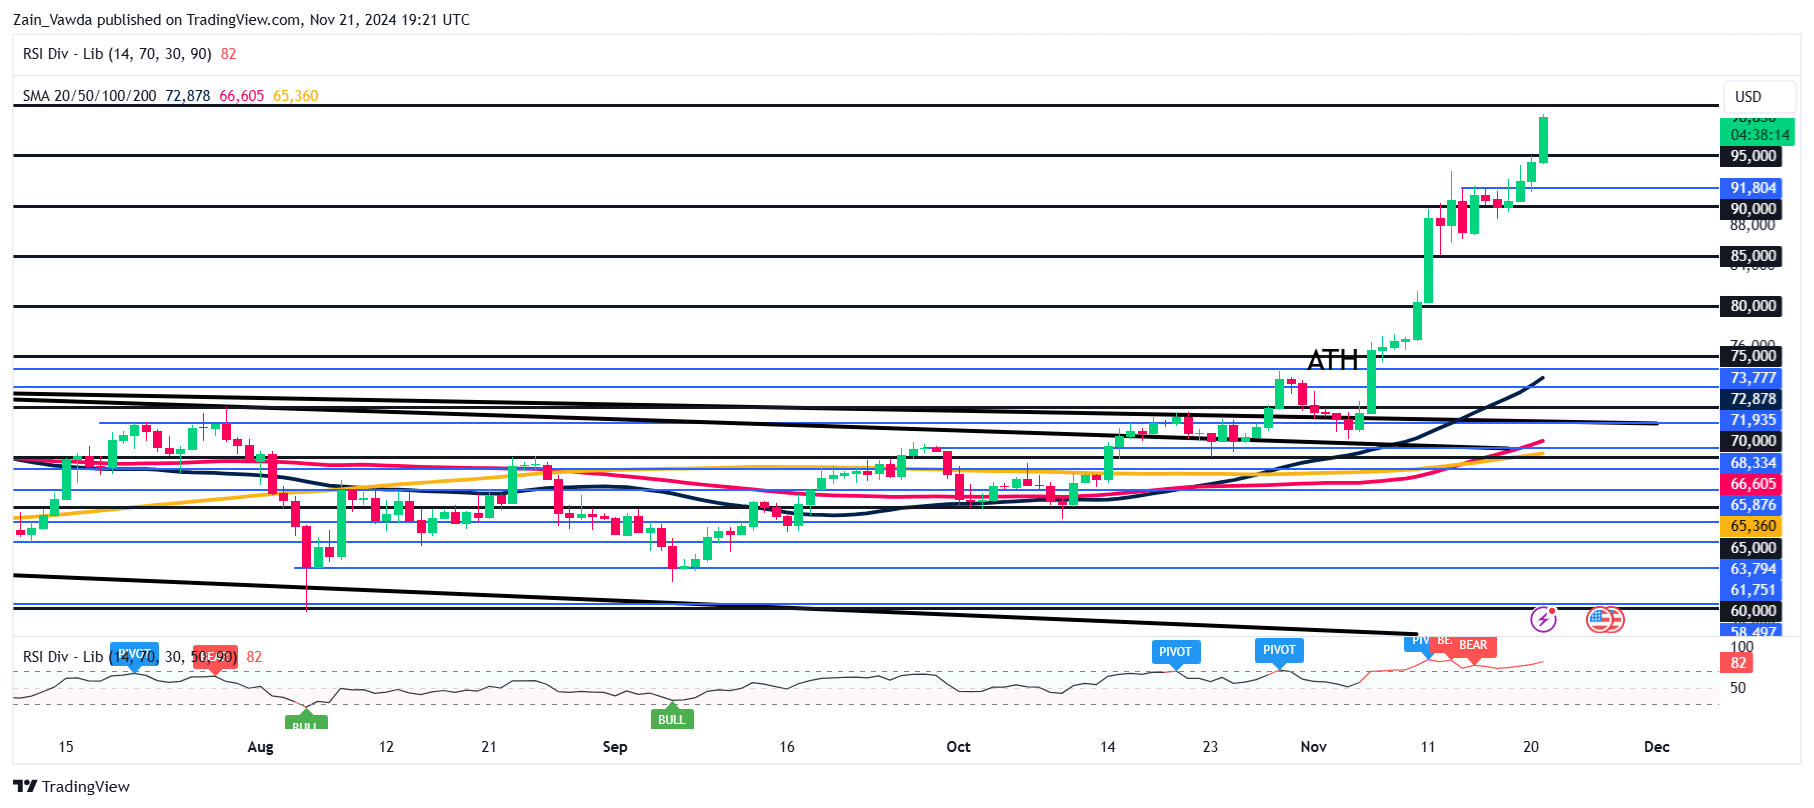
Source: TradingView.com (click to enlarge)
Support
- 95000
- 91804
- 90000
Resistance
- 100000
- 105000
- 105000
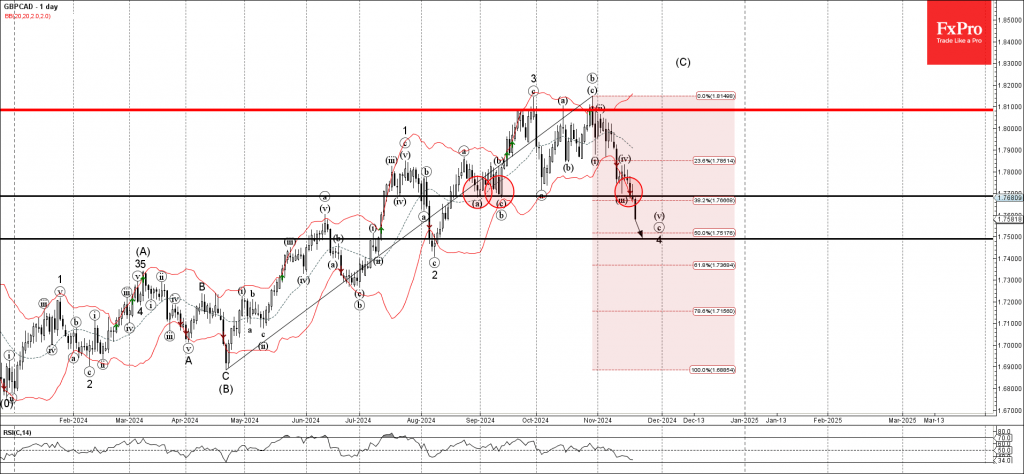
GBPCAD Wave Analysis
- GBPCAD broke support zone
- Likely to fall to support level 1.7500
GBPCAD currency pair today broke the support zone between the support level 1.7700 (which reversed the price in August and September) and the 38.2% Fibonacci correction of the upward price move from April.
The breakout of this support zone accelerated the active minor impulse wave C of the ABC correction 4 from May.
GBPCAD currency pair can be expected to fall further to the next support level 1.7500, target price for the completion of the active wave 4.
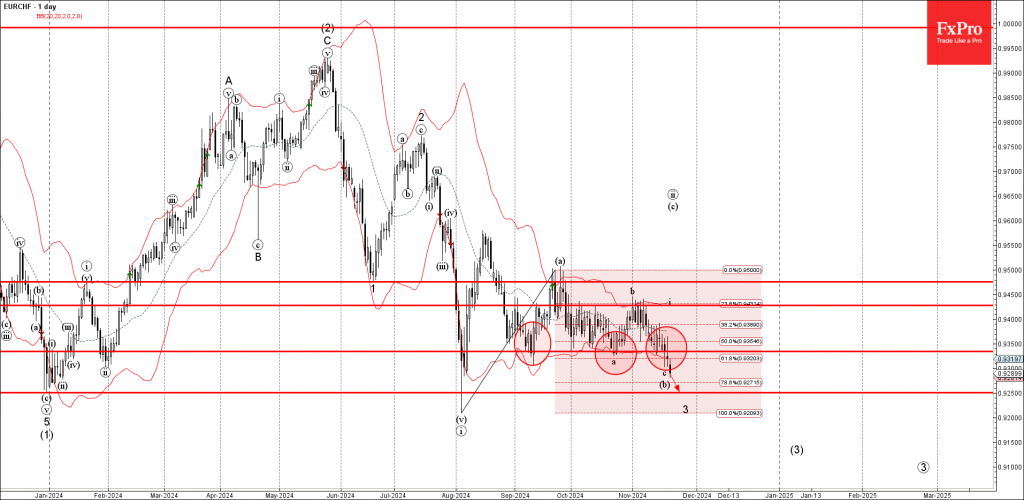
EURCHF Wave Analysis
- EURCHF under bearish pressure
- Likely to fall to support level 0.9250
EURCHF under the bearish pressure after breaking the support zone between the support level 0.9335 (which has been reversing the price from September) and the 61.8% Fibonacci correction of the upward price move from August.
The breakout of this support zone accelerated the active minor impulse wave iii of the higher order impulse wave (3) from May.
EURCHF can be expected to fall further to the next support level 0.9250, former strong support from January and August.
Sunset Market Commentary
Markets
With few data in Europe or the US, markets continued to be haunted by headlines on the war in Ukraine, even as the impact wasn’t unequivocal across markets. Ukraine reporting that Russia used an Intercontinental Ballistic missile for the first time only added to fears on a further escalation. European equites and yields nosedived. In this risk-off, the dollar gained against the euro, but declined further against the yen. Still, equities staged a (wobbling) comeback. The EuroStoxx 50 currently trades little changed. US stocks opened similarly. On interest rate markets, European yields failed to build on recent tentative bottoming. German yields currently decline 4.0/5.0 bps across the curve, with the very long end underperforming(-3.0 bp). Still recent lows survive. US Treasuries underperform. Weekly jobless claims declined further (213k) but was counterbalanced by a disappointing Philly Fed business outlook (-5.5 from 10.3 vs 8.3 expected). US yields currently decline about 2-3 bps. Money markets still see an almost even chance between a 25 bps Fed rate cut (55%) or a pauze at the December meeting. Next reality check comes with the November PMI’s, scheduled tomorrow. Oil gradually leaves recent lows behind with Brent back at $ 74 p/b.
On FX markets, the dollar looked like preparing an attack on recent highs (Ukraine) but momentum faded soon. DXY even trades marginally lower at 106.6. The euro is more vulnerable. At 1.0525, recent low at 1.0497 remains within striking distance. CEE currencies also stay in the defensive. The damage for the Czech koruna remains modest (EUR/CZK 25.33 from 25.28). The zloty trades at EUR/PLN 4.345 with multiple resistance just below/near EUR/PLN 4.40. The forint also trades off intraday lows, but struggles to sustainably return below EUR/HUF 410.
News & Views
Statistics Norway reported that mainland growth economy (excluding the offshore energy industry) accelerated to 0.5% Q/Q inn Q3 from 0.3% Q/Q in Q2. Total activity including the petroleum activities and ocean transport declined 1.8% in Q3, due maintenance operations. Value added in manufacturing and mining increased 2.3% with oil refining, chemical and pharmaceutical manufacturing contributing the most. Manufacturing has increased several quarters in a row, an accelerated further in Q3. Fishing and agriculture also increased 14% . Valued added in construction stays on a negative trajectory. Regarding final expenditure, financial consumption expenditure was almost unchanged from Q2, but Statistics Norway warns this was a complex story. Car purchases decreased, after an uptick in Q2, but service consumption and Norwegians’ consumption abroad increased. After a quick rise after the pandemic, employment growth slowed but the number of employed was still 0.2% higher compared to Q3 2023. Today’s data justify recent guidance from m the Norges Bank (NB) that a restrictive monetary policy is still needed at 4.5% this year. It only sees room for gradual easing in Q1 2025. Markets see that happen in March rather than in February. The krone extends its recent rebound currently testing first important near EUR/NOK 11.60..
The Central Bank of the Republic of Turkey (CBRT) as expected left its policy rate unchanged at 50.0%. Inflation in the country has eased over recent months (headline 48.58%, Core 47.75%). That path probably still develops slower than the CBRT hoped for as it recently raised its end of year inflation forecast to 44% (from 38%) and to 21 % eoy 2025. Still, the CBRT today sees progress as Q3 Indicators suggest domestic demand continues to slow down, reaching disinflationary levels. Core goods inflation remains low and signs for an improvement in services inflation are assessed to have become more apparent. Inflation expectations and pricing behavior tend to improve, but CBRT admits they pose risks to the disinflation process. Looking forward, CBRT assesses that a tight monetary stance will bring down the trend of monthly inflation through moderation in domestic demand, real appreciation in Turkish lira, and improvement in inflation expectations. Increased coordination of fiscal policy will also contribute to this process. CBRT concludes that a tight monetary stance will be maintained until a significant and sustained decline in the underlying trend of monthly inflation is observed, and inflation expectations converge to the forecast range. CBRT holds its final meeting of the year on December 26. Analysts remain divided whether a first limited cut will already be possible in December or whether the CBRT will (have to) wait until next year. The lira recently held near record low levels against the dollar (currently USD/TRY 34.48), but regained modest ground against the euro (EUR/TRY 36. 36).
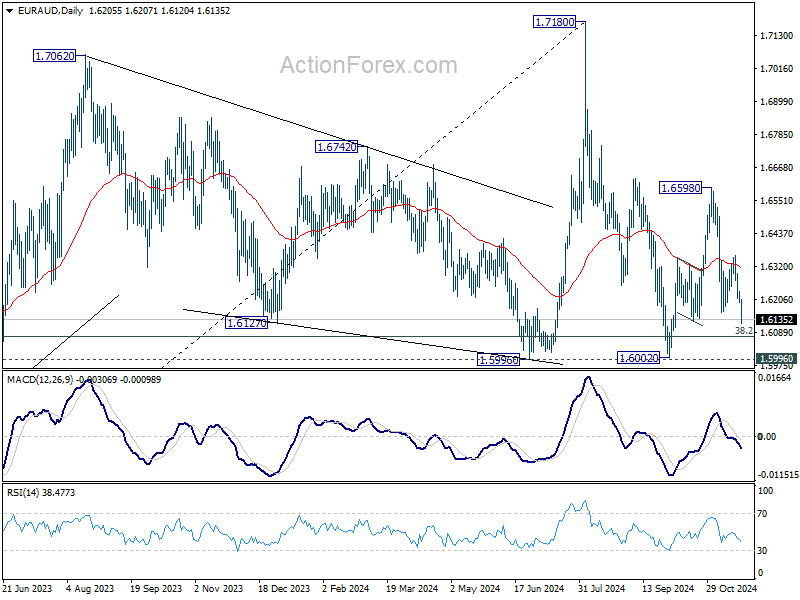
EUR/AUD Mid-Day Outlook
Daily Pivots: (S1) 1.6190; (P) 1.6214; (R1) 1.6230; More...
EUR/AUD's fall from 1.6598 resumed by breaking through 1.6161, and intraday bias is back on the downside. Deeper decline should be seen to 1.5996/6002 key support zone. Decisive break there will carry larger bearish implications. For now, risk will stay on the downside as long as 1.6359 resistance holds, in case of recovery.
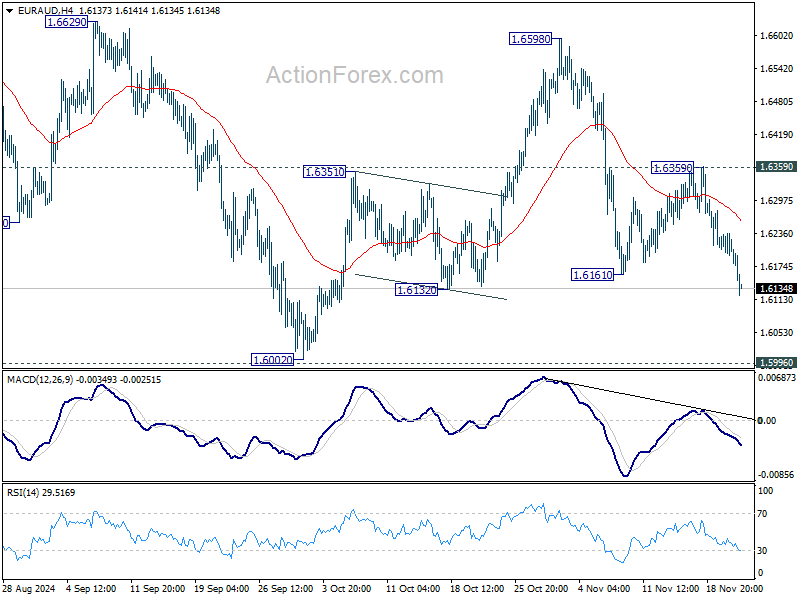
In the bigger picture, as long as 1.5996 support holds, up trend from 1.4281 (2022 low) is still expected to resume through 1.7180 at a later stage. However decisive break of 1.5996 will argue that the medium term trend might have reversed. Deeper fall would be seen to 61.8% retracement of 1.4281 (2022 low) to 1.7180 at 1.5388, even as a correction.
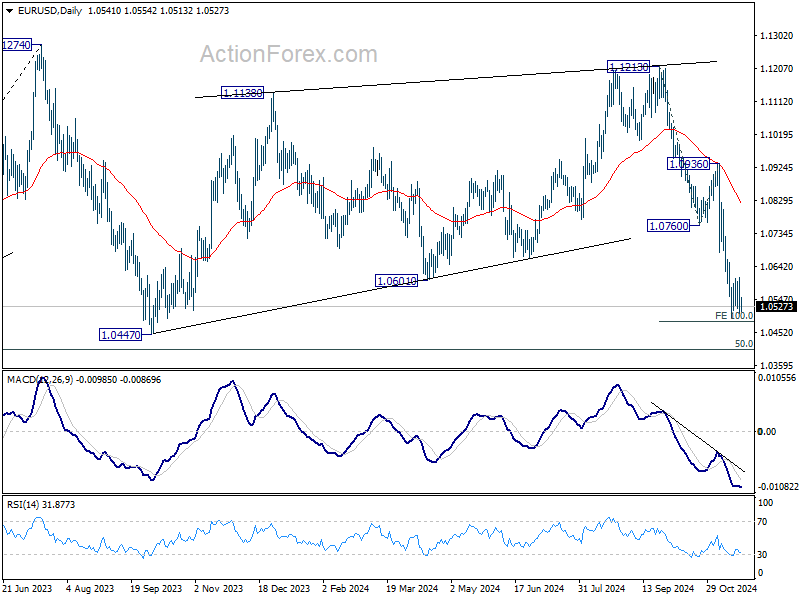
EUR/USD Mid-Day Outlook
Daily Pivots: (S1) 1.0497; (P) 1.0554; (R1) 1.0600; More...
EUR/USD is still extending consolidation above 1.0495 temporary low, and intraday bias stays neutral. Outlook remains bearish with 1.0760 support turned resistance intact. On the downside, firm break of 1.0495 will resume the fall from 1.1213 to 1.0447 support and then 1.0404 key fibonacci level next.
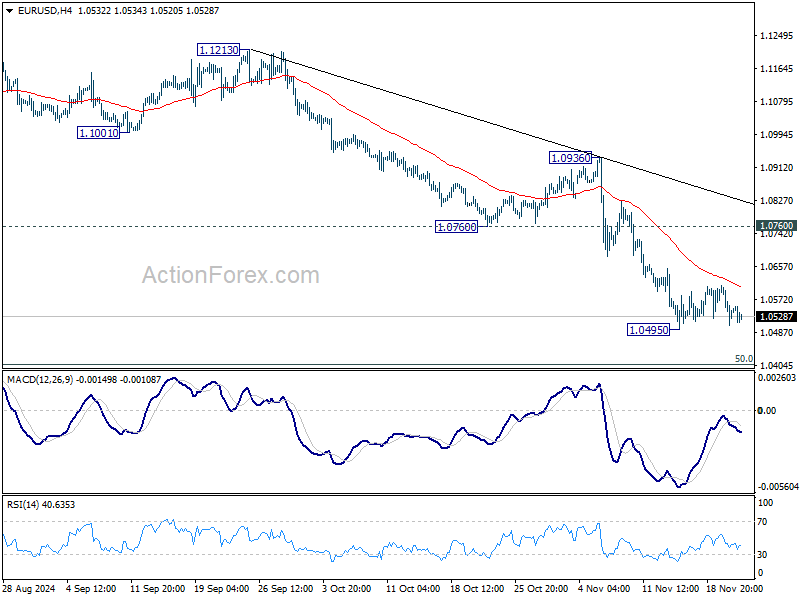
In the bigger picture, price actions from 1.1274 (2023 high) are seen as a consolidation pattern to up trend from 0.9534 (2022 low), with fall from 1.1213 as the third leg. Downside should be contained by 50% retracement of 0.9534 (2022 low) to 1.1274 at 1.0404, to bring up trend resumption at a later stage. However, firm break of 1.0404 will raise the chance of reversal and target 61.8% retracement at 1.0199.
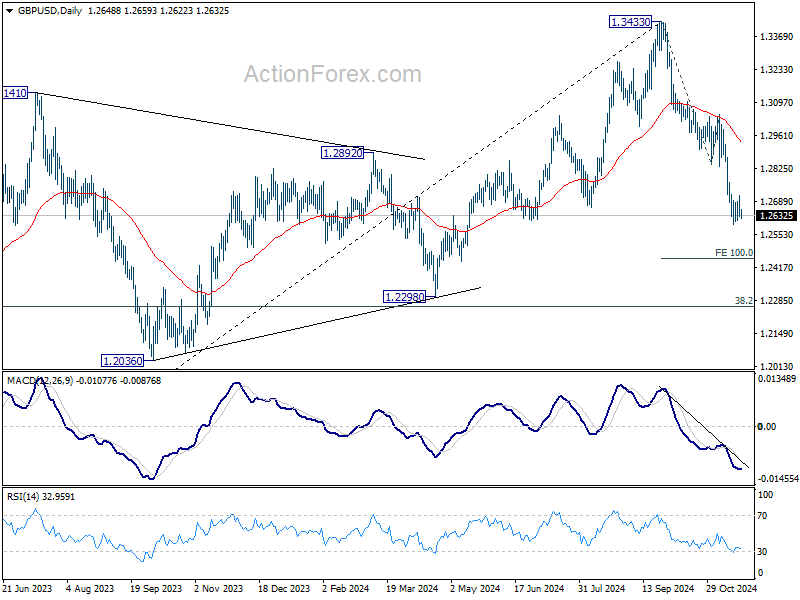
GBP/USD Mid-Day Outlook
Daily Pivots: (S1) 1.2618; (P) 1.2666; (R1) 1.2702; More...
Intraday bias in GBP/USD remains neutral for the moment, as consolidation continues above 1.2596 temporary low. Outlook stays bearish with 1.2842 support turned resistance intact. On the downside, break of 1.2596 will resume the fall from 1.3433 to 100% projection of 1.3433 to 1.2842 to 1.3047 at 1.2456.
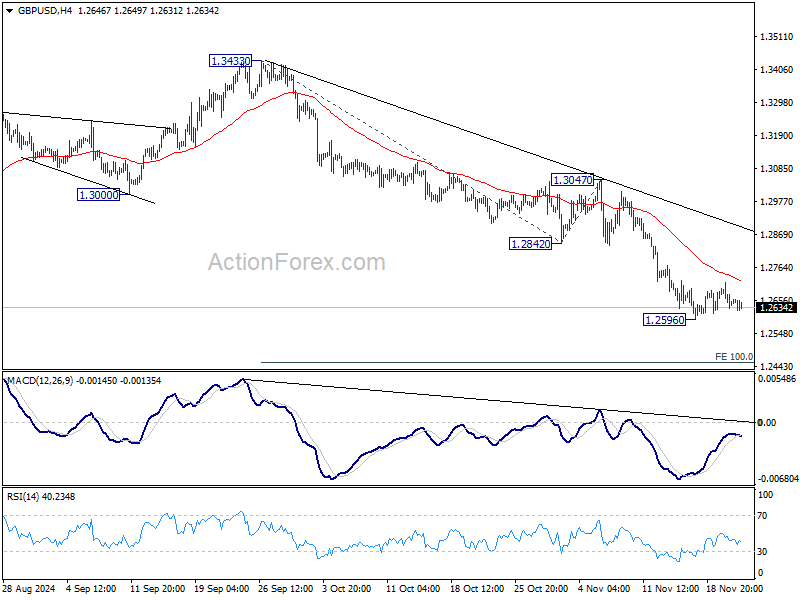
In the bigger picture, a medium term top should be in place at 1.3433, and price actions from there are correcting whole up trend from 1.0351 (2022 low). Deeper decline is now expected as long as 55 D EMA (now at 1.2977) holds, to 38.2% retracement of 1.0351 to 1.3433 at 1.2256, which is close to 1.2298 structural support. Strong support should be seen there to bring rebound.
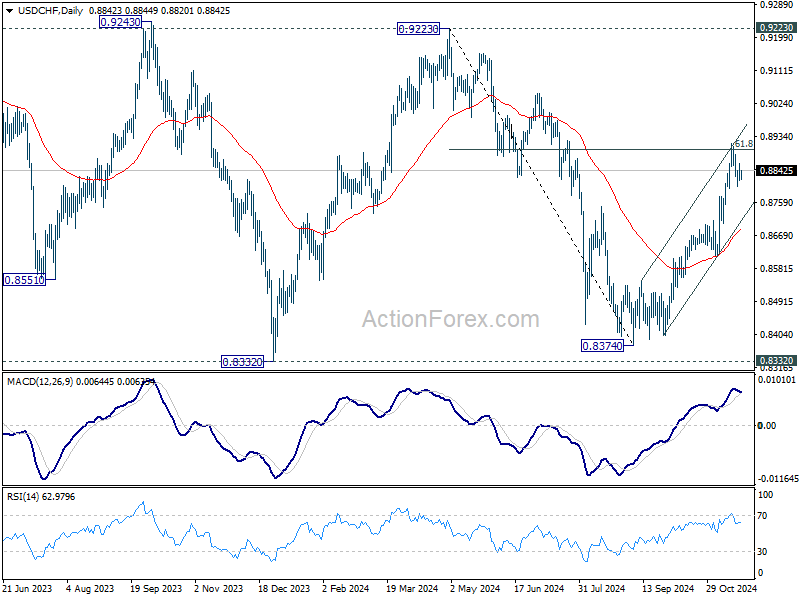
USD/CHF Mid-Day Outlook
Daily Pivots: (S1) 0.8817; (P) 0.8839; (R1) 0.8865; More…
No change in USD/CHF's outlook as consolidation continues below 0.8916. Intraday bias stays neutral at this point. Further rally is expected as long as 0.8773 resistance turned support holds. On the upside, break of 0.8916 and sustained trading above 61.8% retracement of 0.9223 to 0.8374 at 0.8899 will pave the way back to 0.9223 key resistance.
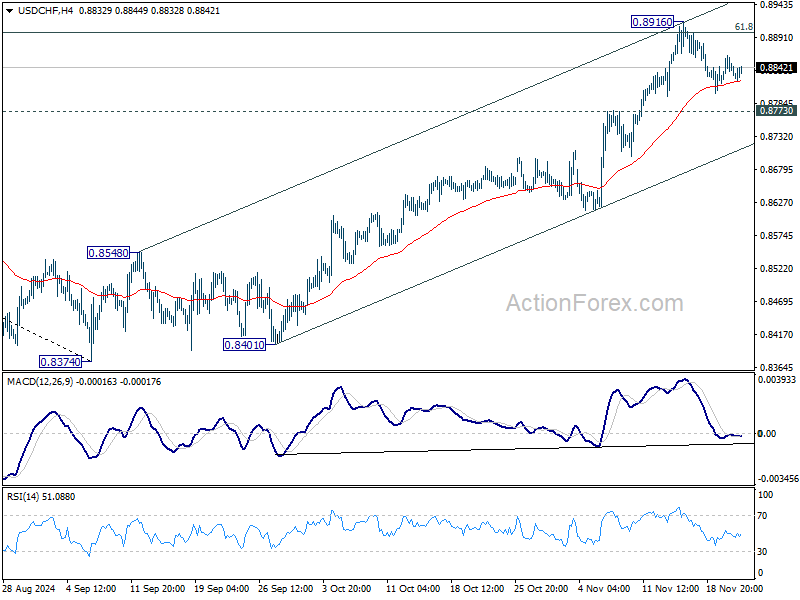
In the bigger picture, price actions from 0.8332 (2023 low) are currently seen as a medium term corrective pattern. Rise from 0.8374 is seen as the third leg. Overall outlook will continue to stay bearish as long as 0.9223 resistance holds. Break of 0.8332 low is in favor at a later stage when the consolidation completes.
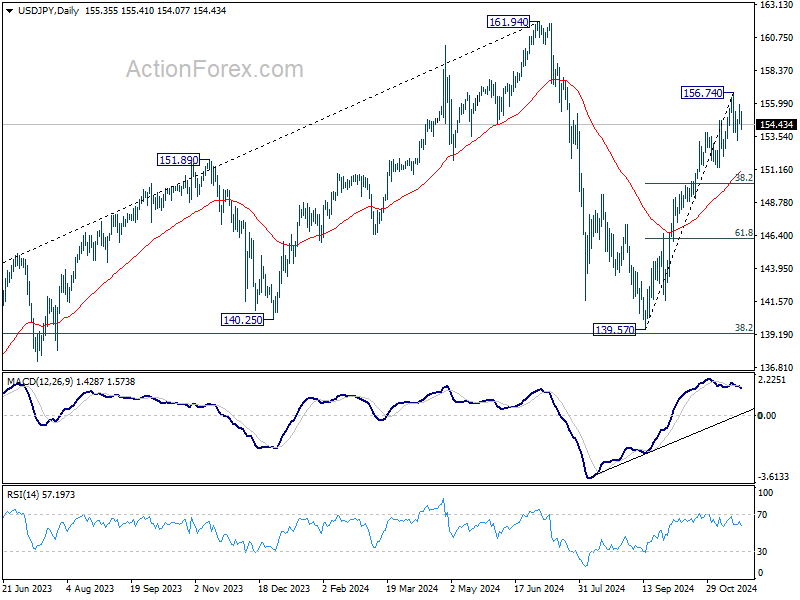
USD/JPY Mid-Day Outlook
Daily Pivots: (S1) 154.68; (P) 155.28; (R1) 156.04; More...
USD/JPY dips notably today but stays in range of 153.27/156.74. Intraday bias remains neutral at this point. On the upside, break of 156.74 will resume the whole rally from 139.57 towards 161.94 high. On the downside, though, break of 153.27 will resume the correction towards 38.2% retracement of 139.57 to 156.74 at 150.18.
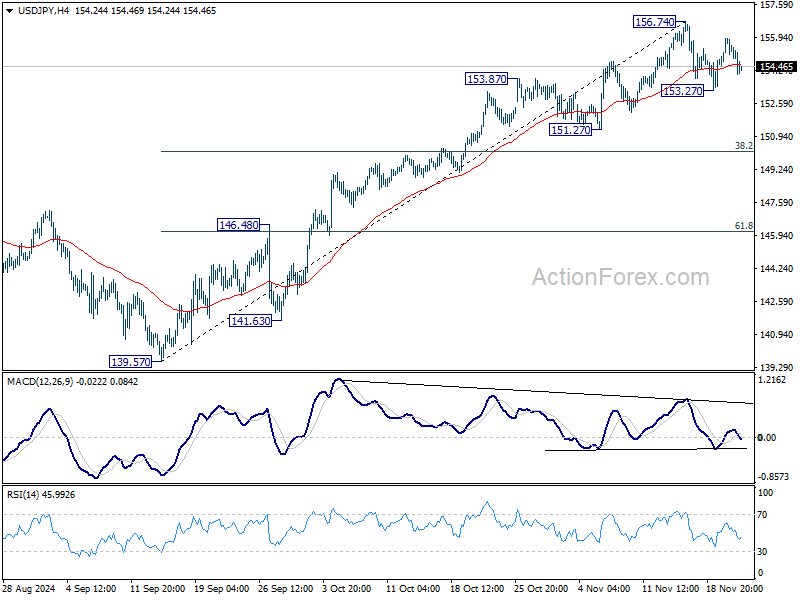
In the bigger picture, price actions from 161.94 are seen as a corrective pattern to rise from 102.58 (2021 low). The range of medium term consolidation should be set between 38.2% retracement of 102.58 to 161.94 at 139.26 and 161.94. Nevertheless, sustained break of 139.26 would open up deeper medium term decline to 61.8% retracement at 125.25.