Sample Category Title
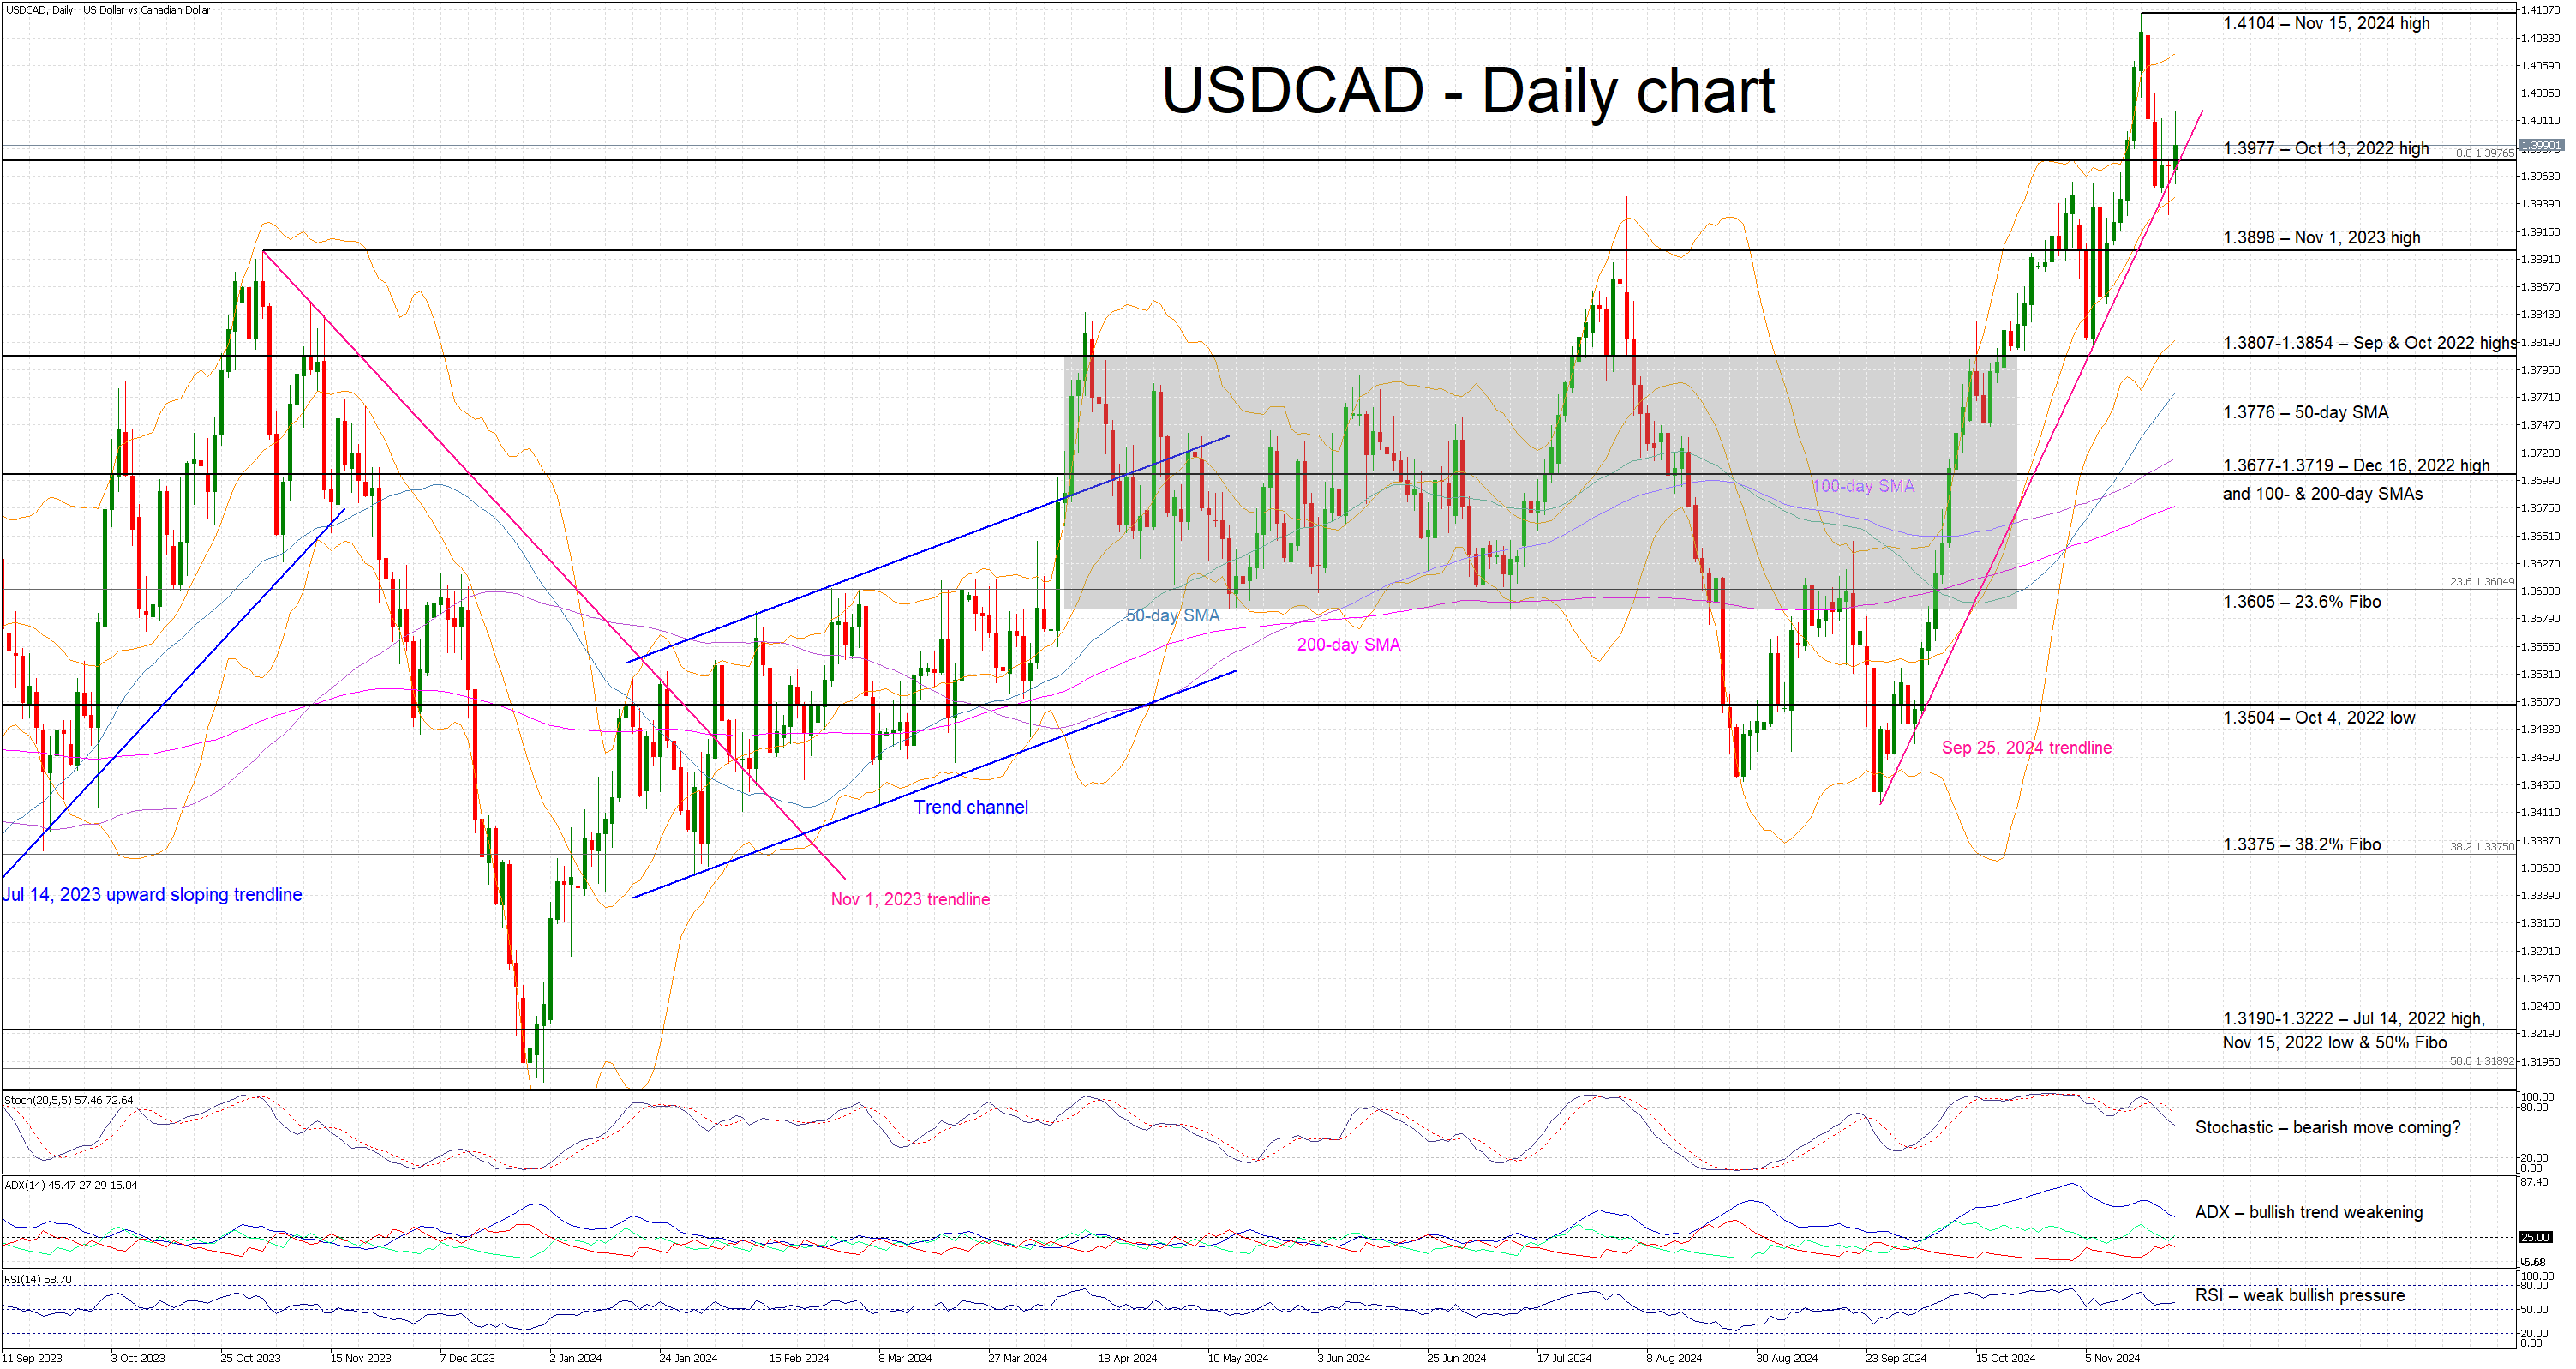
USDCAD Trades Higher, Bounces Off a Key Trendline
- USDCAD is edging higher today, a tad above 1.3977
- It bounced off the September 25, 2024 trendline
- Momentum indicators are gradually turning bearish
USDCAD is edging higher today, trading a tad above the October 13, 2022 high at 1.3977. CAD bulls’ latest attempt to push USDCAD below the September 25, 2024 ascending trendline failed, with the pair quickly climbing higher. The US dollar also got a boost from Thursday’s stronger US data prints, geopolitics and the hawkish rhetoric from Fed members. For the current bullish trend to remain in place, a new peak, above the four-year high of 1.4104, is probably needed.
Meanwhile, momentum indicators are gradually turning bearish. Specifically, the Average Directional Movement Index (ADX) is edging lower towards its midpoint, and thus pointing to a weaker bullish trend in USDCAD. Additionally, the stochastic oscillator has broken below its oversold territory (OS) and is heading aggressively lower. Should this move continue, it would be seen as a strong bearish signal. Interestingly, the RSI remains above its midpoint, but it shows little appetite for a sizeable move higher.
Should the bears remain confident, they could try to finally push USDCAD below both the October 13, 2022 high at 1.3977 and the September 25, 2024 trendline. They could then test the support set by the November 1, 2024 high at 1.3898. Even lower, the busy 1.3807-1.3854 region could prove tougher to overcome than currently imagined.
On the other hand, the bulls will try to drive USDCAD above the 1.3977 level and then gradually push it higher towards the November 15 high at 1.4104. If successful in breaking above this level, they could have the chance to record a new cycle high.
To sum up, USDCAD bears tried to have staged another selloff, but the US dollar-positive newsflow and a key upward sloping trendline have pushed USDCAD higher.
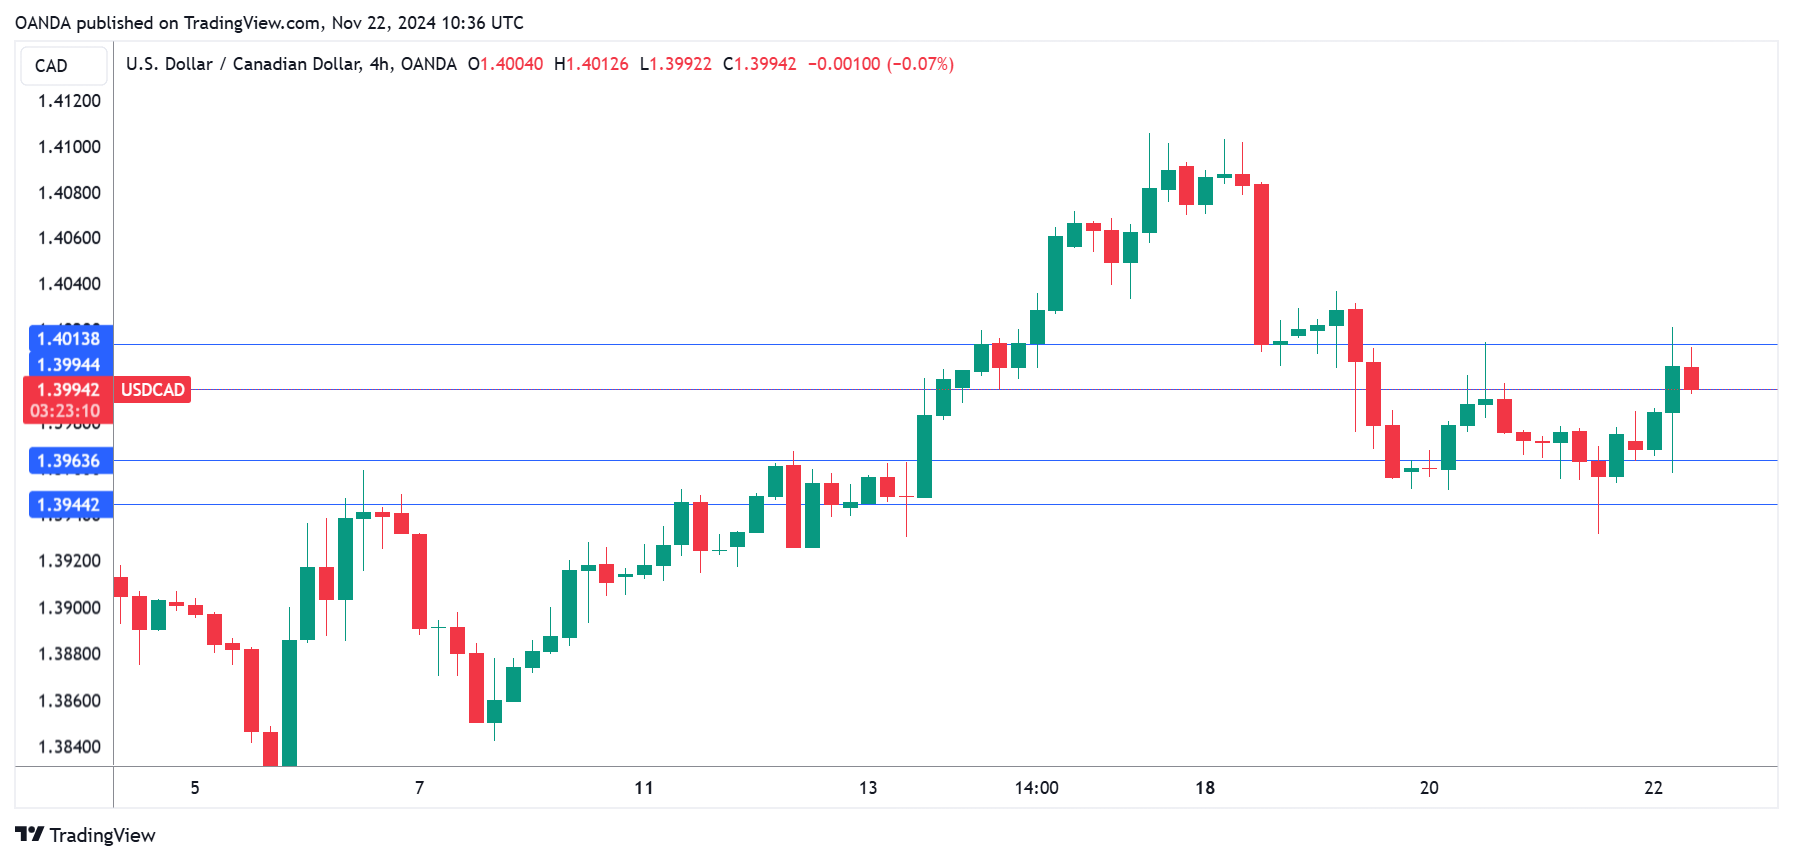
USD/CAD Flirting With 140, Retail Sales Next
The Canadian dollar is lower on Friday. In the North American session, USD/CAD is trading at 1.3998 at the time of writing, up 0.16% on the day. On the data calendar, Canada releases retail sales and the US publishes the services and manufacturing PMIs.
Canada’s retail sales expected to fall
Canada’s retail sales for September are expected to ease to 0.9% y/y, down from 1.4% in August. Monthly, retail sales are projected to remain unchanged at 0.4%. Consumer spending is expected to improve in the third quarter, in part due to the Bank of Canada’s three quarter-point cuts between June and September.
Despite the BoC’s easing cycle, consumers have remained cautious in the uncertain economic climate and the central bank will have continue to aggressively cut rates in order to boost consumer spending, a critical engine of growth. The BoC chopped rates by a half-point in October and there are calls for another half-point cut at the Dec. 11 meeting.
Still, the most likely scenario is a modest quarter-point cut, as this week’s inflation report showed that October inflation unexpectedly rose to 2%. If the November employment report is weaker than expected, pressure will rise on the Bank of Canada to deliver a half-point cut at the December meeting.
In the US, the manufacturing sector has been struggling and has contracted for four consecutive months. The Manufacturing PMI is expected to improve to 48.8 from 48.4, but a reading below 50 indicates contraction. The services sector is in much better shape and has expanded continuously since January 2023. Business activity has been the linchpin of the US economy, which has cooled down but remains in decent shape.
USD/CAD Technical
- USD/CAD is testing resistance at 1.3994. Above, there is resistance at 1.4013
- There is support at 1.3963 and 1.3944
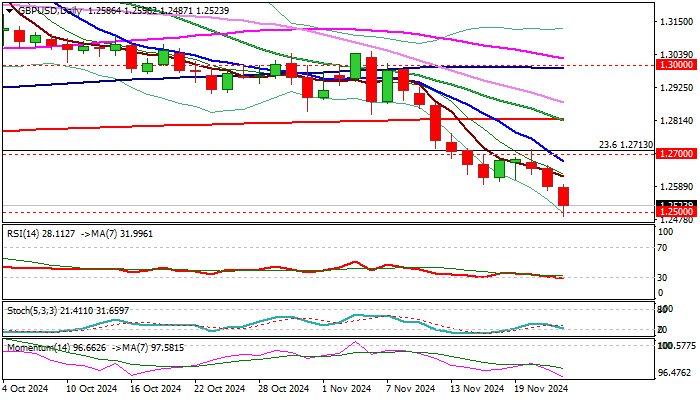
GBP/USD Outlook: Cable Falls to New Multi-Month Low After Disappointing UK Economic Data
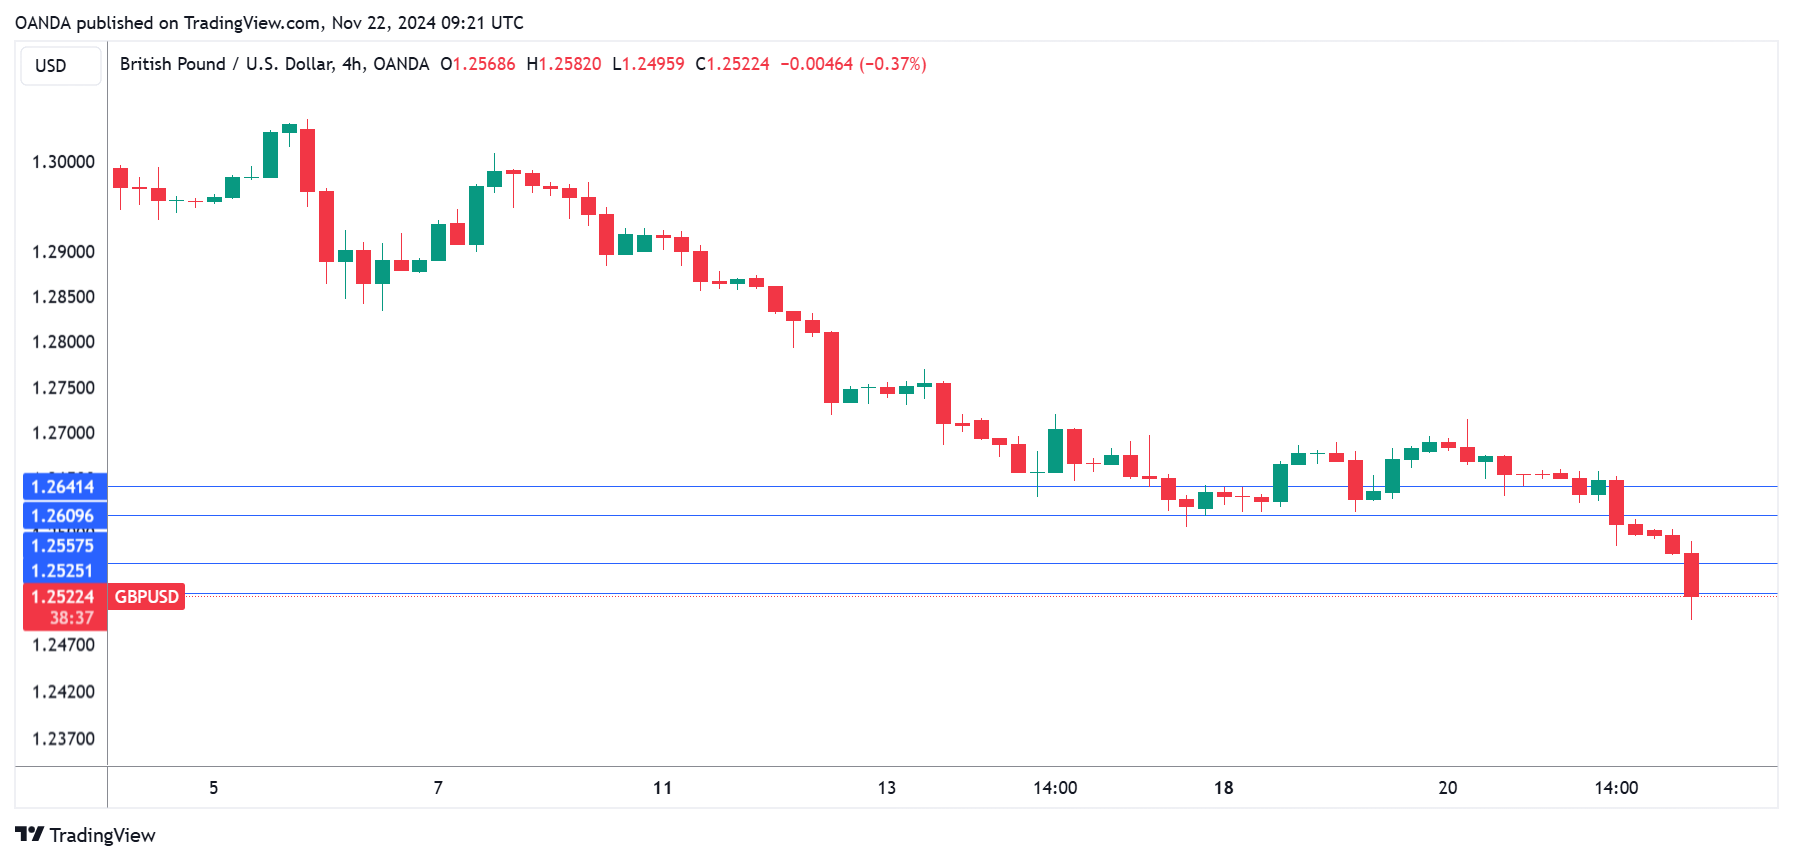
GBPUSD dipped below 1.2500 handle and hit new lowest in 6 ½ months on Friday, after disappointing UK October retail sales and November PMI numbers further weakened sterling, adding to worsened geopolitical picture on threats of stronger escalation of war in Ukraine.
Strengthening dollar on euphoria of Trump trades, as well as increased safe-haven demand on deteriorating geopolitics contributes to negative near-term outlook to the British currency.
Cable is on track for the eighth consecutive weekly loss and also to end the second straight month in red, adding to developing reversal signals on larger timeframes (week / month).
Technical picture remains firmly bearish on daily chart, with strengthening negative momentum (14-d momentum continues to head south, deeply in negative territory) and MA’s in full bearish configuration (formation of 5/200; 10/200 and 20/200DMA’s death crosses).
However, RSI entered oversold territory and may contribute to week-end profit-taking that would provide stronger headwinds to bears and push the price higher.
Initial resistances lay at 1.2600 zone (today’s high / former lows of short consolidation / 100WMA), with upticks to be ideally capped under 1.2700 barrier (falling 10DMA / psychological) and guard upper breakpoint at 1.2818 (200DMA).
Res: 1.2600; 1.2624; 1.2680; 1.2700.
Sup: 1.2487; 1.2445; 1.2400; 1.2299.
Gold Hits New Highs in Euro
Gold returned to growth after nearly three weeks of decline, reversing last week’s drop. The desire for a safe haven for global capital is so strong that it far outweighs the effect of a stronger dollar. The growing tension around the Russia-Ukraine conflict has brought gold back into the focus of investors due to pressure in equity markets.
Since the beginning of the week, the price has gained 5.3%, returning above $2,700. Technically, the price found buyers again shortly after falling below the 50-day moving average, which acts as a significant indicator of the medium-term trend. The ability to rise further would be an important price signal.
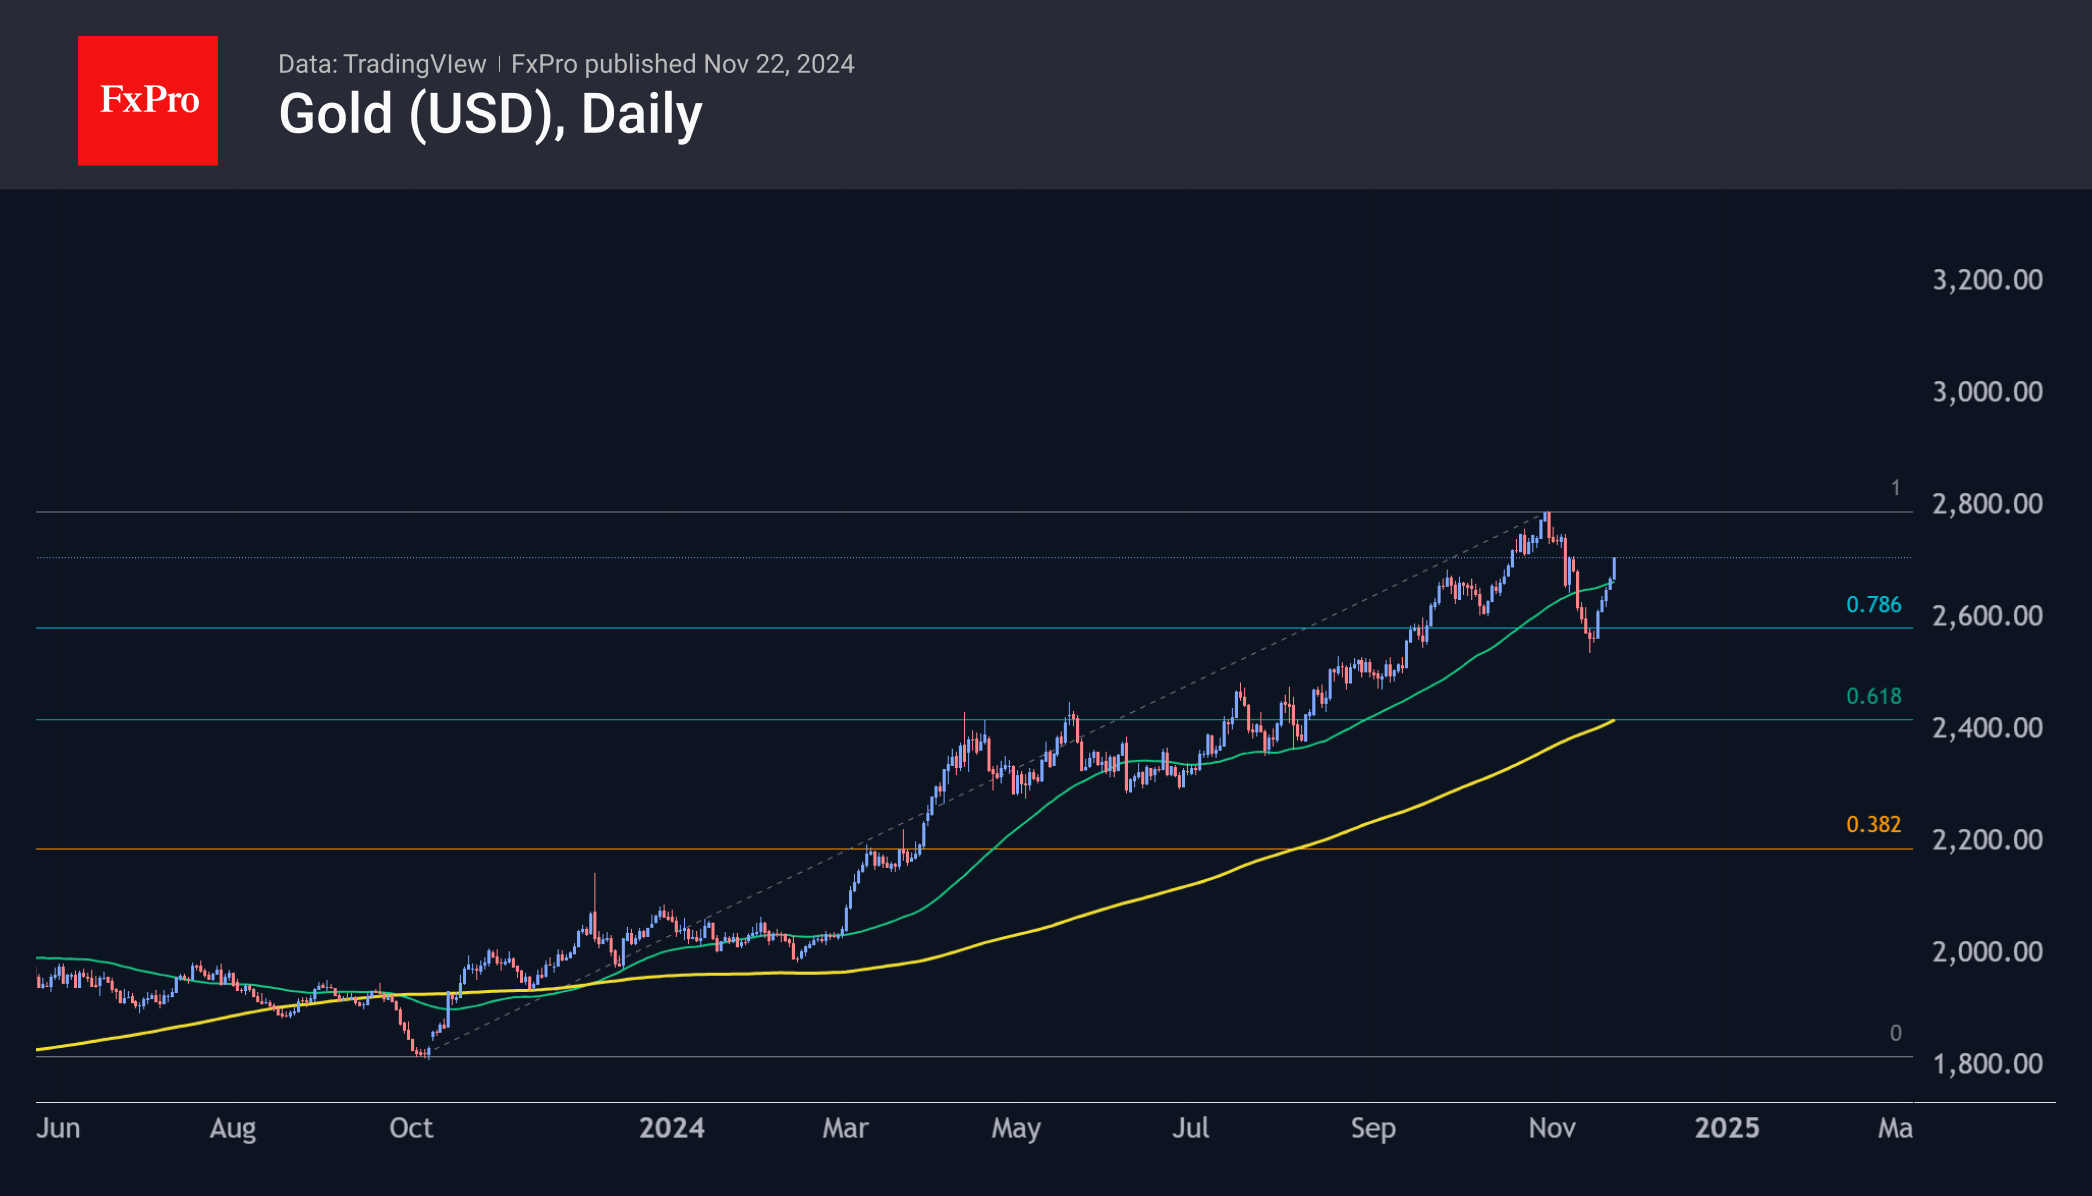
A quick reversal from down to up makes the scenario workable. The decline in early November is a technical correction from October 2023’s rally, which ended with a decline to 76.4% of the total gain. Such shallow corrections are characteristic of strong markets. If gold manages to rewrite the highs soon, the long-term target will be the $3,400 per troy ounce area.
The weakness of the single currency, caused both by geopolitics and the sharp cooling of the economy and political crisis in Germany, is also a serious reason to move into gold.
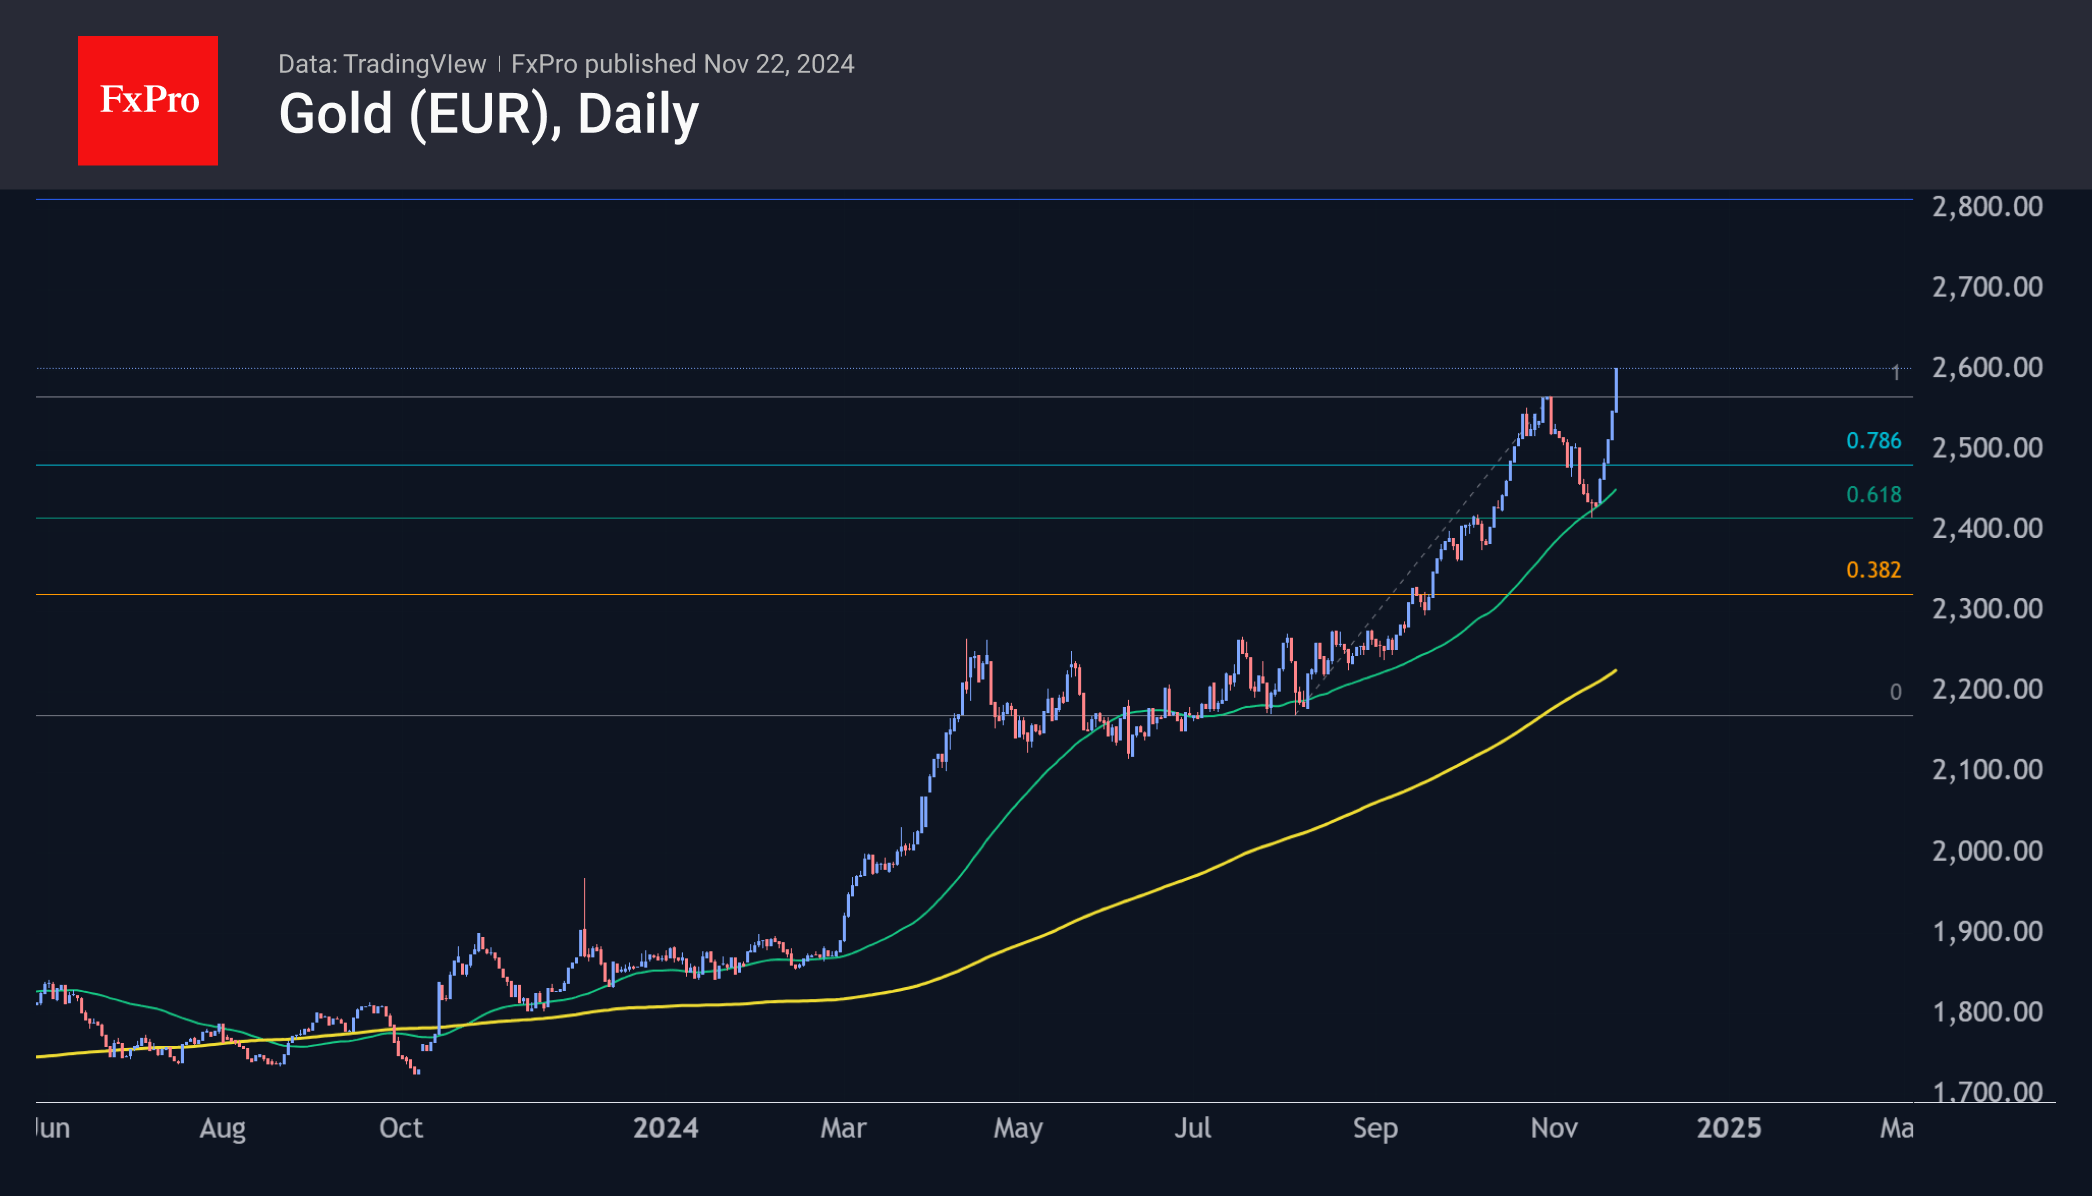
The chart of the gold price in euro paints an even more technically beautiful picture. On Friday, gold surpassed the €2,600 per ounce mark, hitting an all-time high, adding every day this week. The turning point that attracted buyers was the touching of the 50-day moving average towards the end of last week. For more than a year, this curve has provided tactical support: localised selloffs stop there.
The drawdown at the beginning of the month also fits into a classic Fibonacci retracement, with a pullback to 61.8% of the rise from the August lows to the late October highs. Movement within this pattern suggests the next shakeout near €2,840, which could well be a bullish target. At the current exchange rate, this roughly puts the price at $3,000. Given the decline of the single currency, these could be lower levels as well.
EUR/USD Breaks 2023 Low
Today’s PMI figures were released and came in worse than analysts’ expectations. The Flash Manufacturing PMI and Flash Services PMI for both Germany and France fell below the 50.0 threshold, indicating that Europe’s economy is slowing down.
This weakened the euro further and exacerbated the situation on the EUR/USD chart, which has been in a downtrend since early October (as indicated by the red channel):
→ Earlier, support near the 1.0800 level (drawn through the spring-summer lows) was breached.
→ Today, the pair fell below the psychological level of 1.0500 and beneath the 2023 low.
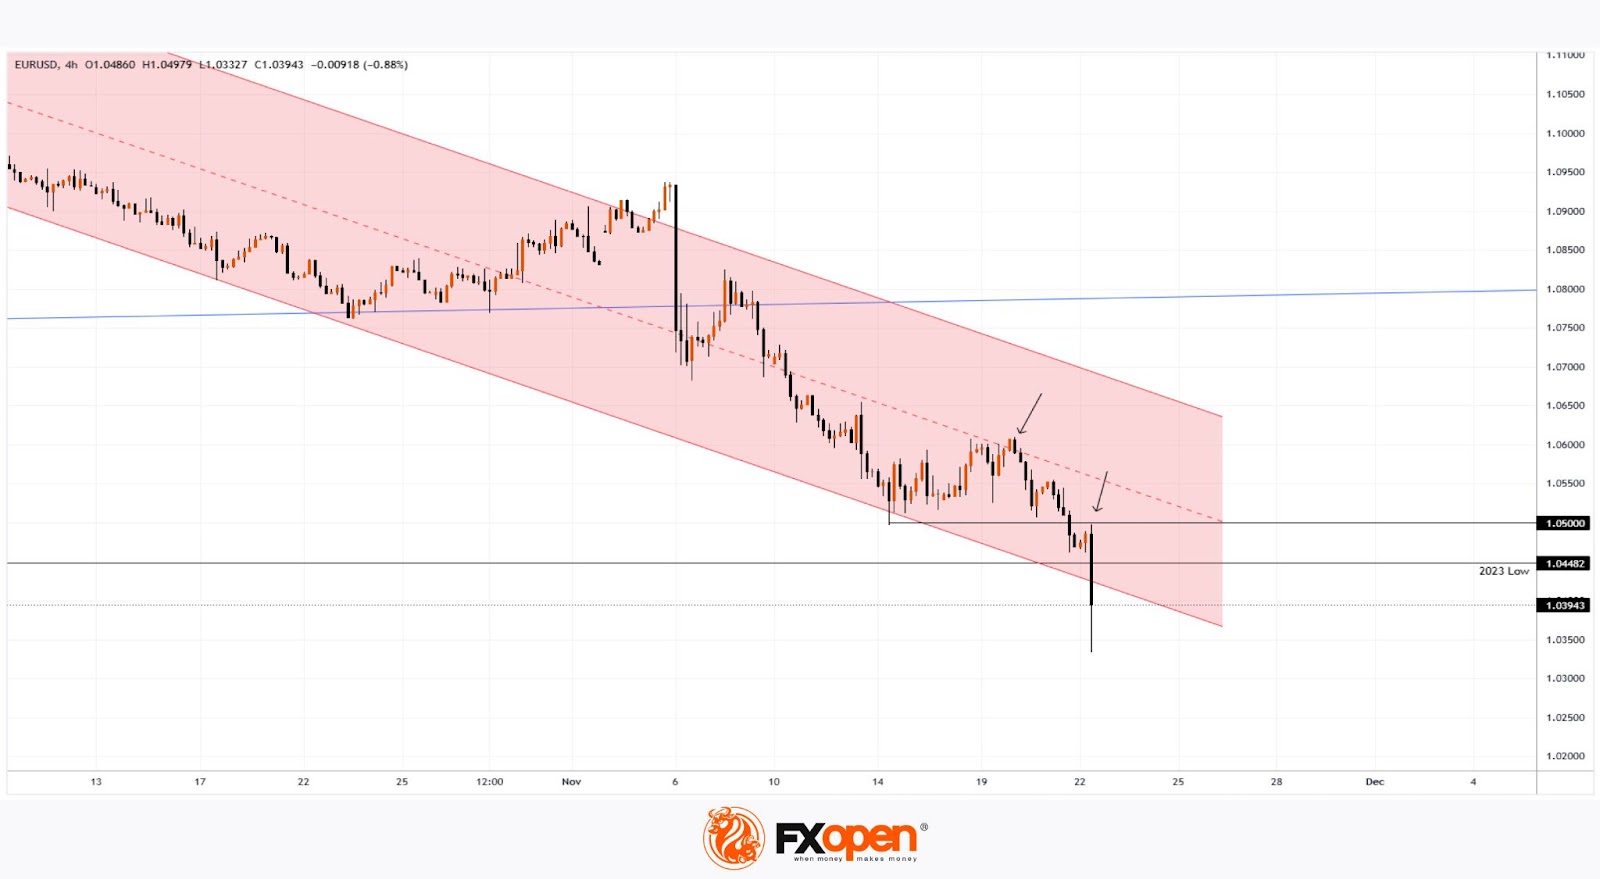
Bears appear to be in control, with EUR/USD trading near the lower boundary of the channel. Arrows on the chart highlight that both the channel median and the 1.0500 level are acting as resistance.
On the other hand, bulls might find hope in the long lower shadow on today’s candle, which could signal emerging demand capable of providing support for the weakened euro.
Trade over 50 forex markets 24 hours a day with FXOpen. Take advantage of low commissions, deep liquidity, and spreads from 0.0 pips. Open your FXOpen account now or learn more about trading forex with FXOpen.
This article represents the opinion of the Companies operating under the FXOpen brand only. It is not to be construed as an offer, solicitation, or recommendation with respect to products and services provided by the Companies operating under the FXOpen brand, nor is it to be considered financial advice.
British Retail Sales Decline, Pound Extends Losses
The British pound is lower for a straight third trading day on Friday. In the North American session, GBP/USD is trading at 1.2543, down 0.36% on the day.
UK retail sales weaker than expected
UK retail sales disappointed in October, with a sharp decline of 0.7% m/m. This follows a downwardly revised 0.1% gain in September and missed than the market estimate of 0.3%. Annually, retail sales rose 2.4%, well below the market estimate of 3.2%. The September reading was revised downwards from 3.9% to 3.2%.
The sharp drop in retail sales can be attributed to low consumer confidence and the recent Budget. The GfK consumer confidence index showed an improvement, rising from -21 to -18, but this points to a very pessimistic British consumer who is thinking twice before making discretionary purchases.
The Reeves Budget on Oct. 31 dampened consumer spending, as the government had warned about “difficult decisions” and proceeded to deliver a Budget with some 40 billion pounds worth of tax increases. Understandably, consumers held back on spending in October and retail sales were down across most categories.
The economy has slowed since the July election and services and manufacturing activity have decelerated for three straight months. The UK releases the Services and Manufacturing PMIs later today. The Services PMI is expected to remain unchanged at 52.0, while the Manufacturing PMI if projected to inch up to 50.0, up from 49.9. If the PMIs are weaker than expected, the pound could respond with losses.
The US will also publish manufacturing and services PMIs on Friday, with little change expected. The Manufacturing PMI is expected to rise from 45.5 to 45.8, and the Services PMI, which has been showing solid growth, from 55 to 55.2.
GBP/USD Technical
- GBP/USD is testing support at 1.2557, followed by support at 1.2525
- There is resistance at 1.2609 and 1.2641
Crypto Market Buzzing in Anticipation of Regulatory Change
Market Picture
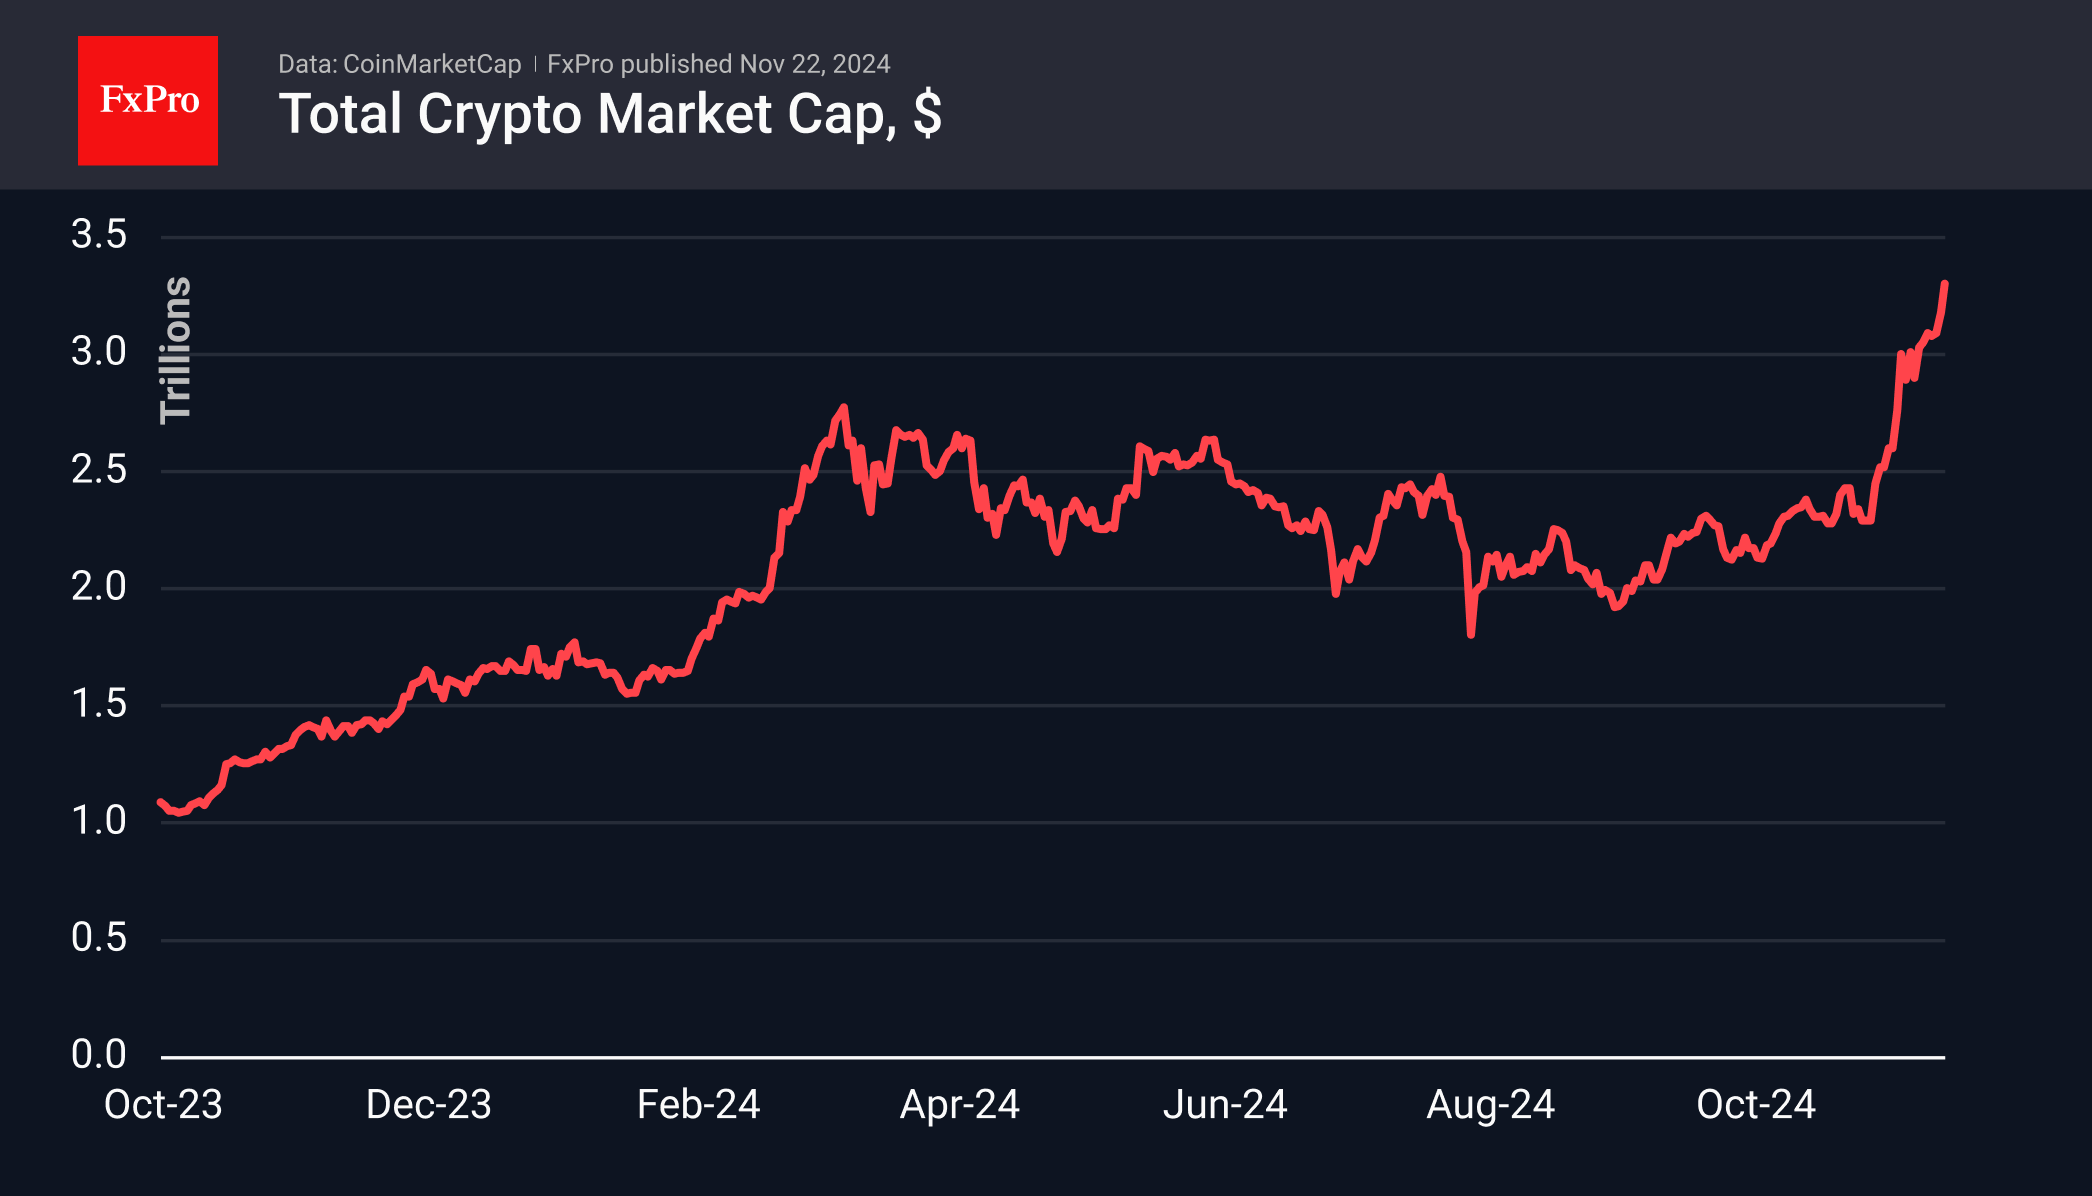
Crypto market capitalisation surpassed $3.3 trillion, up 3.8% in the last 24 hours. Ethereum (+7.4%), Solana (+7.5%), XRP (+24%), and Cardano (+9.6%) provided traction.
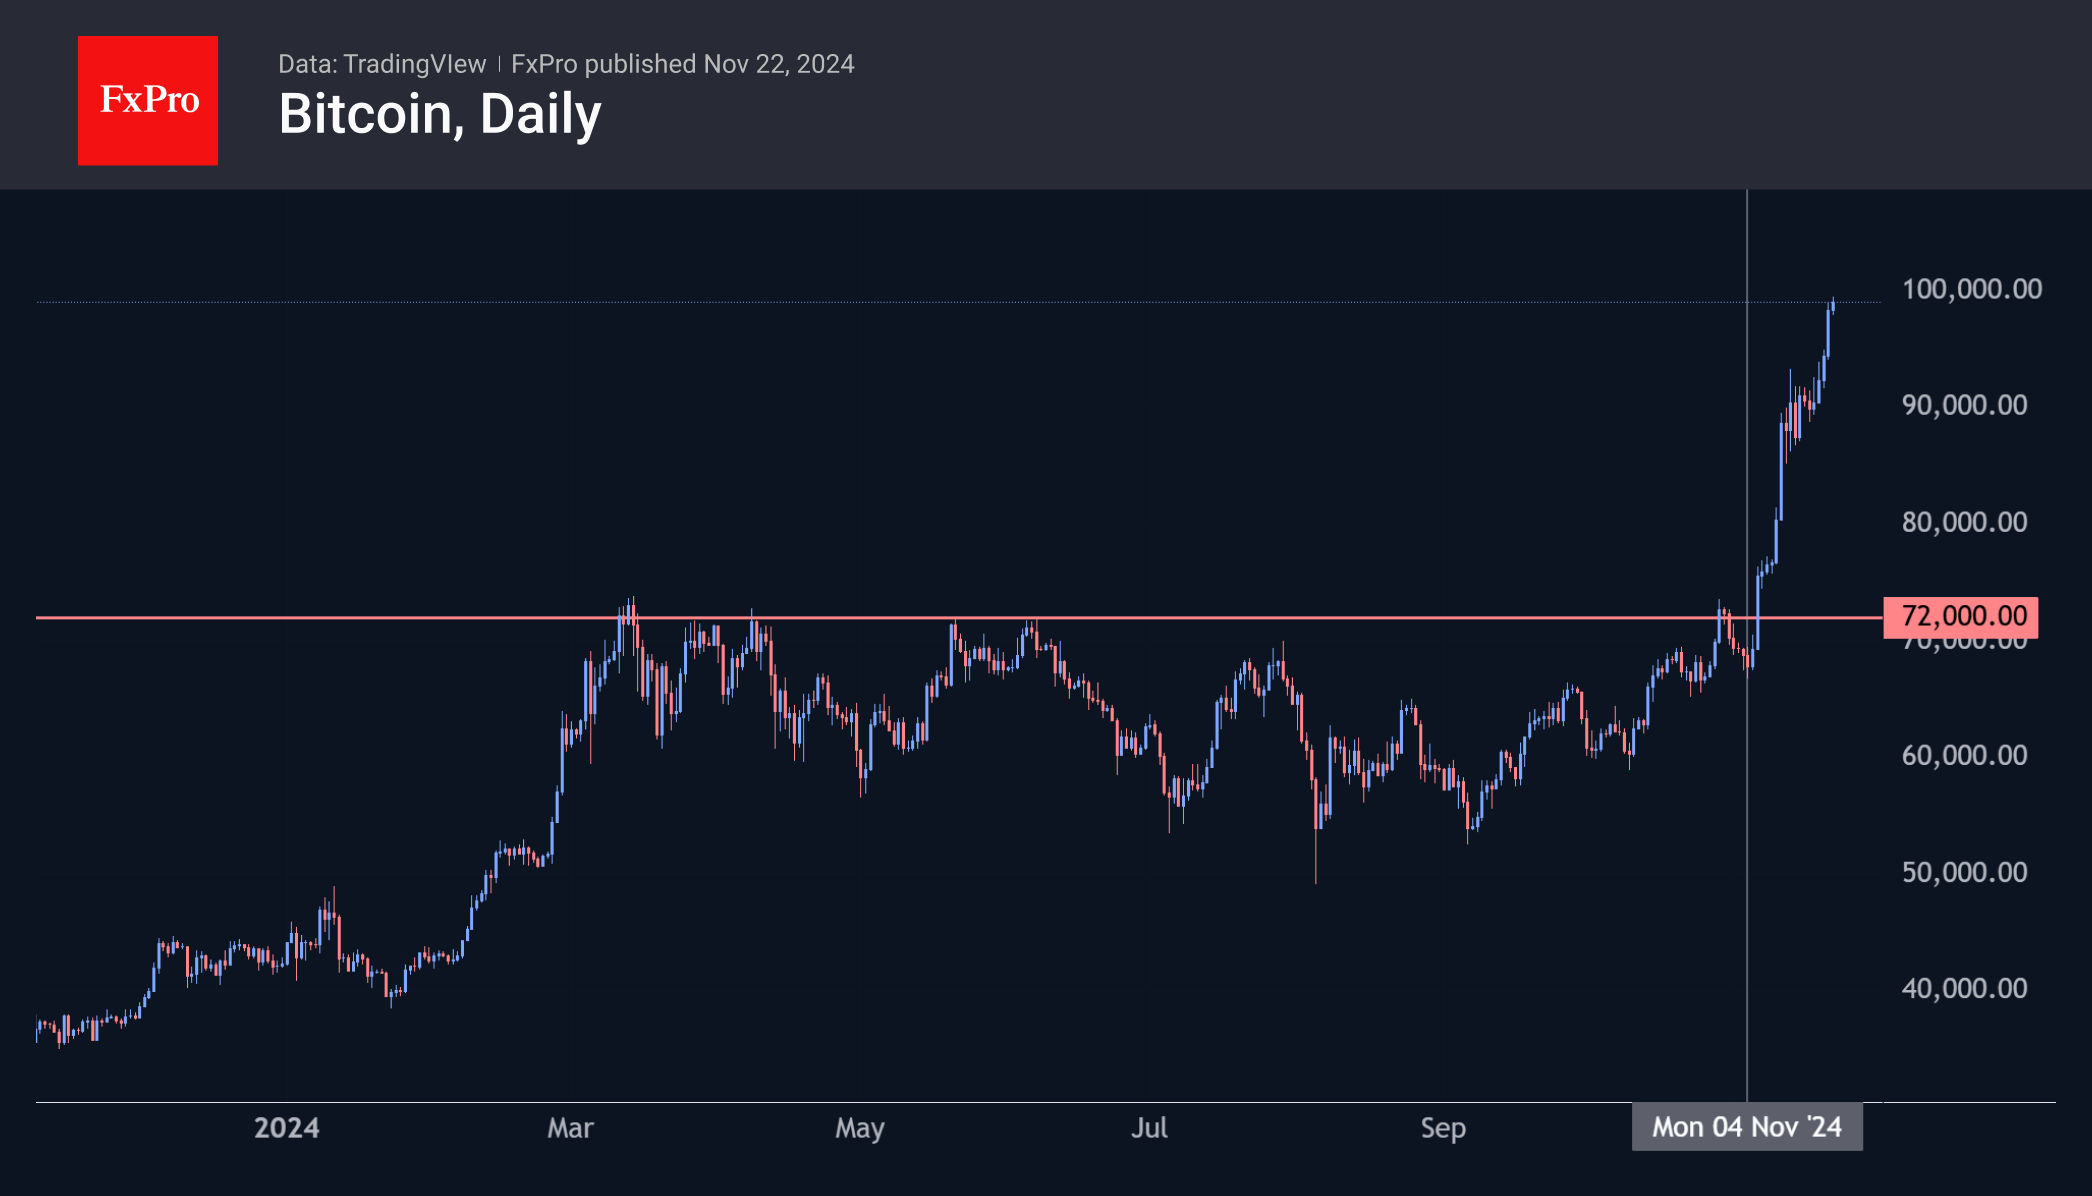
The price of Bitcoin broke through $99K on Friday morning, continuing its steady assault on all-time highs. A strong inflow of capital into spot BTC ETFs is fuelling the systematic uptrend, largely due to institutional clients and speculators. However, since the beginning of November, there have also been several news-driven rallies. The most recent was the resignation of SEC chief Henry Gensler. He had been actively trying to curb the spread of cryptocurrencies throughout the financial industry. Now, traders are betting on a U-turn in crypto policy, not just a more dovish regulation.
Bitcoin is rapidly approaching $100K, at which point we should expect a major shakeout at a major milestone, but we still see the end of this momentum around $110K.
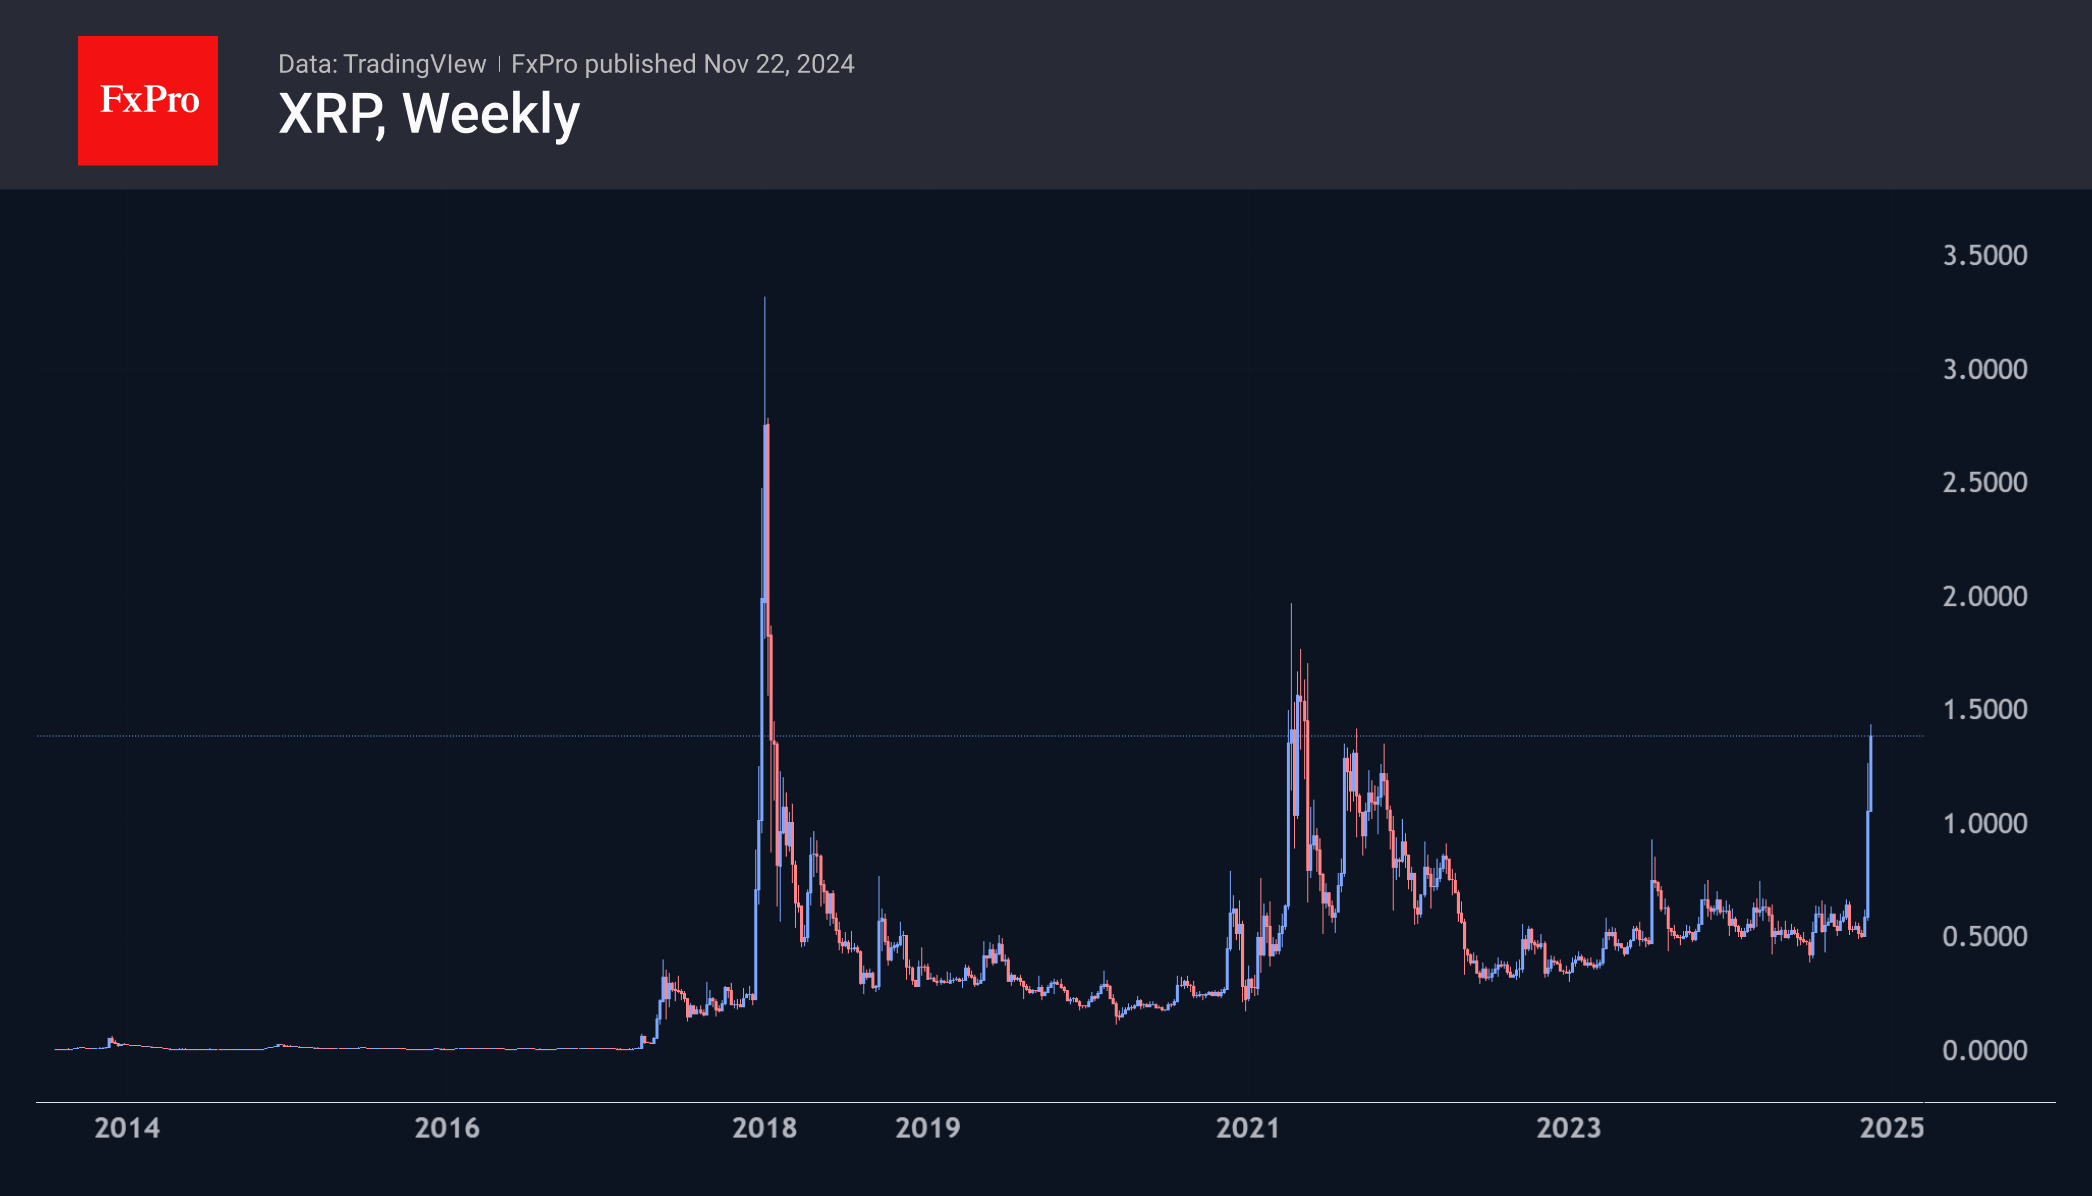
XRP rose by almost a quarter in less than 24 hours on the news of the SEC chief’s departure. The price peaked at $1.43 early on Friday before pulling back to $1.37. This was the area of the 2021 highs when there was also a spike in hopes of a court victory against the SEC. The all-time high of 3.84 was set in early 2018, during the first altcoin mania.
News Background
According to Bloomberg, Trump and his transition team are discussing the possibility of creating a White House staff position focused on cryptocurrencies with industry leaders. The official is expected to play a liaison role between Congress, the White House, as well as the SEC and CFTC.
The Foundation for Research on Equal Opportunity questioned the possibility of solving the US national debt problem with a Bitcoin reserve. The initiative, which has been submitted to Congress for consideration, involves purchasing 1 million BTCs for five years at the expense of the Fed’s gold reserves.
Since the beginning of the year, MicroStrategy’s shares have risen 650%, outperforming bitcoin’s growth by a factor of five. The company’s market capitalisation has exceeded $96 billion. Previously, the company’s founder, Michael Saylor, announced his intention to turn MicroStrategy into a bitcoin bank with a capitalisation of $1 trillion.
UK PMI composite fall to 49.9, slips into contraction as post-budget sentiment worsens
UK economic activity weakened in November, with the Composite PMI falling from 51.8 to 49.9, its first contraction in 13 months. Manufacturing PMI declined to a 9-month low of 48.6, down from 49.9, while Services PMI hit a 13-month low at 50.0, down from 52.0.
Chris Williamson of S&P Global Market Intelligence noted that businesses are reporting falling output and employment cuts for the second consecutive month. Post-budget sentiment has deteriorated sharply, with optimism now at its lowest since late 2022. Companies have expressed significant concern over the announced increase in employers' National Insurance contributions.
The November data suggest the economy is contracting modestly, with GDP estimated to decline at a quarterly rate of -0.1%. Williamson warned of the potential for further job losses unless sentiment improves.
On the inflation front, selling price growth slowed to its lowest post-pandemic rate, but elevated wage pressures in services remain a challenge, likely tempering the case for aggressive rate cuts by BoE.
USD/JPY Awaits Potential Stimulus Impact
The USD/JPY pair remains stable at approximately 154.30 amid global economic fluctuations and expectations of potential Japanese stimulus measures.
Japan's latest inflation data for October revealed a decline to 2.3%, marking the lowest level in nine months and potentially easing pressure on the Bank of Japan (BoJ) for immediate rate hikes. However, BoJ Governor Kazuo Ueda has hinted at a possible rate increase in December due to the yen's prolonged weakness.
Japan's manufacturing sector contracted more than anticipated in November, while the service sector showed expansion, highlighting a mixed economic outlook.
Reports suggest the Japanese government may introduce a significant stimulus package worth 90 billion USD to mitigate the impact of inflation on households. While details remain undisclosed, the possibility of such measures has generated some optimism around the yen.
Technical analysis of USD/JPY
H4 Chart: the USD/JPY is forming a consolidation pattern around 154.45. A downward breakout could lead to further movement towards 153.00, while an upward breakout might pave the way to 156.20, potentially extending to 157.60. The MACD indicator supports this outlook, with its signal line positioned above zero but trending downwards, suggesting the USD/JPY pair is approaching a critical decision point.
H1 Chart: a consolidation around 154.45, potentially extending to 154.88, sets the stage for possible corrective movements towards 153.00. A subsequent recovery could push the pair to 156.20, marking a new growth phase. The Stochastic oscillator, currently above 80, indicates overbought conditions, signalling a likely retraction to lower levels, aligning with the potential for a near-term correction.
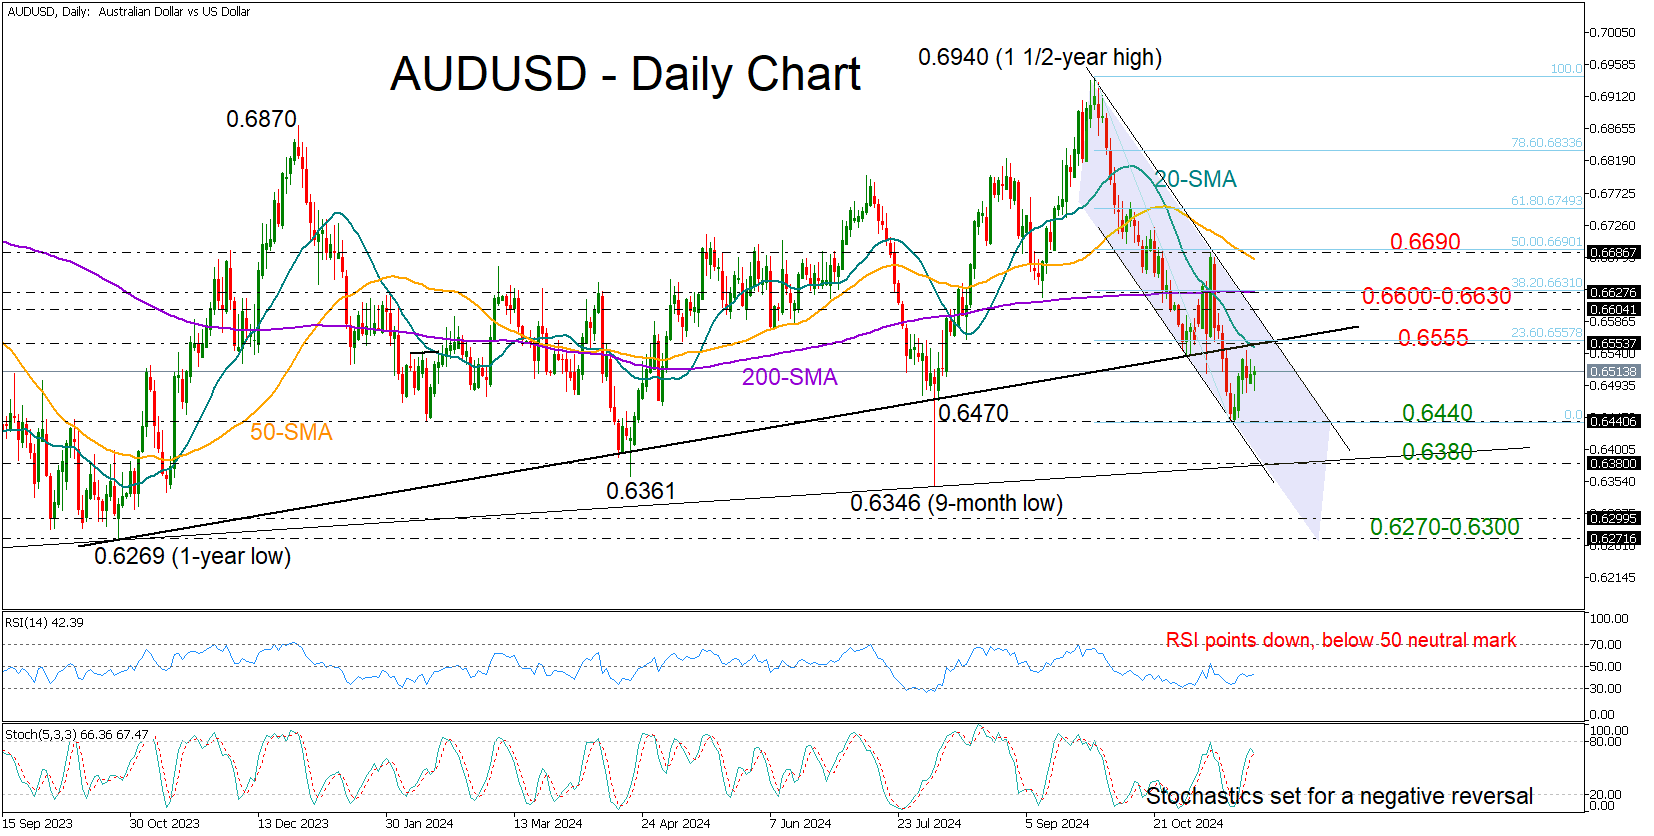
AUDUSD Rangebound in Quiet Trading
- AUDUSD holds steady within 0.6500 zone
- Technical picture remains gloomy below 0.6630
AUDUSD has largely ignored the swings in the US dollar this week, staying relatively stable within the 0.6500 area and slightly above its recent three-month low of 0.6439.
There is not much evidence of strong buying appetite at the moment as the RSI is pointing down in the bearish area below 50 and the stochastic oscillator is set for a negative reversal. Moreover, the short-term trend is clearly developing within a bearish channel and below the simple moving averages (SMAs), reflecting downbeat sentiment.
A move above the 20-day SMA and the former support trendline at 0.6555 could find immediate resistance at the upper band of the channel and the 38.2% Fibonacci retracement of the ongoing bearish trend, which also lines up with the flattening 200-day SMA. Even higher, the bulls may attempt to violate the negative trend above the previous high and the 50% Fibonacci of 0.6690.
Should sellers breach the 0.6440 base, the decline could stretch toward the critical support trendline which connects the lows from 2022 to 2024 seen at 0.6380. A close lower could spark an aggressive downfall toward the 0.6270-0.6300 base. If the bears claim that floor too, the focus will turn to the 2022 bottom of 0.6169.
In brief, AUDUSD is not in great shape despite staying resilient above its recent lows. A rebound above 0.6630 could help avoid a bearish continuation, whilst a break below 0.6380 could signal further downside in the long-term picture.