Sample Category Title
ECB’s Villeroy: Wage data backward-looking, advocates agile pragmatism
French ECB Governing Council member François Villeroy de Galhau, speaking at a conference today, emphasized a cautious and pragmatic stance on monetary policy, downplaying the significance of recent stronger-than-expected wage data.
He described the Q3 surge in negotiated wages as a “backward-looking” indicator, primarily reflecting the “lagged effects” of earlier negotiations in Germany, which were already factored into the ECB’s September projections.
Villeroy highlighted a shift in risks, stating that the balance for both growth and inflation now tilts to the downside. He also noted that potential US tariffs are "not expected to alter significantly the inflation outlook in Europe".
Against this backdrop, Villeroy reaffirmed the ECB's commitment to "continue to reduce the degree of monetary policy restriction," while underscoring that the pace must be guided by "agile pragmatism" and "full optionality" in future decisions.
BoJ’s Ueda: FX impact on economy and prices taken ‘seriously’ in policy decisions
At a forum today, BoJ Governor Kazuo Ueda admitted that the central bank takes exchange rate movements "seriously" when forming its economic and inflation outlook. He also stressed the importance of understanding the factors driving current exchange rate changes and their broader implications.
On monetary policy, Ueda reiterated that decisions would be made "meeting by meeting," based on the most up-to-date information. With a month remaining until December meeting, Ueda noted that additional data would provide greater clarity for the central bank’s deliberations.
Commenting on potential impacts from the policies of US President-elect Donald Trump, Ueda admitted that it was too hard to predict. He affirmed that "as soon as the new administration announces new set of policies, we would like to incorporate into our economic outlook."
US Money Markets Now Put Probability of 25 bps Fed Rate Cut in December at Only 50%
Markets
Geopolitical developments keep hijacking headlines. Risk sentiment improved at the start of yesterday’s trading session on talk that Russian president Putin would be open to talks on a ceasefire deal in Ukraine with the US. The optimism quickly evaporated after the Biden administration decided to give Ukraine antipersonnel mines and after Ukraine deployed first long-term missiles from the UK (Storm Shadow) days after first such arms from the US (ATACMS). Key European equity benchmarks closed up to 0.50% lower. US stocks treaded water going into Nvidia earnings which brought a tepid reaction. While still beating consensus, they didn’t top highest estimates triggering some pullback in the share in after-trading after the recent run-up. Eco data included higher-than-expected October UK CPI figures and record high EMU wage growth (Q3: +5.4% Y/Y) which failed to really leave a (negative) mark on bond trading. Daily changes on the German curve were limited to +- 1bp. UK yields were unchanged apart from an underperformance of the (very) long end of the curve: 10y +2.7bps, 30y +5.2 bps). The US yield curve bear flattened with increases between +1.6 bps (30-yr) and +3.4 bps (2-yr) following some hawkish Fed comments. EUR/USD oscillates between 1.05 and 1.06. US money markets now put the probability of a 25 bps Fed rate cut in December at only 50%. The latest repositioning started last week after Fed Chair Powell said that the economy is not sending any signals that de Fed needs to be in a hurry to lower rates. Boston Fed Collins yesterday suggested that some additional policy easing is needed as policy currently remains at least somewhat restrictive but that the final destination is uncertain. Policy makers should proceed carefully though. “The policy adjustments made so far enable the FOMC to be careful and deliberate going forward, taking the time to holistically assess implications of the available data for the outlook and the associated balance of risks” Washington-based Fed governor Bowman – who dissented in September in favour of a smaller 25 bps rate cut - sounded equally cautious, citing risks of prematurely fueling demand and reigniting inflationary pressures. Interestingly, she says that we may be closer to a neutral policy stance than we currently think. Fed governor Cook also didn’t want to frontrun the outcome of the December meeting, hinting that she is ready to respond to a changing outlook. NY Fed Williams was more neutral. His 2025 outlook is one of still solid growth (2.5%), a sideways moving labour market (4%-4.25% unemployment rate) and a continuation of the disinflation process (2.25% for the full year). In this context, he argues that it is appropriate to bring the Fed funds rate down closer to more normal or neutral levels. Today’s eco agenda again fails to inspire, leaving space for more choppy consolidation trading in the run-up to tomorrow’s PMI surveys.
News & Views
Japan’s public broadcaster NHK said the government is considering a new stimulus package worth JPY 13.9tn, or about $90bn, aimed at mitigating the impact of rising prices on households. The package would also contain around JPY 8tn for government investment and lending as well as local government spending, raising the total size to JPY 21.9tn to top last year’s JPY 21.8tn fiscal booster. Japan’s ruling coalition yesterday agreed with a key opposition party on the draft of the package. While these kind of supplementary budgets are not unusual in Japan, their size seem to be ever-increasing. They are also largely debt-funded. The IMF earlier this month warned Japan to fund additional spending plans within its budget rather than issue debt. It urged Japan to get its fiscal house in order as the central bank began raising interest rates. The Japanese yen this morning oscillates around USD/JPY 155.
Advisers to the Chinese government are recommending the country to stick to a 5% growth target for 2025, Reuters reported. Such growth ambitions match those for this year, which already prove difficult to reach. The advisers push for stronger fiscal stimulus to offset the impact of potential US tariff hikes on Chinese exports. One of them said the budget deficit should “definitely exceed” this year’s planned 3% level of GDP. Another was more conservative, calling solely relying on fiscal stimulus not sustainable in the long run if China does not go ahead with much-needed reforms to address structural imbalances. The advisers will submit their proposals to next month’s annual Central Economic Work Conference, where leaders discuss policies and goals for next year. The growth target will be officially announced at an annual parliament meeting in March.
The Beginning of the Worries
Nvidia announced another very strong quarter after the bell. The company surpassed its own revenue forecast by around $2bn (again!) and printed a sales number of $35.1bn. That’s around $5bn more than last quarter’s number and almost the double of the amount earned during the same period a year ago. The company printed a total profit of an eye-watering $19.3bn – that’s also around $2bn more than pencilled in by analysts. And it made a revenue forecast of $37.5bn for the current quarter. That’s $2bn more than the actual revenue – as it has been the case for the past few quarters – but only slightly above the consensus of $37bn.
To me, being lower than the most optimistic of the Wall Street forecasts is not a concern, bit there are two flags that are emerging right now.
- The company’s gross margin slightly fell last quarter from 75% to 74.6%. This number is still around 20 percentage points above AMD’s profit margin and more than double Intel’s BUT the switch to the now-famous Blackwell chip - and the manufacturing challenges, there – has been costlier than thought and took a toll on the profit margin. And Nvidia expects its gross margin to dip to 73% before rebounding back to mid-70s as it reaches large-scale production.
- Happily, demand for Blackwell chips is expected to exceed supply for a few more quarters but the composition of Nvidia’s customer book worries. Big Tech companies make up to 50% of revenues – up from 45% a quarter earlier. And these companies will be done buying chips at large-scale at some point. And come that day, Nvidia must find new clients. The problem is that companies other than Big Tech certainly don’t have the same means to make Nvidia’s bread and butter when competition proposes more affordable AI chips. Hence, competition and market share will become a challenge.
Nvidia fell 2.5% in the afterhours trading. Failure to break a record post-earnings, and the rising worries regarding margins and competition could lead to a certain profit taking over the next few sessions. The 100-DMA – near $125 per share – should provide the first important support to a potential pullback. We expect dip buying opportunities to emerge into $117pb – the minor 23.6% Fibonacci retracement on the AI rally.
But one thing is clear, yesterday’s announcement sounded like the next few quarters won’t be as fun as the last few ones.
As such, the S&P 500 and Nasdaq futures are in the red this morning, and we could see a deeper retracement from the ATH levels with the lack of support from Nvidia earnings.
Elsewhere, the US 20-year note sales saw a tepid demand, and Federal Reserve’s (Fed) Michelle Bowman called for caution on further rate cuts citing at slower progress in reducing inflation. The US 2-year yield rebounded yesterday, as the 10-year yield steadied near 4.40% level. Activity on Fed funds futures points at a near 50-50 chance for the December rate cut right now, and that hawkish shift in Fed expectations continues to give support to the US Dollar new a year-high levels.
This being said, the major counterparts also see some hawkish shift to their own expectations, and the latter slows the US dollar purchases. The UK, for example, printed a higher-than-expected set of inflation figures yesterday morning. Headline inflation in the UK jumped to 2.3% and core inflation to 3.3%. The jump in numbers was expected for October amid a 10% rise in the British energy price cap, but the higher-than-expected figures tamed the dovish Bank of England (BoE) expectations. And because things are expected to get worse before they get better with Donald Trump’s tariff plans and the expansionary fiscal policy from the British government, the first rate cut from the BoE is fully priced in for March, and a second for August. That hawkishness gave an energy shot to the GBP bulls yesterday, although most of the gains were given back rapidly on Fed hawkishness. Moving forward, a smaller divergence between the Fed and the BoE outlook should help throw a floor under Cable near the current levels and encourage recovery in the coming weeks.
Across the Channel, news weren’t encouraging for the European Central Bank (ECB) doves, either. Wages in the Eurozone jumped by 5.4% from a year ago, the most since the single currency exists. Germany is to blame. Wages, there, jumped by 8.8% in Q3 from a year earlier. The jump in wages growth will complicate the ECB’s plans to cut rates at the desired speed. Consequently, the retreat in dovish ECB expectations could slow down the euro selloff, and levels near $1.05 could serve as a dip to shoulder a rebound toward the 1.07-1.08 range.
Euro Area Consumer Confidence Out Today
In focus today
Today, in the euro area we receive data on consumer confidence for November. We have seen a strong upward trend the past year, which bodes well for consumption next year if it continues.
In Sweden, we have a speech by Riksbank vice governor Per Jansson at 14:45 about the economic situation. According to the Minutes, Jansson cited a slower-than-anticipated economic recovery as his reason for supporting a 50bp rate cut. He concluded that overall inflation risk is trending downward, although he balanced that by highlighting two upside risks: the krona and food prices, which in the worst case could delay rate cuts or even justify hikes.
In the US, we receive initial jobless claims and the Philly Fed Business index for November, which measures growth in the manufacturing sector, where consensus suggests 8.0.
Several central bank speeches from both ECB and Federal Reserve again today including Knot, Holzman and Lane, where the market will look for clues on monetary policy ahead of December announcements.
Overnight, the Japanese Statistics Bureau publishes inflation data for October. Tokyo data indicates, inflation declined further, but price momentum rhymed with 2% annual inflation. Consensus sees 2.2% with September inflation of 2.4%. This will be the last nationwide print ahead of the December BoJ meeting.
Economic and market news
What happened overnight
In the US, Yesterday's auction of USD 16bn in the 20Y was very weak with a very high tail and low demand from direct bidders. However, the 20Y segment on the US Treasury curve usually attracts low demand as it is a new segment on the yield curve (was introduced in 2020) similar to what we see on the German curve, where the 15Y-20Y segment also attracts low demand and have to offer an extra premium to investors. Hence, it should not have significant impact on the long end of the Treasury curve.
What happened yesterday
In the euro area, negotiated wage growth increased to 5.4% y/y in Q3 from 3.5% in Q2, influenced by seasonal factors such as bonuses and recent increase in German special payments. Despite this volatility, average negotiated wages have now increased 4.6% y/y, up from 4.4% y/y in 2023, indicating persistently strong wage trends. This sustained wage growth is expected to continue influencing services inflation. However, the ECB's focus has shifted from inflation concerns to growth, lessening the impact of the data on future policy rate decisions.
In the UK, October's inflation figures surpassed expectations with headline CPI at 2.3% y/y (cons: 2.2%, prior: 1.7%), and core CPI at 3.3% y/y (cons: 3.1%, prior: 3.2%). The rise in the headline is primarily due to quarterly adjustments in household energy bills. Given this, we therefore caution reading too much into this print given the significant impact of energy costs.
Equities: Global equities were marginally lower yesterday, and it was definitely not the Trump trades outperforming. Health care is finally showing some defensive characteristics after having faced several challenging weeks following the elections. Materials also outperformed on a negative day, a sector which has also been challenged over the last couple of weeks but that's more related to disappointing Chinese stimulus. European stocks once again started the day in the green before ending in the red. This illustrates quite well the investor scepticism, fear, and uncertainty related to geopolitics, German politics, struggling manufacturing sectors, and challenging structural outlooks related to Europe. What seems to be missing is the belief in potential upside surprises in Europe, despite economic surprises currently being positive for the region. In the US yesterday, Dow +0.3%, S&P 500 +0.00%, Nasdaq -0.1%, and Russell 2000 +0.03%. Asian markets are mixed this morning, with South Korea standing out once again, this morning on the positive side. European futures are higher - let's see if the strength can continue throughout the cash session. US futures are slightly lower but without a massive impact following the Nvidia earnings in the after-hours yesterday.
FI: Geopolitics continued to add downward pressure on global rates through yesterday's session. The EUR swap curve rose modestly across tenors during the first part of the session, but the move faded quickly as news of another Ukrainian attack on Russian soil reached the wire. The EUR swap curve ended the day marginally higher across tenors, while the Bund ASW-spread move slightly higher to 2-week high of 2.5bp.
FX: USD and CAD gained the most yesterday and NOK and SEK lost out on another relatively quiet day for the FX market. EUR/USD traded in the 1.05-1.06 range, EUR/SEK rose above 11.60 and EUR/NOK climbed towards 11.70.
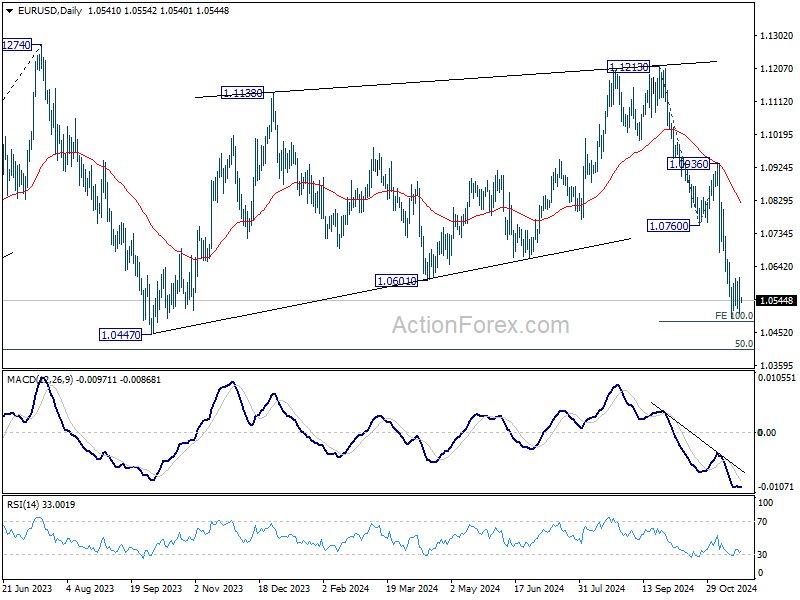
EUR/USD Daily Outlook
Daily Pivots: (S1) 1.0497; (P) 1.0554; (R1) 1.0600; More...
Intraday bias in EUR/USD remains neutral as consolidation from 1.0495 is extending. Outlook stays bearish with 1.0760 support turned resistance intact. On the downside, firm break of 1.0495 will resume the fall from 1.1213 to 1.0447 support and then 1.0404 key fibonacci level next.
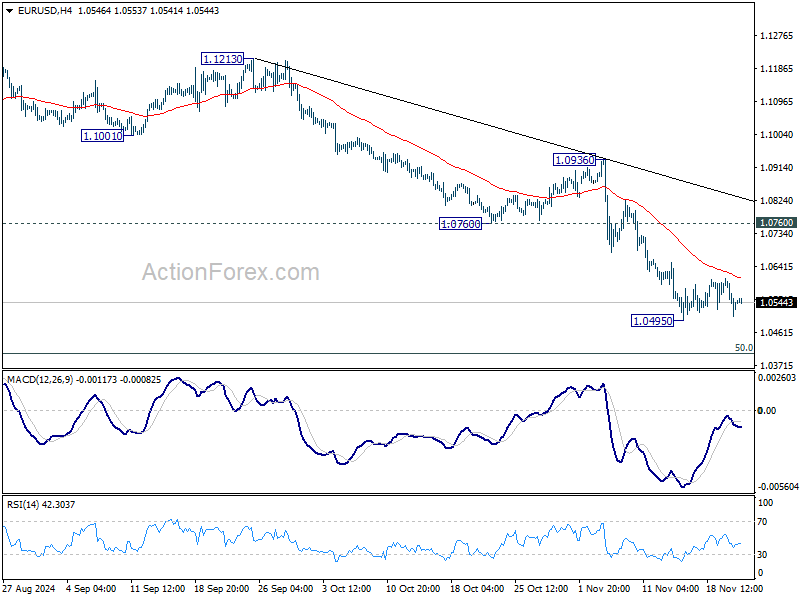
In the bigger picture, price actions from 1.1274 (2023 high) are seen as a consolidation pattern to up trend from 0.9534 (2022 low), with fall from 1.1213 as the third leg. Downside should be contained by 50% retracement of 0.9534 (2022 low) to 1.1274 at 1.0404, to bring up trend resumption at a later stage. However, firm break of 1.0404 will raise the chance of reversal and target 61.8% retracement at 1.0199.
USD/JPY Daily Outlook
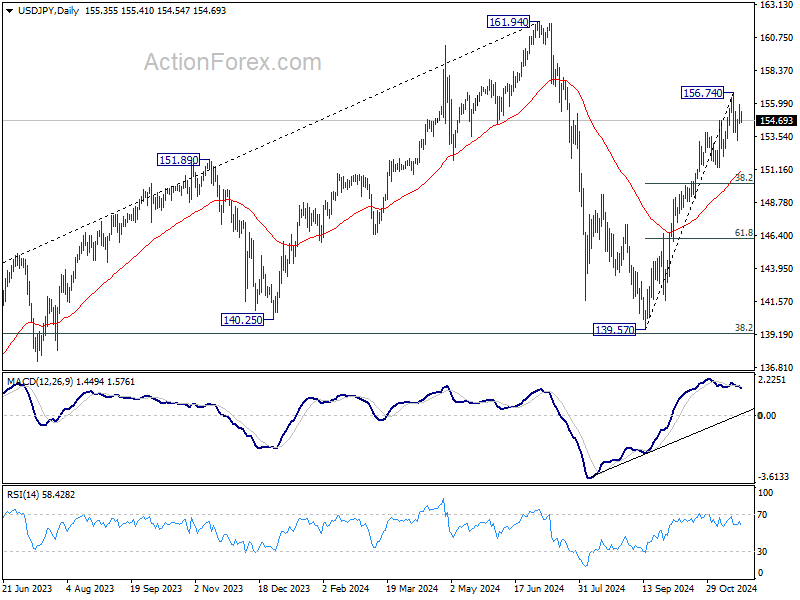
Daily Pivots: (S1) 154.68; (P) 155.28; (R1) 156.04; More...
Intraday bias in USD/JPY is turned neutral again with current retreat. On the upside, break of 156.74 will resume the whole rally from 139.57 towards 161.94 high. On the downside, though, break of 153.27 will resume the correction towards 38.2% retracement of 139.57 to 156.74 at 150.18.
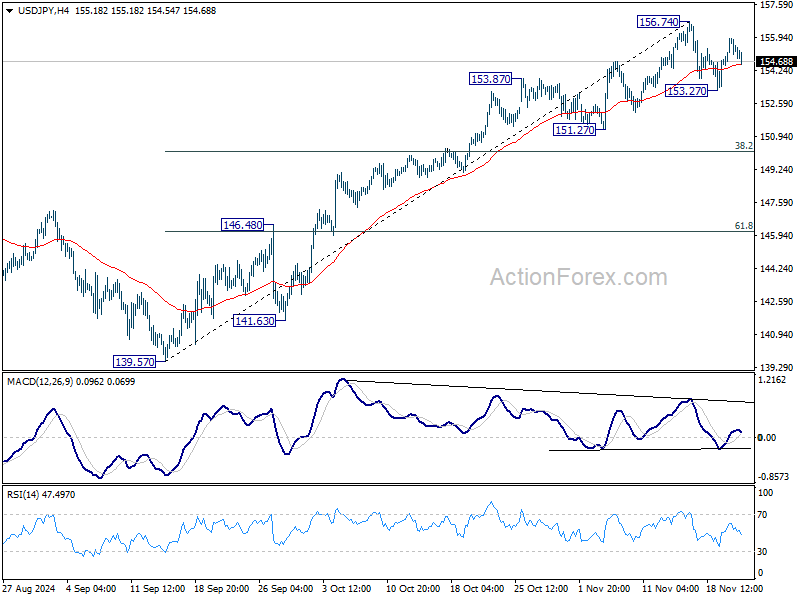
In the bigger picture, price actions from 161.94 are seen as a corrective pattern to rise from 102.58 (2021 low). The range of medium term consolidation should be set between 38.2% retracement of 102.58 to 161.94 at 139.26 and 161.94. Nevertheless, sustained break of 139.26 would open up deeper medium term decline to 61.8% retracement at 125.25.
GBP/USD Daily Outlook
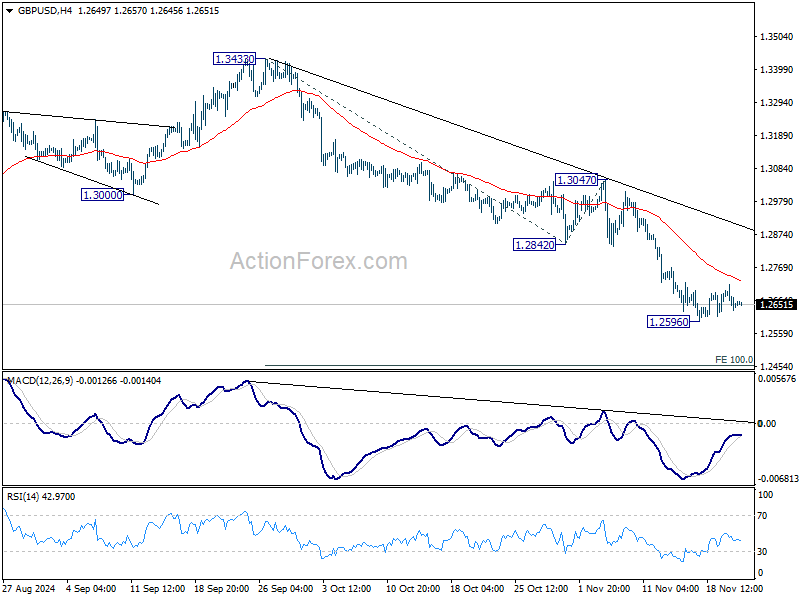
Daily Pivots: (S1) 1.2618; (P) 1.2666; (R1) 1.2702; More...
GBP/USD is staying in consolidation above 1.2596 temporary low and intraday bias remains neutral. Outlook stays bearish with 1.2842 support turned resistance intact. On the downside, break of 1.2596 will resume the fall from 1.3433 to 100% projection of 1.3433 to 1.2842 to 1.3047 at 1.2456.
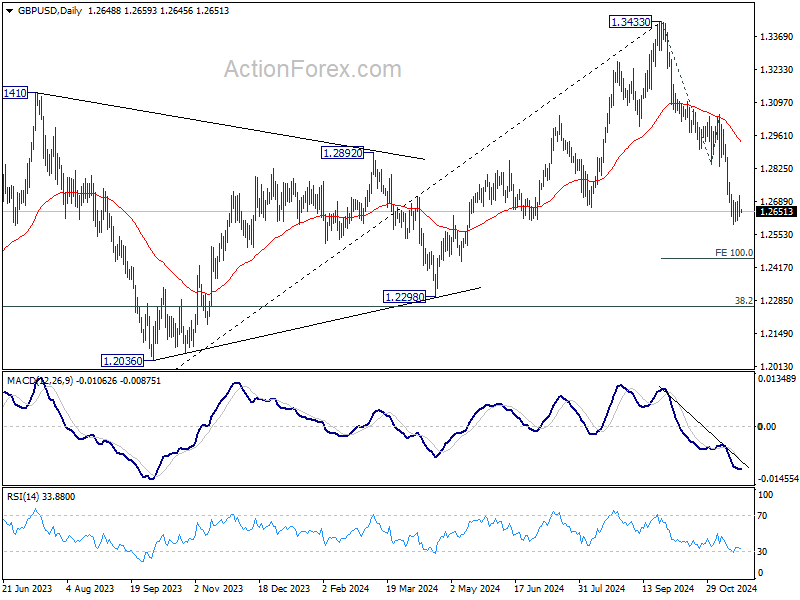
In the bigger picture, a medium term top should be in place at 1.3433, and price actions from there are correcting whole up trend from 1.0351 (2022 low). Deeper decline is now expected as long as 55 D EMA (now at 1.2977) holds, to 38.2% retracement of 1.0351 to 1.3433 at 1.2256, which is close to 1.2298 structural support. Strong support should be seen there to bring rebound.
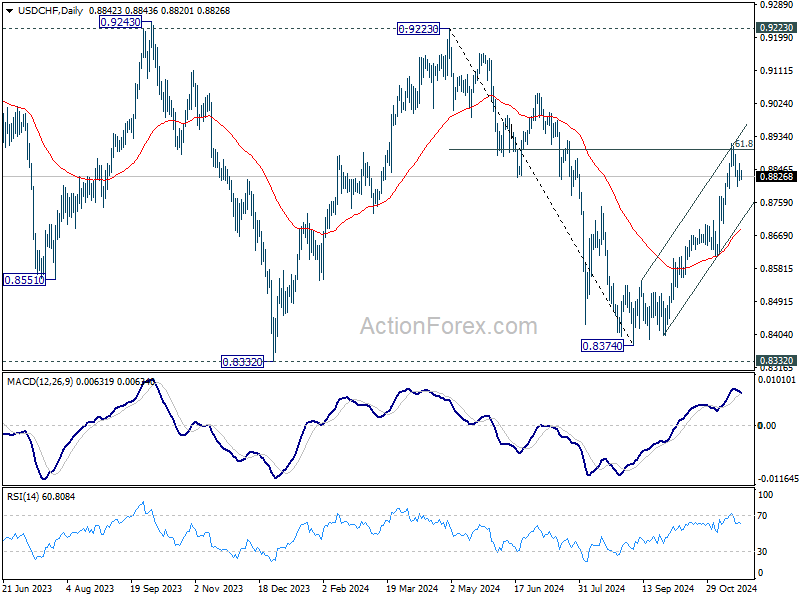
USD/CHF Daily Outlook
Daily Pivots: (S1) 0.8817; (P) 0.8839; (R1) 0.8865; More…
Intraday bias in USD/CHF remains neutral as consolidation from 0.8916 is extending. Further rally is expected as long as 0.8773 resistance turned support holds. On the upside, break of 0.8916 and sustained trading above 61.8% retracement of 0.9223 to 0.8374 at 0.8899 will pave the way back to 0.9223 key resistance.
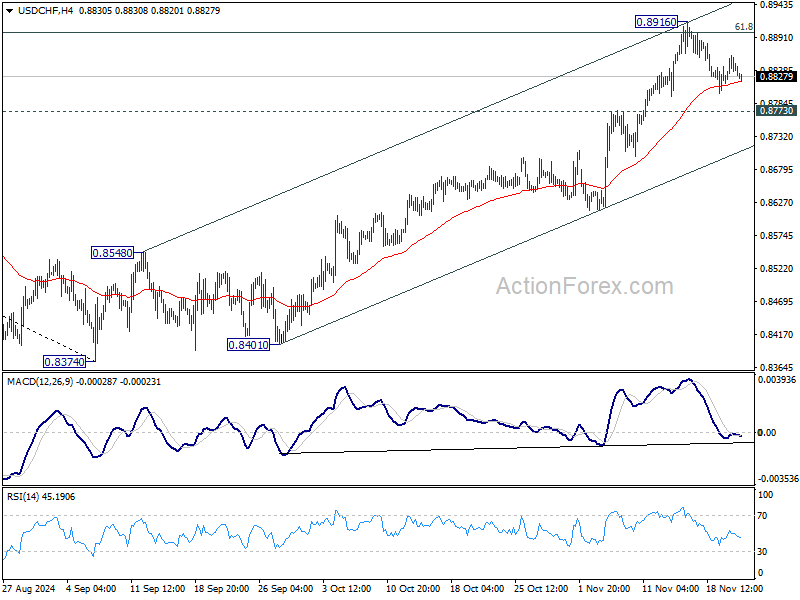
In the bigger picture, price actions from 0.8332 (2023 low) are currently seen as a medium term corrective pattern. Rise from 0.8374 is seen as the third leg. Overall outlook will continue to stay bearish as long as 0.9223 resistance holds. Break of 0.8332 low is in favor at a later stage when the consolidation completes.
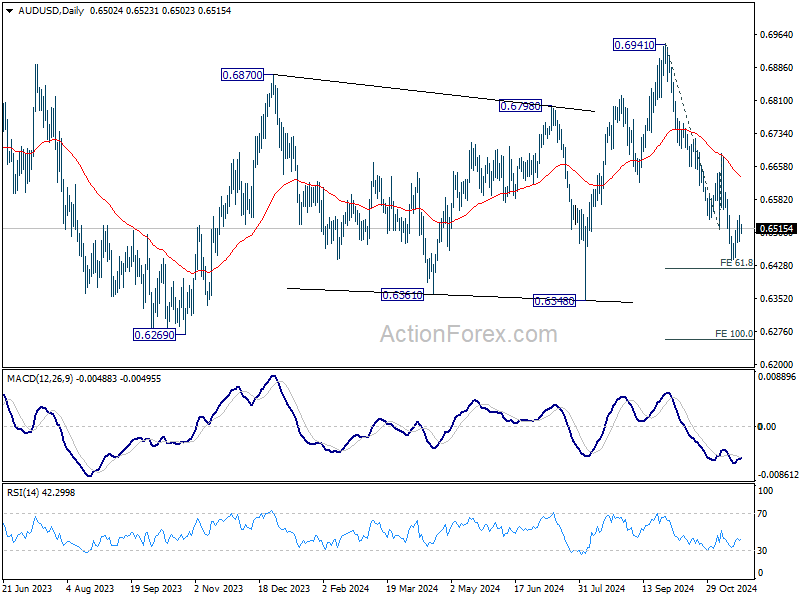
AUD/USD Daily Report
Daily Pivots: (S1) 0.6479; (P) 0.6512; (R1) 0.6539; More...
Intraday bias in AUD/USD remains neutral as consolidation from 0.6440 is still extending. Outlook will stay bearish as long as 0.6687 resistance holds. On the downside, decisive break of 61.8% projection of 0.6941 to 0.6511 from 0.6687 at 0.6421 will resume the fall from 0.6941 to 100% projection at 0.6257 next.
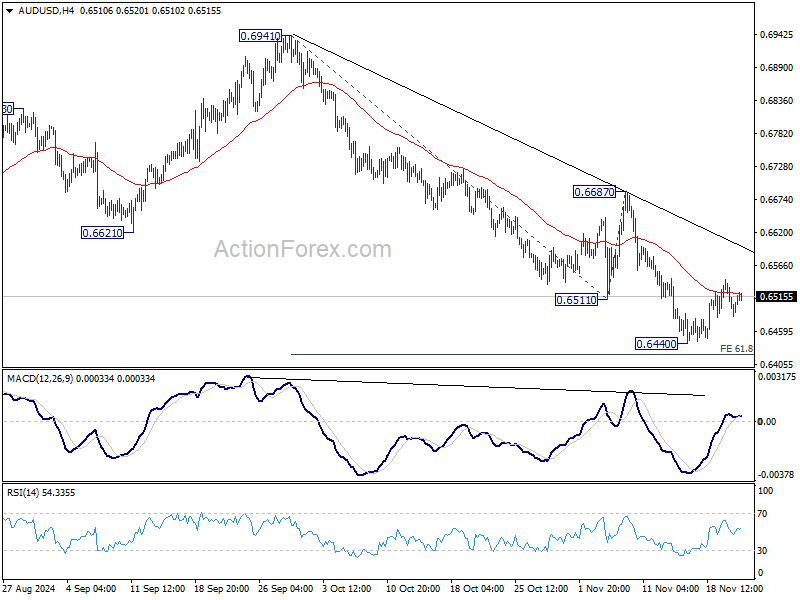
In the bigger picture, rise from 0.6269 (2023 low) should have completed with three waves up to 0.6941. Corrective pattern from 0.6169 (2022 low) is now extending with another falling leg. Deeper decline would be seen back to 0.6269 as sideway trading extends.