Sample Category Title
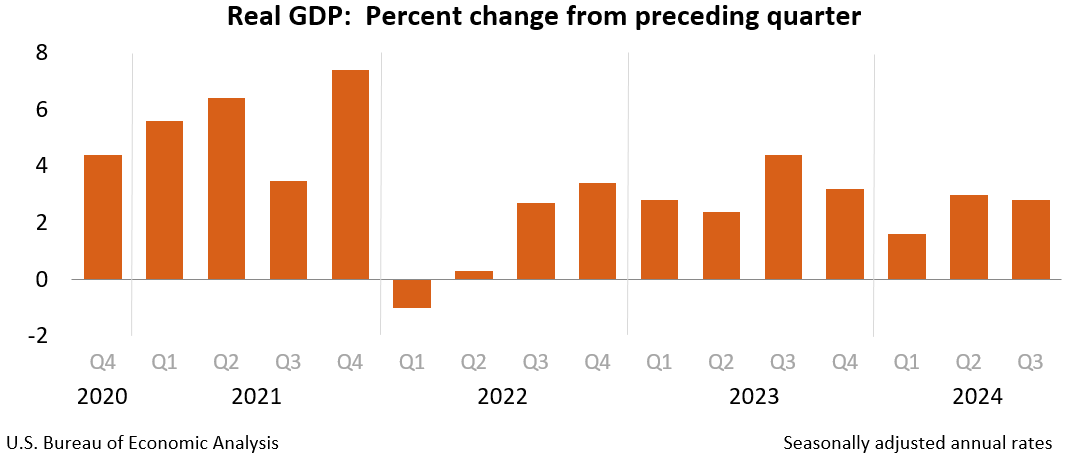
US Q3 GDP growth slows to 2.8% annualized, vs exp 3.0%
US economy expanded at an annual rate of 2.8% in the third quarter, slightly below the expected 3.0% and down from the previous quarter's 3.0% growth.
This increase in real GDP was primarily supported by stronger consumer spending, exports, and federal government expenditures. However, a rise in imports, which detracts from GDP, partially offset these gains.
Inflation pressures moderated, with PCE Price Index rising by 1.8%, down from 2.5% in Q2 and well below the expected 2.7%.
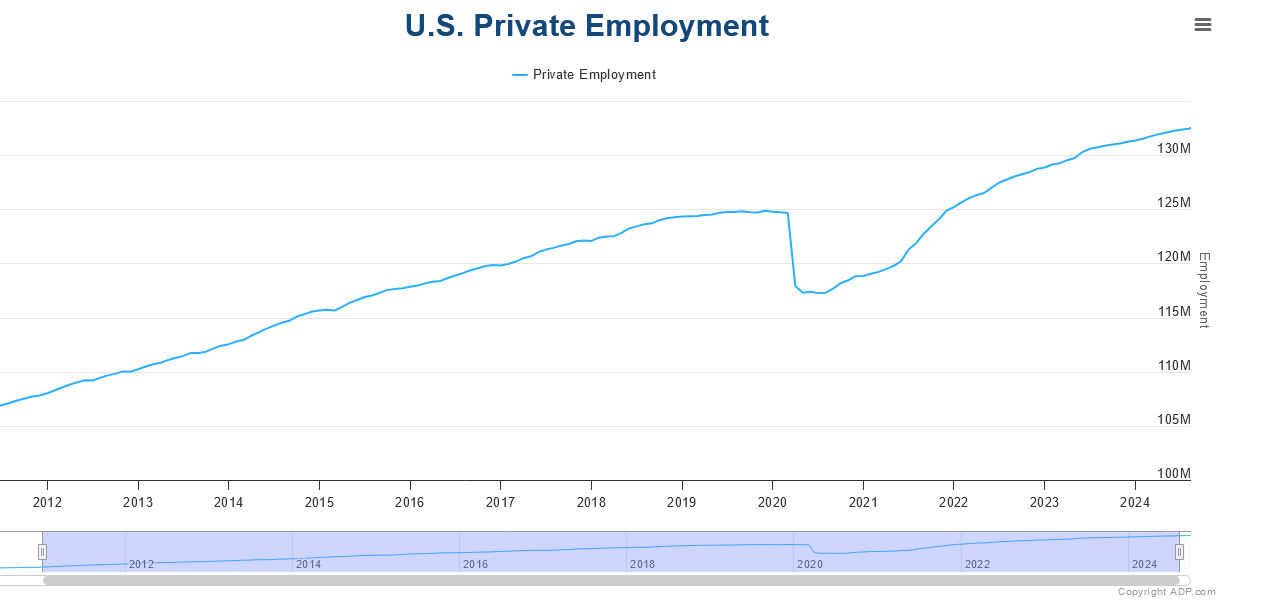
US ADP jobs rises 233k, hiring robust and resilient
US ADP report revealed robust private sector job growth in October, with employment rising by 233k, well above the forecasted 110k. Sector-wise, service-providing jobs led the way with a 211k increase, while goods-producing jobs added 22k.
By company size, large businesses contributed the most with 140k jobs, followed by medium-sized firms at 86k, and small companies at 4k.
Wage growth trends continued to ease, with year-over-year pay gains for job-stayers slowing to 4.6% and for job-changers to 6.2%.
ADP Chief Economist Nela Richardson highlighted the labor market’s resilience, noting that “even amid hurricane recovery, job growth was strong in October.” As the year approaches its end, the U.S. hiring remains "robust and broadly resilient.”
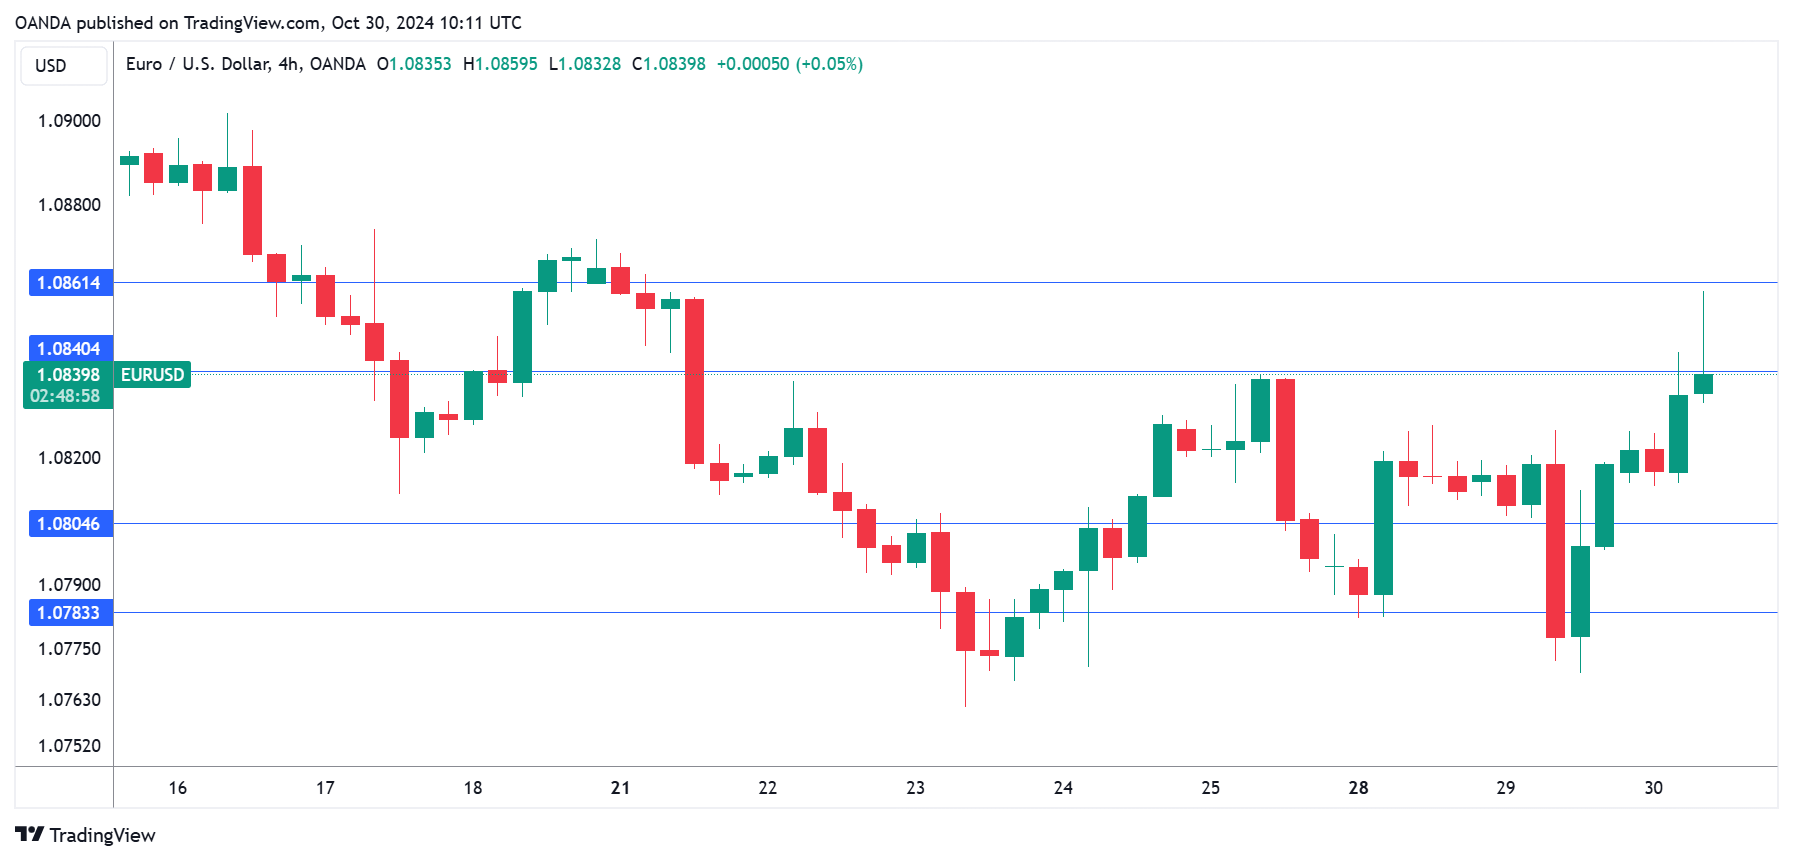
EUR/USD Rises as German GDP Beats Forecast
The euro is up for a third straight day on Wednesday. In the European session, EUR/USD is trading at 1.0839 at the time of writing, up 0.20% on the day.
Germany’s GDP for the third quarter surprised on the upside with a modest 0.2% gain. This was above the -0.1% reading in the second quarter and the market estimate of -0.1%. The German economy managed to avoid a technical recession, which is defined as two consecutive quarters of negative growth.
On a yearly basis, GDP fell by 0.2%, compared to zero growth in Q2 and a market estimate of -0.3%. Germany’s economy, the largest in the eurozone, remains in trouble and is weighing on the bloc. Eurozone GDP will be released later today and is expected to show a gain of 0.2% q/q and 0.8% y/y in Q3 vs. 0.2% q/q and 0.6% y/y in the second quarter.
German, eurozone inflation expected to accelerate
The markets will be keeping an eye on German inflation, which is expected to rise to 1.8% y/y in October, compared to 1.6% in September. This will be followed on Thursday with eurozone CPI, which is projected to rise from 1.9%, up from 1.8% previously. Core inflation is expected to creep lower to 2.6%, down from 2.7% in September and above the European Central Bank’s 2% target.
The German and eurozone inflation releases will be significant factors in the ECB’s rate plans. The central bank holds its final meeting of the year in December and a rate cut seems likely, although there is dissension among ECB Governing Council members as to the extent of the hike. If October’s inflation data is weaker than expected, we are likely to see growing calls for a jumbo 50-basis point cut at the December meeting.
EUR/USD Technical
- EUR/USD is testing resistance at 1.0840. Above, there is resistance at 1.0861
- 1.0804 and 1.0783 are the next support levels
Eurozone GDP grows 04% qoq in Q3, Germany avoids recession
Eurozone GDP rose by 0.4% qoq in Q3, surpassing the anticipated 0.2% qoq growth. A notable surprise came from Germany, where GDP grew by 0.2% qoq against expectations of a -0.1% qoq contraction, allowing Europe’s largest economy to narrowly avoid a recession. France also outperformed, with GDP increase of 0.3% qoq for the quarter.
For the EU as a whole, GDP expanded by 0.3% qoq. Among member states, Ireland posted the strongest growth at 2.0% qoq, followed by Lithuania at 1.1% qoq and Spain at 0.8% qoq.
However, some economies faced contraction, with Hungary’s GDP declining by -0.7% qoq, Latvia’s by -0.4% qoq, and Sweden’s by -0.1% qoq.
Year-over-year growth was mixed across the EU, with positive annual growth rates reported in seven countries, while six saw negative growth.
AUD/USD Continues Downward Spiral Amid Economic Concerns
The Australian dollar remains under significant pressure, with AUD/USD extending its downtrend mid-week to reach 0.6539, the lowest since August. The decline, which began on 1 October, has been relentless, with the pair experiencing little to no respite from its downward trajectory.
Recent data indicating that Australia's annual inflation cooled to 2.8% in Q3 from 3.8% in Q2, falling just below the expected 2.9%, has contributed to the accelerated sell-off. Although this brings inflation within the Reserve Bank of Australia's (RBA) target range of 2-3%, the core inflation gauge closely monitored by the RBA remains elevated at 3.5% year-on-year in Q3. Given the persistent core inflation, the RBA has no immediate impetus to lower interest rates.
The central bank maintains that inflation needs to stabilise before considering monetary easing. With the RBA's next meeting scheduled for next week, market consensus does not anticipate a change in the current interest rate of 4.35% per annum. Rate cuts are not expected until at least May 2025.
Technical analysis of AUD/USD
The AUD/USD is persisting in its downward wave, targeting 0.6533. If this level is reached, a corrective phase towards 0.6613 may follow, and the downward trend is expected to resume towards 0.6491. The MACD indicator supports this bearish outlook, as its signal line is well below zero, indicating a continuation of the downward momentum.
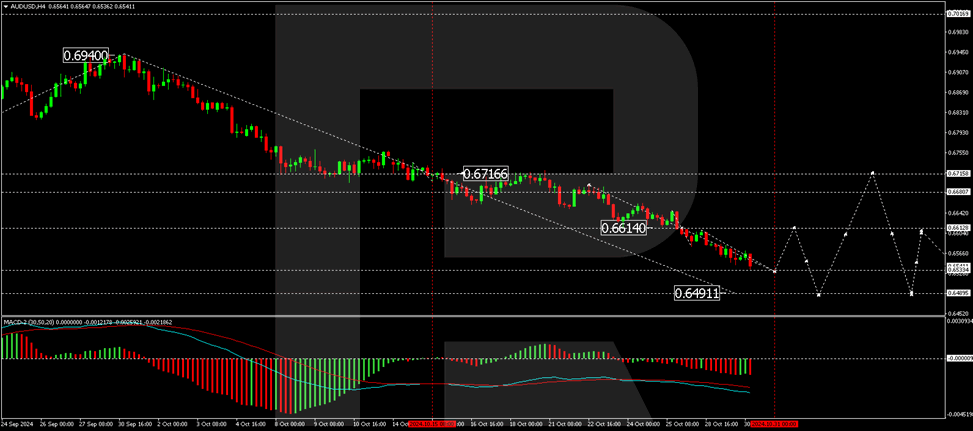
On the hourly chart, AUD/USD has established a consolidation range around 0.6570, breaking downwards to continue towards 0.6533. Once this level is achieved, a corrective move to 0.6613 may begin, with an intermediate target at 0.6570. This potential upward correction is confirmed by the Stochastic oscillator, whose signal line is below 20 but poised to rise towards 80, suggesting a brief respite from the selling pressure.
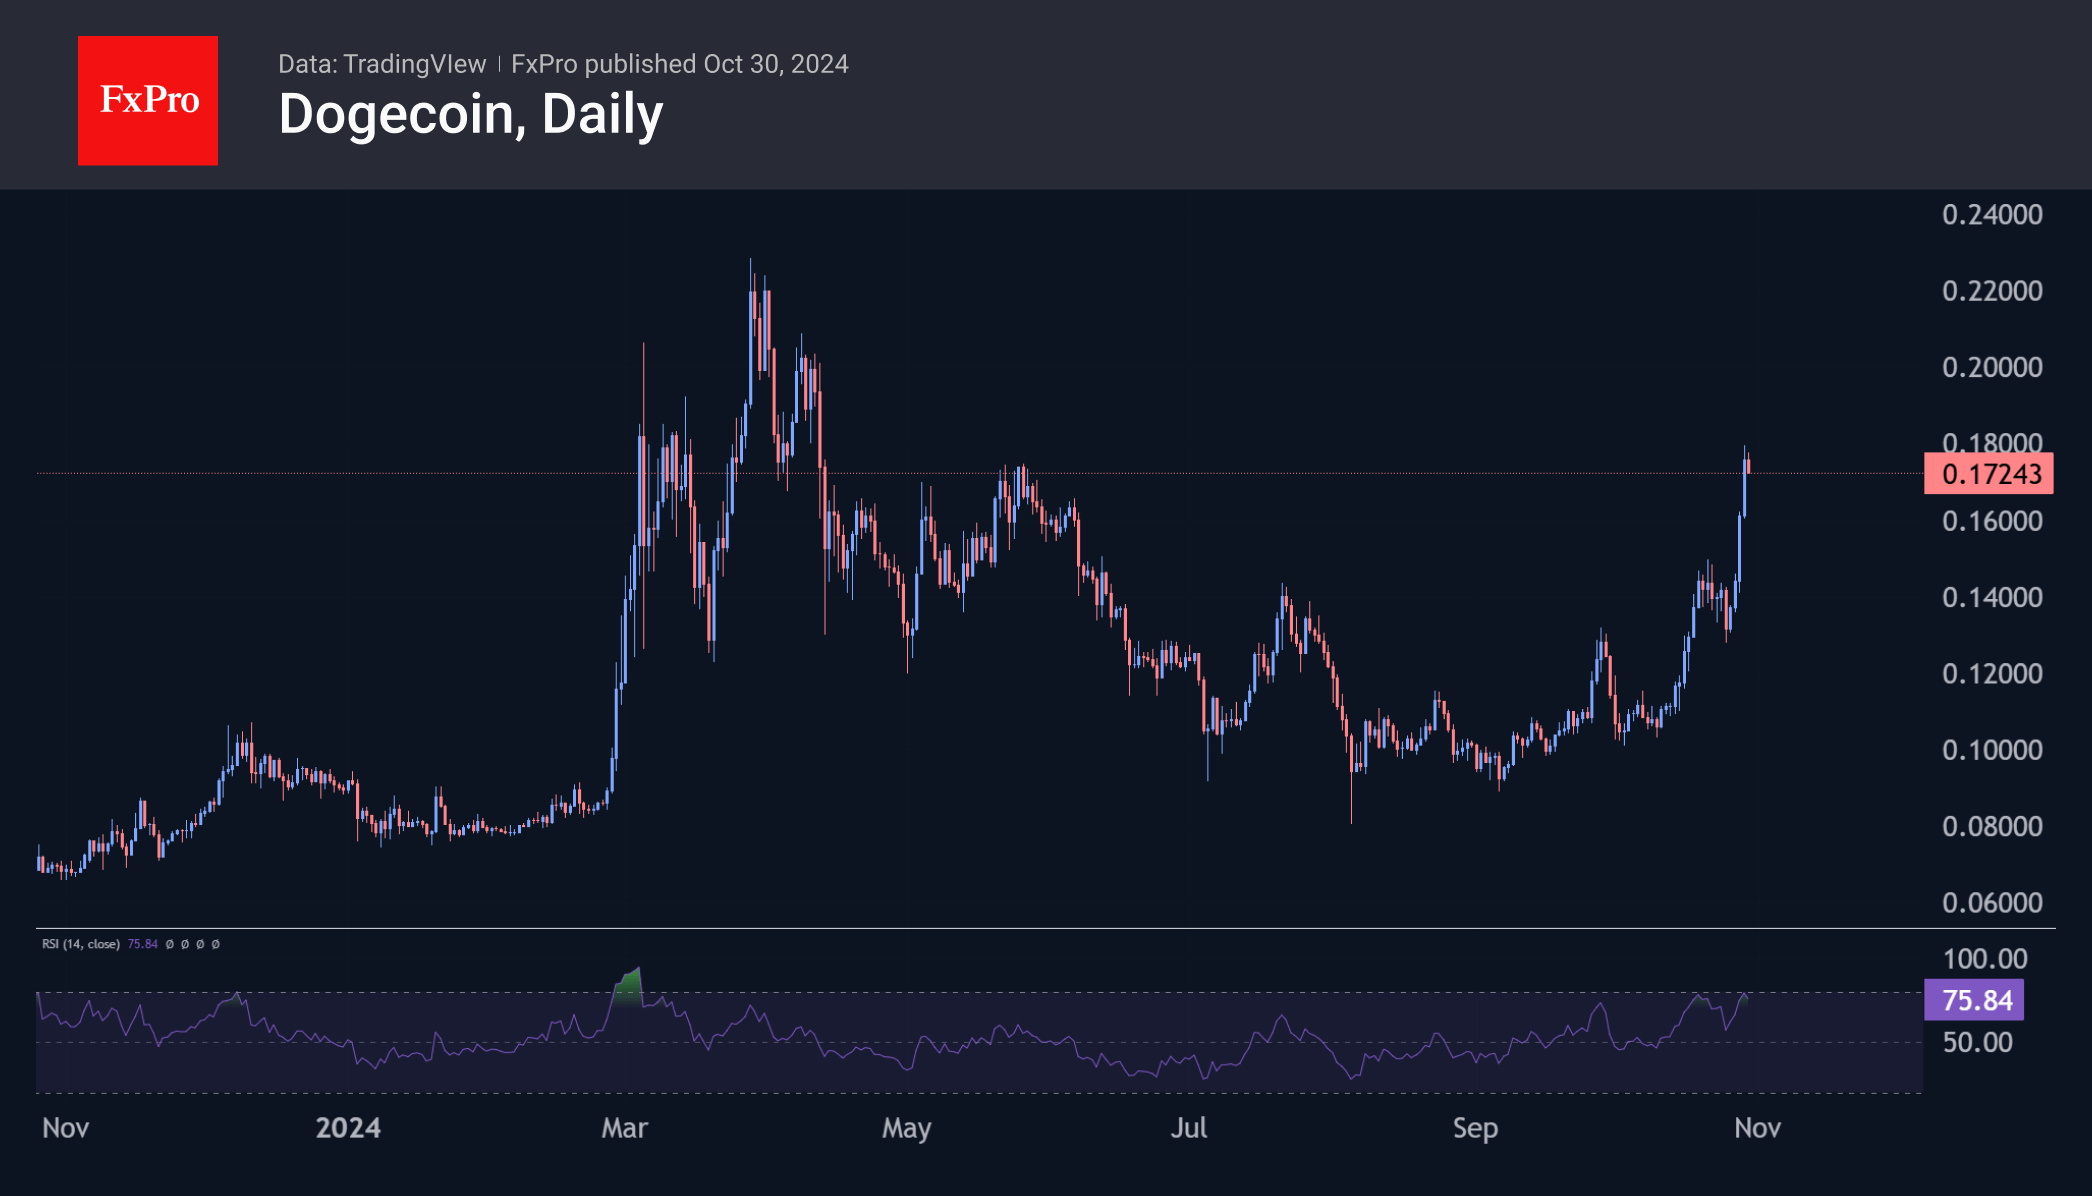
Bitcoin’s Rush to The Top
Market Picture
Bitcoin came within a hair’s breadth of an all-time high on Tuesday night, but the overall crypto market is well off its peak. Total cryptocurrency capitalisation at the overnight peak was $2.46 trillion, down $2.48 trillion from the July peak, almost 12% below the March high of $2.77 trillion and around $400 billion below the all-time high reached in November 2021. While the big picture points to a series of lower peaks, the medium-term uptrend since early September still suggests that new highs are a matter of months away. And the acceleration we saw last week suggests it’s a matter of weeks, not months.

Bitcoin has been the main driver, gaining momentum since Saturday. Trading near $72.4K, Bitcoin does not appear to be extremely overheated, leaving room for further strength.
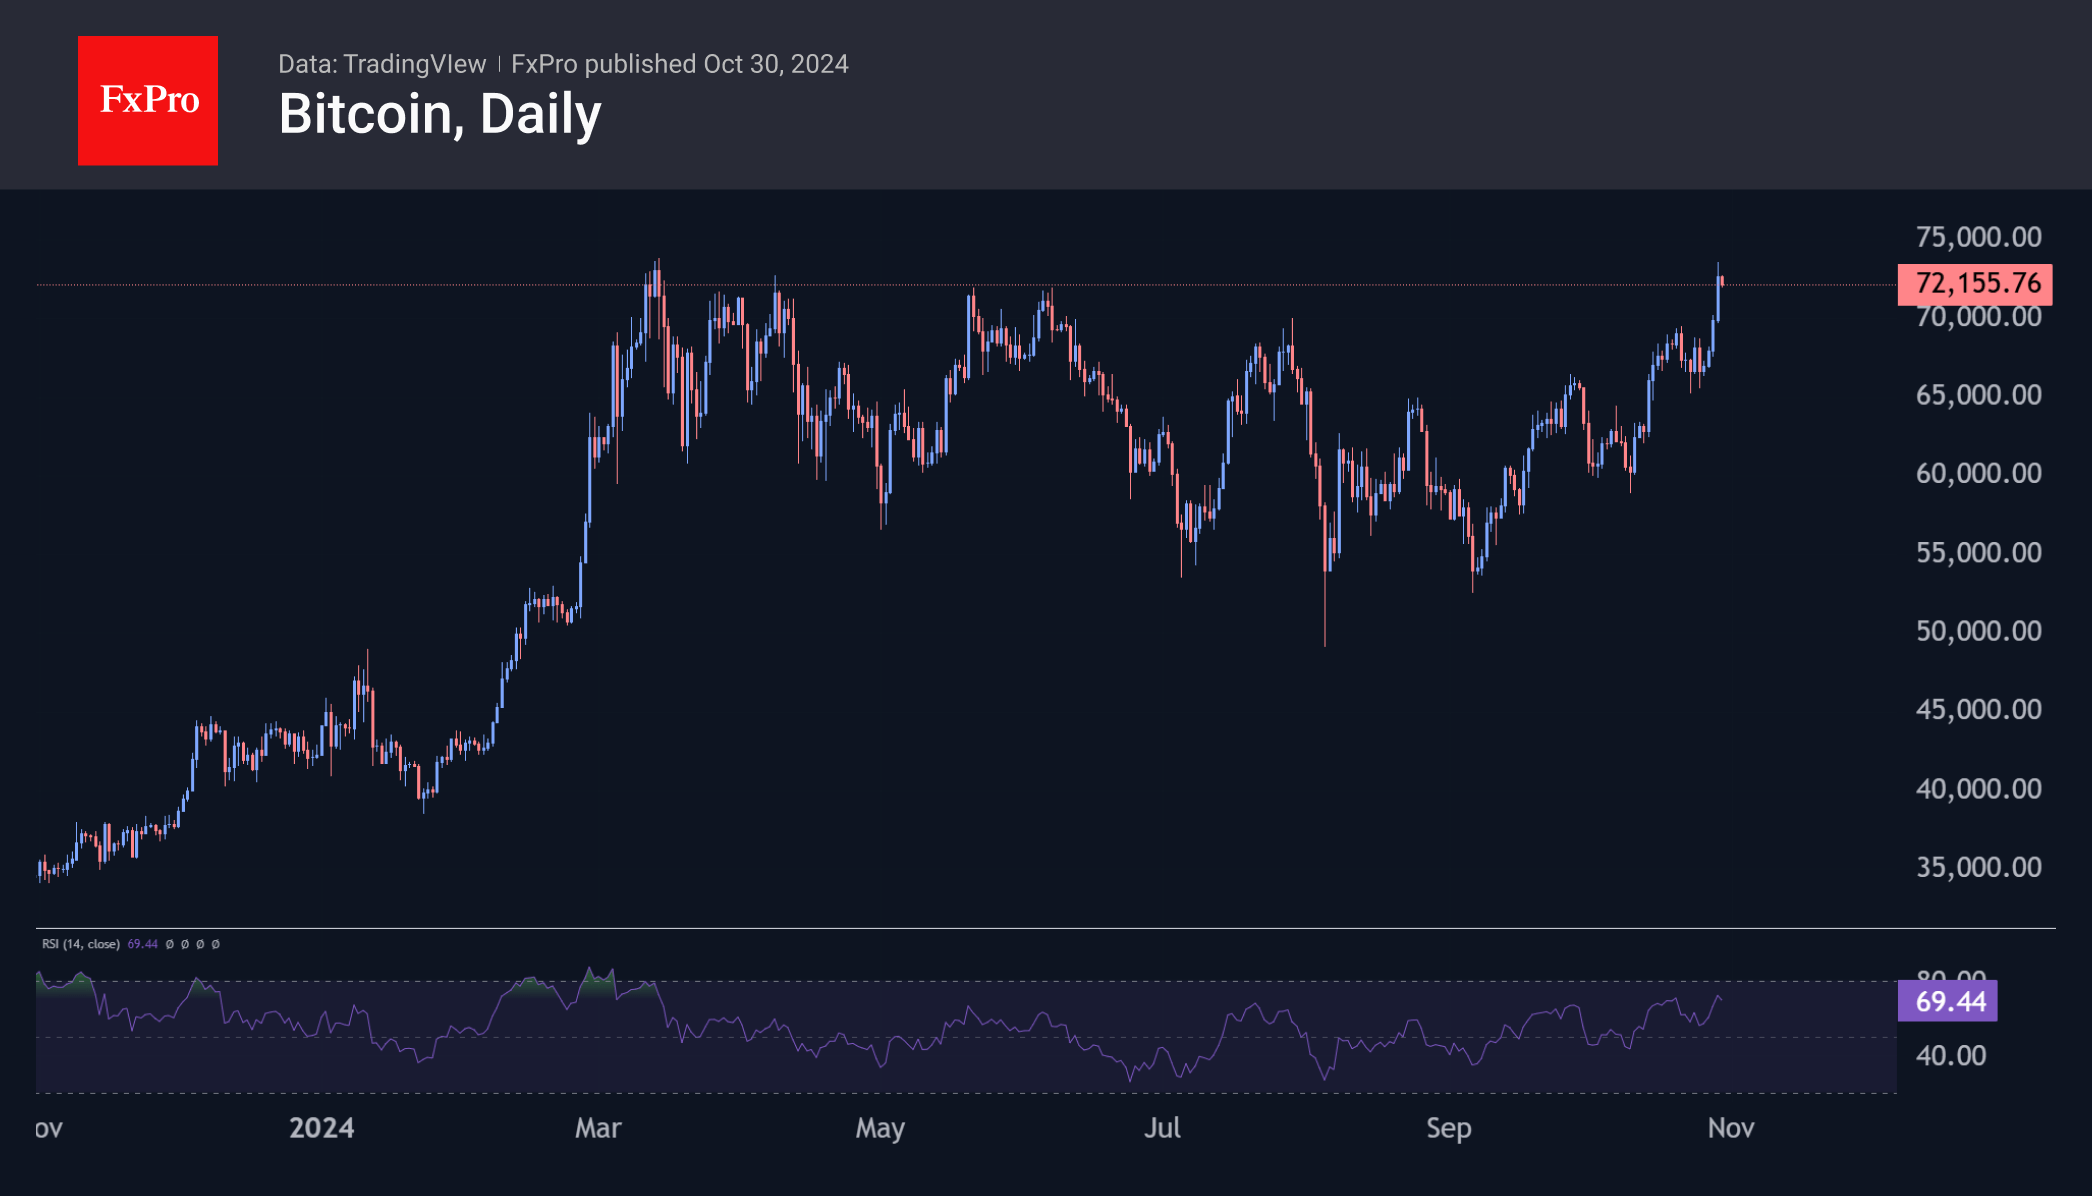
The market seems to be pricing in Trump’s victory and the easing of regulations on cryptocurrencies. The euphoria is particularly evident in Doge, which has gained another 6% in one day, 24% in seven days and over 41% in the last 30 days. The coin has no direct benefit from Trump’s rise to power, but speculators are warming to it because of frequent mentions of Musk, who may get a position in Trump’s government.
News Background
Bitget Research notes that several factors support BTC’s potential growth, including the expected Fed rate cut on 7 November. Market dynamics could also be influenced by the Microsoft board’s vote on the Bitcoin investment scheduled for 10 December.
According to former BitMEX CEO Arthur Hayes, demand for Bitcoin will rise sharply because of the Chinese stimulus. He believes that the injection of money into the economy and the threat of further inflation will lead to increased investment in risky assets.
The annualised yield on Steak, the second most capitalised cryptocurrency, has fallen to ~3%. Kaiko noted that Ether’s steak yield is now lower than that of other major tier 1 protocols, including Cosmos, Polkadot, Celestia, and Solana, which range from 7% to 21%.
Zeta Markets noted that Ethereum’s limitations are forcing users, applications, and capital to turn to L2 networks and competing blockchains such as Solana as demand for faster and more scalable solutions grows.
GBP/USD Recovers While EUR/GBP Struggles
GBP/USD is attempting a recovery wave above the 1.2950 resistance. EUR/GBP declined steadily below the 0.8330 and 0.8325 support levels.
Important Takeaways for GBP/USD and EUR/GBP Analysis Today
- The British Pound is attempting a fresh increase above 1.2950.
- There is a key rising channel forming with support near 1.2980 on the hourly chart of GBP/USD at FXOpen.
- EUR/GBP is trading in a bearish zone below the 0.8350 pivot level.
- There is a connecting bearish trend line forming with resistance near 0.8330 on the hourly chart at FXOpen.
GBP/USD Technical Analysis
On the hourly chart of GBP/USD at FXOpen, the pair declined after it failed to clear the 1.3120 resistance. As mentioned in the previous analysis, the British Pound even traded below the 1.3000 support against the US Dollar.
Finally, the pair tested the 1.2910 zone and is currently attempting a fresh increase. The bulls were able to push the pair above the 50-hour simple moving average and 1.2950. The pair even climbed above the 50% Fib retracement level of the downward move from the 1.3071 swing high to the 1.2907 low.
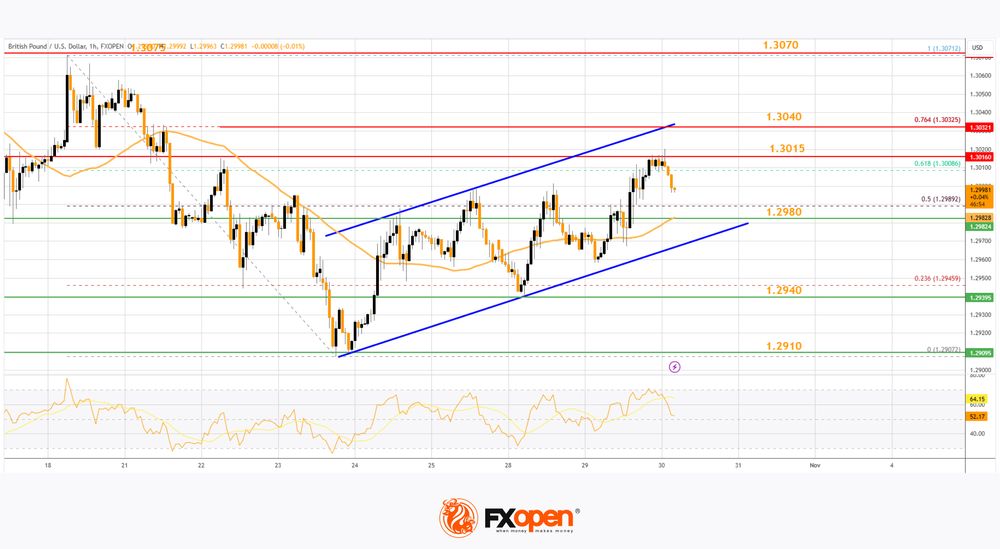
On the upside, the GBP/USD chart indicates that the pair is facing resistance near 1.3015. It coincides with the 61.8% Fib retracement level of the downward move from the 1.3071 swing high to the 1.2907 low.
The next major resistance is near 1.3040. A close above the 1.3040 resistance zone could open the doors for a move toward 1.3070. Any more gains might send GBP/USD toward 1.3120.
On the downside, there is a key support forming near a rising channel at 1.2980. If there is a downside break below 1.2980, the pair could accelerate lower. The first major support is near the 1.2940 level.
The next key support is seen near 1.2910, below which the pair could test 1.2880. Any more losses could lead the pair toward the 1.2845 support.
EUR/GBP Technical Analysis
On the hourly chart of EUR/GBP at FXOpen, the pair started a fresh decline from well above 0.8400. The Euro traded below the 0.8350 and 0.8330 support levels against the British Pound.
The EUR/GBP chart suggests that the pair even declined below the 0.8310 level and tested 0.8300. It is now consolidating losses and trading below the 50-hour simple moving average. The pair is now facing resistance near the 61.8% Fib retracement level of the downward move from the 0.8350 swing high to the 0.8298 low.
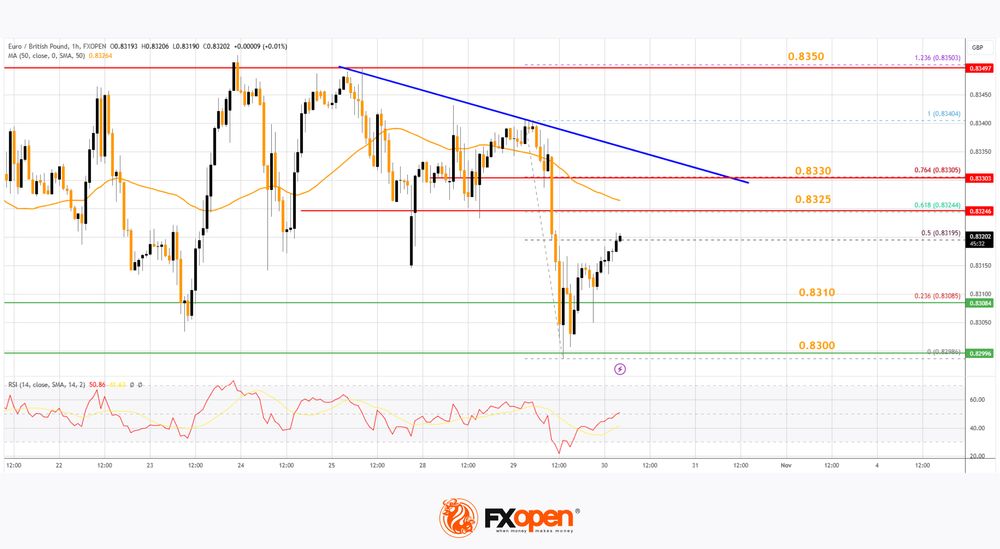
The next major resistance could be 0.8300, a connecting bearish trend line, and the 50-hour simple moving average. It coincides with the 76.4% Fib retracement level of the downward move from the 0.8350 swing high to the 0.8298 low.
The main resistance is near the 0.8350 zone. A close above the 0.8350 level might accelerate gains. In the stated case, the bulls may perhaps aim for a test of 0.8400. Any more gains might send the pair toward the 0.8420 level.
Immediate support sits near 0.8310. The next major support is near 0.8300. A downside break below the 0.8265 support might call for more downsides. In the stated case, the pair could drop toward the 0.8220 support level.
Trade over 50 forex markets 24 hours a day with FXOpen. Take advantage of low commissions, deep liquidity, and spreads from 0.0 pips. Open your FXOpen account now or learn more about trading forex with FXOpen.
This article represents the opinion of the Companies operating under the FXOpen brand only. It is not to be construed as an offer, solicitation, or recommendation with respect to products and services provided by the Companies operating under the FXOpen brand, nor is it to be considered financial advice.
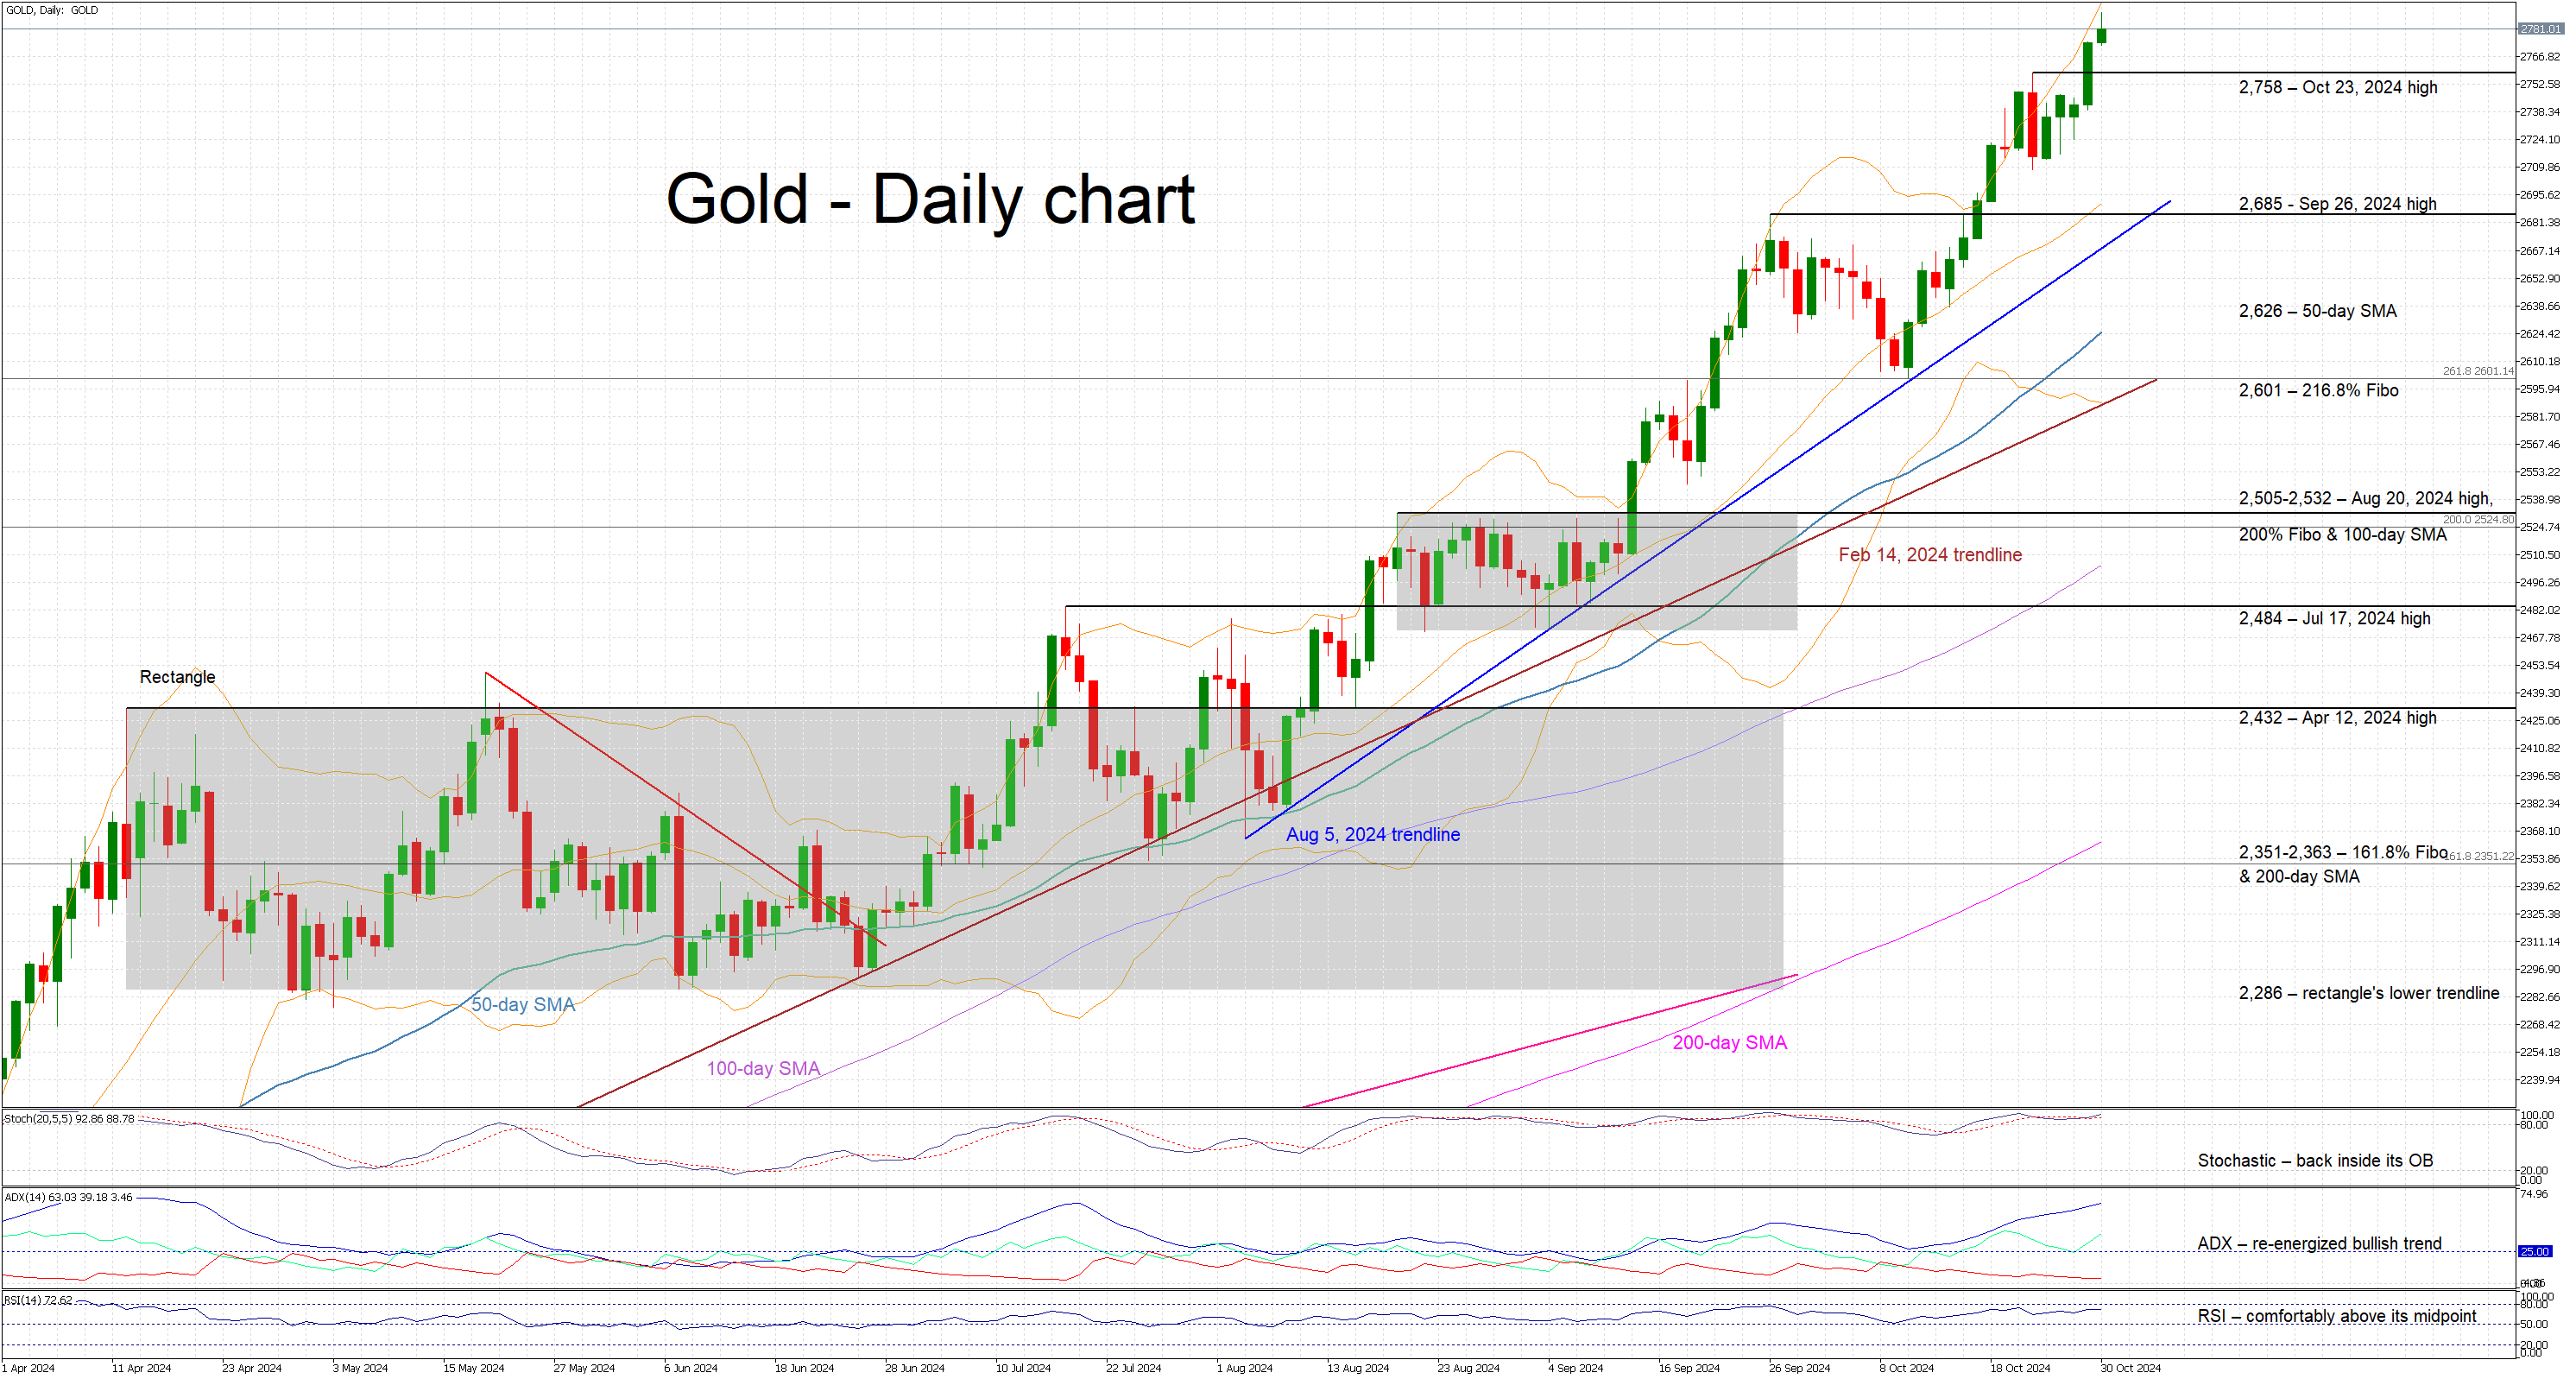
Gold Rallies Ahead of Key US Events
- Gold is trading higher again today
- Volatility is high ahead of key US data prints
- Momentum indicators remain bullish
Gold is trading higher again today, recording a new all-time high, following a very strong performance on Tuesday. This move could be attributed to the dollar being slightly on the back foot today, but, most likely, the incoming key US data releases and the market’s angst regarding next week’s events are the main reasons for the latest upleg. In addition, with the developments in the Middle East generating headlines, volatility in gold is expected to remain elevated.
In the meantime, the momentum indicators are bullish. The RSI is trading comfortably above its midpoint and is trying to record a higher high. Similarly, the Average Directional Movement Index (ADX) is edging higher, well above its 25 midpoint, confirming the bullish trend dictating gold’s price action. More importantly, the stochastic oscillator is hovering inside its overbought territory (OB) and showing little appetite, at this stage, for a downside move. Should it eventually manage to break below its OB, it could be seen as a strong bearish signal.
If the bulls remain confident, they could keep pushing gold higher, recording new all-time highs on a daily basis. The next target level is at 2,800, but, considering the current demand for this precious metal, next week’s events could allow the bulls to record an even more forceful rally.
On the flip side, the bears are keen for an overdue correction. They could lead gold lower towards the October 23, 2024 high at 2,758 with the first key support area coming at 2,685, where the September 26, 2024 high and the August 5, 2024 ascending trendline currently cross. Even lower, the 50-day SMA at 2,626 could be the last obstacle before the bears are able test the support set by the 261.8% Fibonacci extension of March 8, 2022 – September 28, 2022 downtrend at 2,601.
To sum up, gold is recording another upleg as market angst about the next big US events is keeping demand strong for this safe haven asset.
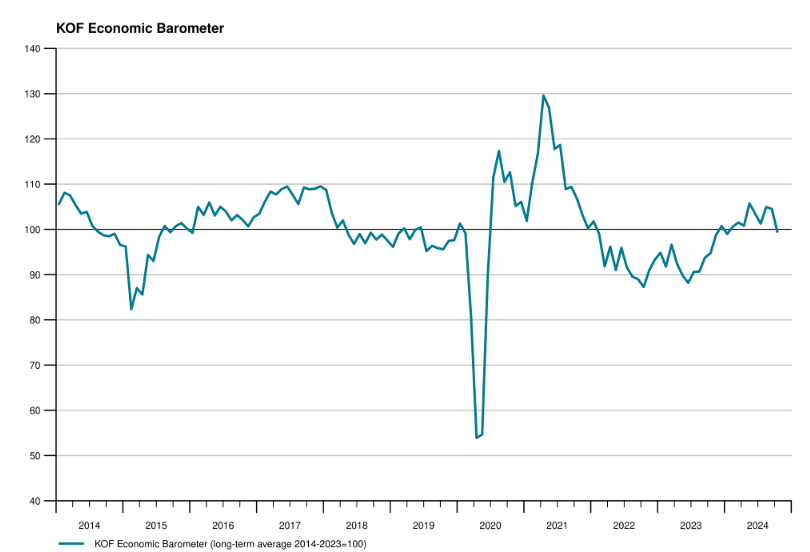
Swiss KOF falls to 99.5 in Oct, recovery very hesitant
Swiss KOF Economic Barometer declined sharply from 104.5 to 99.5 in October, missing the expected 105.0 and falling below the 100-point threshold for the first time since January. This shift suggests a weakening outlook for the Swiss economy, with the KOF describing the recovery as “very hesitant.”
In October, indicators across all production-related sectors, including manufacturing, financial and insurance services, hospitality, and construction, showed declines.
Demand-side indicators, such as those for foreign and consumer demand, remained stable but showed little promise of stimulating stronger economic momentum.
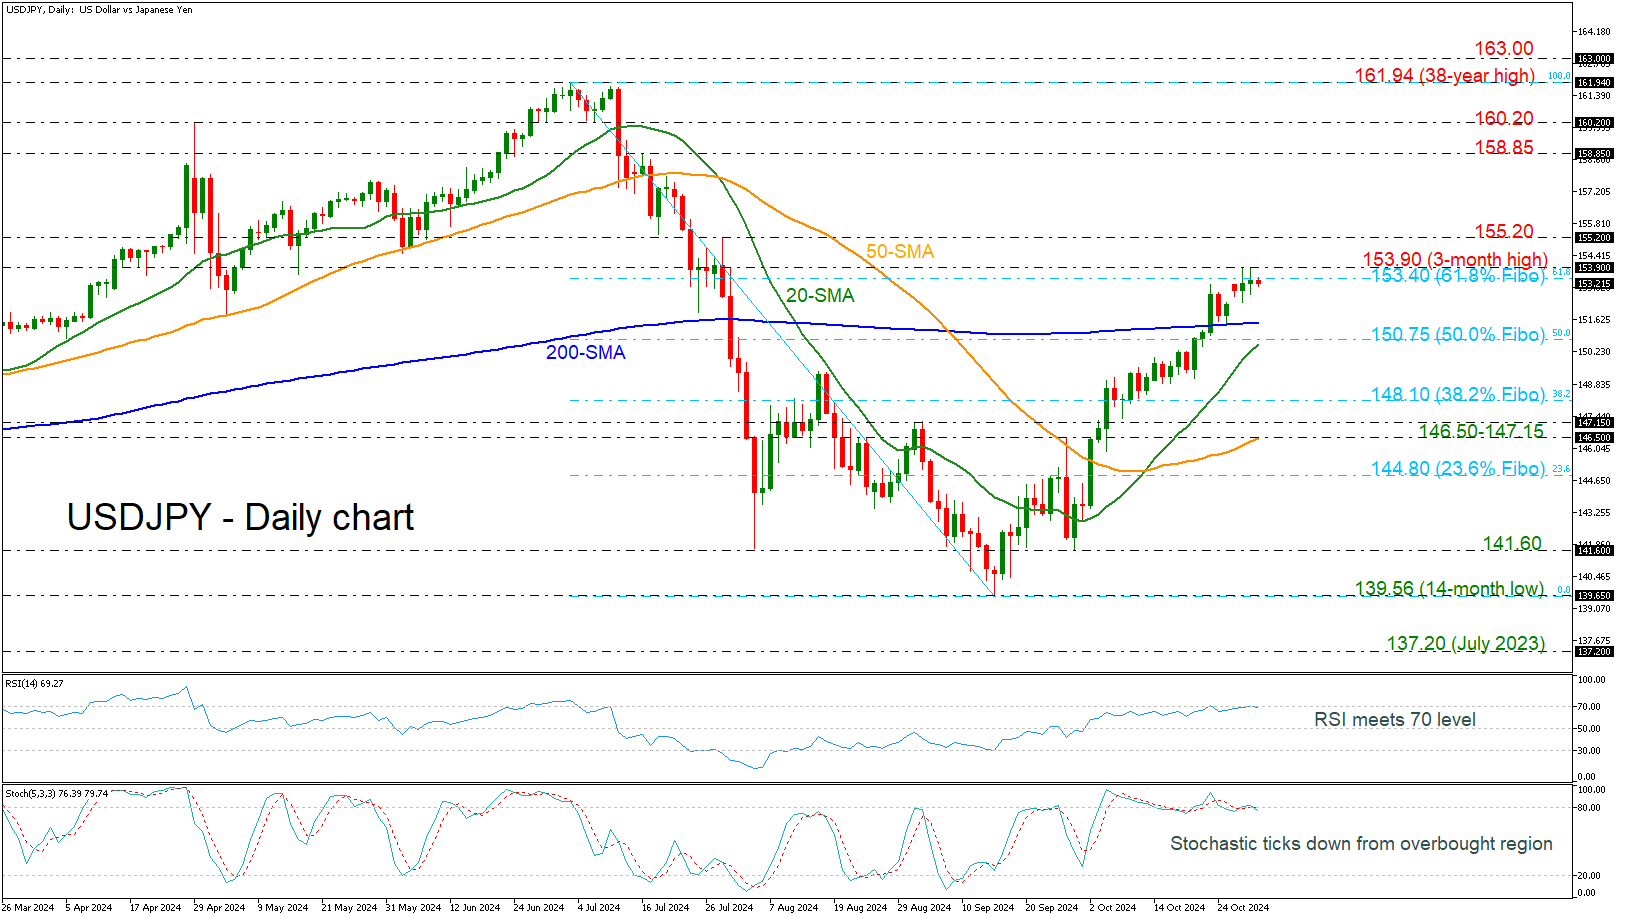
USDJPY Struggles to Destroy 61.8% Fibo at 153.40
- USDJPY tests 3-month high again and again
- Remains well above 200-day SMA
- Stochastic and RSI look overbought
USDJPY is failing to have a closing session beyond the 61.8% Fibonacci retracement level of the down leg from 161.94 to 139.56 at 153.40 but is creating bullish spikes towards the three-month high of 153.90.
The pair remains well above the 200-day simple moving average (SMA), but the momentum seems to be weak. The RSI is moving horizontally near the 70 level, while the stochastic created a bearish crossover between its %K and %D lines in the overbought area. Both indicate a potential end to the bullish mode in the short term.
If there is an attempt above the three-month high of 153.90, then the next hurdle to look for would be the 155.20 resistance ahead of the 158.85 and 160.20 restrictive lines.
If the bears manage to push the market below the 200-day SMA, their initial target would be the 50.0% Fibonacci of 150.75, which is in close proximity to the 20-day SMA. Diving further, the 38.2% Fibonacci of 148.10 may pause the negative movements.
To sum up, USDJPY has added more than 10% over the last one-and-a-half months, switching the near-term view to bullish. However, a move back below the 146.50-147.15 support zone could endorse the medium-term bearish bias.