Sample Category Title
Sterling drops as market questions growth impact of Reeves’ budget
Sterling fell sharply overnight, alongside with 10-year government bond and FTSE, as markets reacted to Chancellor Rachel Reeves’ new budget. Critics argue the budget is being heavy on spending, tax hikes, and borrowing but light on measures to stimulate economic growth. Beside, the higher short-term borrowing plans outlined in the budget are casting doubts on whether BoE can proceed with a robust rate-cutting cycle.
The Office for Budget Responsibility revised its economic outlook, forecasting GDP growth of 2.0% in 2025, only a slight improvement over the previous 1.9% projection. Additionally, the OBR raised its inflation forecast for next year to an average of 2.6%, up sharply from the previous estimate of 1.5%.
Although BoE is still expected to implement a 25 bps rate cut next week, taking the rate to 4.75%, the budget’s spending and borrowing plans may limit the central bank’s ability to lower rates further. Market pricing now reflects fewer anticipated rate cuts, with expectations that the BoE’s base rate will only fall to around 4% by the end of 2025, higher than previously projected.
While a slower pace of monetary policy easing could be supportive of the Pound, traders are increasingly worried about the UK's growth prospects under the new fiscal strategy.
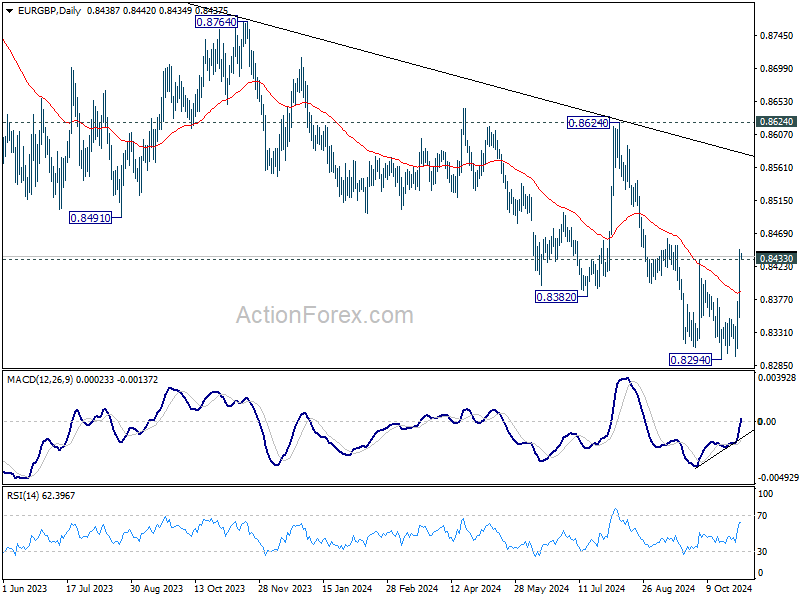
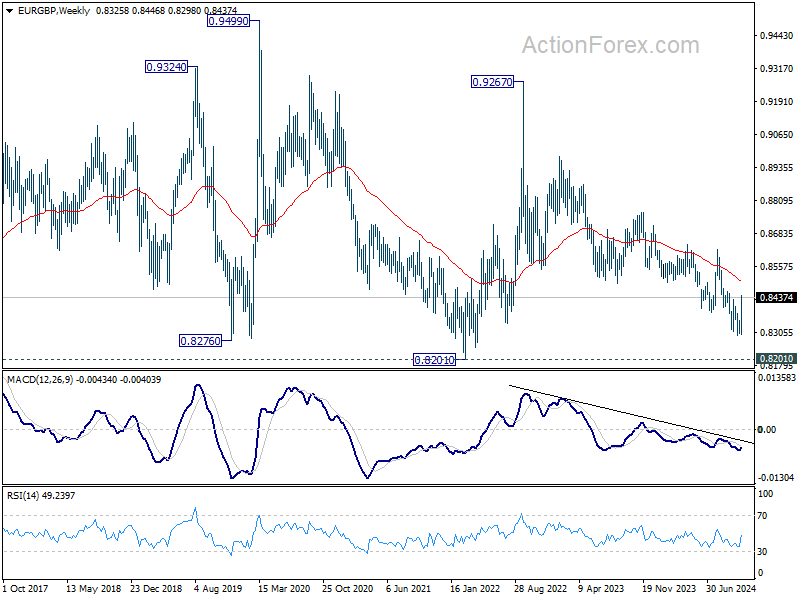
Technically, EUR/GBP's break of 0.8433 resistance should confirm short term bottoming at 0.8294, on bullish convergence condition in D MACD. Stronger rally should be seen to 55 W EMA (now at 0.8502) Decisive break there will be the first sign of medium term bullish trend reversal, and target 0.8624 resistance for confirmation.
China’s Caixin PMI manufacturing rises to 50.3, domestic demand recovery amid weak exports
China’s Caixin Manufacturing PMI improved to 50.3 in October, up from 49.3 and surpassing expectations of 49.5.
According to Wang Zhe, Senior Economist at Caixin Insight Group, October brought a mix of positive developments, including “growth in manufacturing supply and demand, increases in prices, proactive inventory replenishment by companies, and logistics delays.”
However, challenges persist as external demand remains soft; new export orders contracted for the third consecutive month. Wang added that declining employment levels and weak foreign demand continue to weigh on the sector.
Japan’s PMI manufacturing finalized at 49.2, weak domestic and global demand
Japan’s PMI Manufacturing was finalized at 49.2 in October, a decline from September's 49.7, signaling continued contraction in the sector.
Usamah Bhatti at S&P Global Market Intelligence noted that while output fell only slightly, it was at the sharpest rate since April, with new orders contracting at their fastest pace in three months. Companies cited “weakness in domestic and global demand” as weighing heavily on sales and output, particularly in the semiconductor and auto industries.
Bhatti added that “near-term outlook is clouded” as firms worked through backlogs, suggesting that incoming orders are insufficient to support ongoing production. Business confidence also remained subdued, hovering near a two-year low, with firms expressing concerns about the timeline for recovery from the current “economic malaise.”
Cliff Notes: A Step Behind, But With Goal in Sight
Key insights from the week that was.
In Australia, the Q3 CPI reported a 0.2% (2.8%yr) increase in headline inflation and a 0.8% (3.5%yr) lift in underlying trimmed mean inflation, both of which broadly met expectations. The impact of rebates was apparent in the headline detail, a –17.3% fall in electricity prices in Q3 the main reason why headline inflation managed to return to the band, alongside softness in auto fuel prices (–6.7%). Abstracting from these big moves, the underlying narrative has not changed materially since Q2. Price pressures in policy-sensitive components of consumption remain benign, discretionary inflation (ex tobacco) holding at a 2.1%yr pace in Q3. However, inflation is only gradually abating across non-discretionary items (excluding energy) such as rents and insurance.
Following this data release, Chief Economist Luci Ellis affirmed Westpac’s view that the RBA’s rate cutting cycle will begin in February 2025. Importantly, Q3 trimmed mean inflation was broadly in line with the RBA’s own forecasts; together with the recent revisions to activity data pointing to a better picture around supply capacity and productivity than previously assumed, the inflation detail suggests the risks of further increases in interest rates have dissipated. That said, there looks to be little appetite for the RBA Board to reverse their guidance that rate cuts this year ‘do not align with its thinking’. From February, we believe the RBA will begin slowly reducing policy’s restrictiveness, a cut per quarter to leave the cash rate at a terminal rate for this cycle of 3.35% in Q4 2025.
Developments in economic activity will also prove critical to the RBA outlook. This week’s update on retail sales continued to highlight the price sensitivity of consumers, retail volumes up a modest 0.5% in Q3, only the second increase in volumes in two years, with spending concentrated in items where prices have fallen. While we lack visibility around services consumption, this result, alongside other partial data, points to some downside risk to total consumer spending in the September quarter. For deeper insights on the current state of the Australian consumer, see Westpac’s Red Book.
On the international scene, politics were front and centre. Ahead of next Tuesday’s US Presidential and Congressional elections, opinion polls continue to indicate Donal Trump and Kamala Harris are neck and neck. While Trump seems to have edged ahead in some of the key swing states, his lead remains within the margin of error. Prediction markets in contrast imply close to a 2/3 probability of a Trump victory, and financial markets this week continued to position for such an outcome. Though it has to be said, US data this week was also consistent with a positive outlook for growth and the US dollar (more below).
Political uncertainty is also on the rise in Japan, the coalition government, led by the LDP, losing its majority in the lower house election last weekend. PM Ishiba, elected to lead his party only a month ago, is staying in his position hoping to find political support from other parties, likely in exchange for a commitment to higher future government spending. Turning to monetary policy, the BoJ kept the policy rate unchanged at 0.25% at its October meeting; but in the post-meeting communications, the Governor sounded more optimistic about the global outlook, particularly the US, and assessed that, domestically, wage increases remain supportive of consumer inflation. Another rate hike therefore arguably remains on the agenda for coming months, particularly if further Yen weakness is seen.
In the UK meanwhile, the new Labour government announced their first Budget, delivering a significant increases in public investment and spending worth around 2% of GDP per year. Looser fiscal policy is expected to boost UK GDP growth in the near term. According to official forecasts, GDP growth is on a trajectory to reach 2%yr next year, with around 0.5ppts coming from fiscal policy, before easing slightly in subsequent years. The extra spending will be funded almost equally by higher borrowing and taxes, the latter as a share of GDP forecast to rise above 38%, a record high and 5ppts above the pre-pandemic level. Financial markets showed concern over the fiscal outlook, the rise in projected government borrowing seeing Gilts yields rise across the curve.
In terms of the economic data flow, US GDP data confirmed the US economy carried robust momentum into the second half of this year, expanding 2.8%qtr annualised in Q3, only very slightly below the growth rates of Q2 and 2023 as a whole. Growth’s composition didn’t reveal any material changes to underlying trends, with personal consumption, business equipment investment and public spending leading the way. While net exports, inventories and residential investment were drags in Q3, lower interest rates should start supporting the latter, particularly if sentiment in housing and the labour market outlook remains firm.
Q3 Euro Area GDP also did not disappoint. Surprising market expectations, which had been weighed down by recent soft readings for economic sentiment, activity rose by 0.4%qtr in Q3. This was the strongest gain in two years and left annual growth at a more promising 0.9%yr. Temporary factors contributed – the Olympic Games supported growth in France, while a 2%qtr jump in Ireland surely is a one-off which will, at least partly, reverse – but there was also some positive news about underlying growth in key member states. Germany's economy escaped recession, activity rising 0.2%qtr to partially reverse Q2’s 0.3%qtr decline. And Spain showed no signs of slowing down, GDP posting another 0.8%qtr increase, taking annual growth to 3.4%yr. Looking ahead, stronger Euro Area growth momentum should temper market expectations of steep ECB policy rate cuts over the coming year. We continue to expect a 25bp Deposit Rate cut at their final policy meeting of the year, followed by one cut per quarter through H1 2025.
Dollar Could Get a Boost from Friday’s US Jobs Data
- Markets are preparing for next week’s US election
- Key US data on Friday, a week before the Fed meeting
- Another strong set of data could endanger the Fed rate cut
- The dollar could get a meaningful boost against the yen
US election in the spotlight
The US presidential election continues to monopolize the market’s interest. While the outcome is uncertain, most investors have a pretty good idea of the economic agendas of both candidates. Former president Trump is probably gearing up for a repeat of his first term of protectionism and trade wars, while Vice President Harris is expected to continue in President Biden’s footsteps.
Amidst these developments, the Fed is meeting next week. While its easing path might potentially be affected by the US election result, next week’s decision will most likely depend on the economic progress made since mid-September.
Will the US data continue to surprise?
Since the September 18 Fed gathering, US data has been decent with inflation, retail sales and durable goods orders surprising on the upside. However, the labour market remains the critical factor in the Fed's decision-making process. In this context, on Friday, the October jobs report will be published.
Economists forecast an 115k rise in non-farm payrolls, following a sizeable 254k increase in September, with both the unemployment rate and average earnings growth expected to remain stable at 4.1% and 4% respectively. It is worth nothing that there is a small possibility of this data being affected by the recent Hurricane Helene.
Wednesday’s ADP print and Thursday’s weekly jobless claims figures have potentially opened the door to an upside surprise on Friday, despite the fact that market participants are fully aware of the very weak correlation between the ADP report and the non-farm payroll data.
Could next week’s Fed rate cut be under threat?
The market is very confident that, regardless of Friday’s data, a rate cut will be announced next week, currently assigning a 95% probability for this move. However, following the stronger US data in mid-October, certain Fed hawks openly talked about a pause in November.
A strong set of figures, especially a non-farm payrolls print above 250k, could really add weight to their arguments. While the Fed rate cut seems to be safe at this stage, a decision taken with a slight majority could mean that the Fed’s rates outlook is more uncertain than currently foreseen.
On the flip side, a downside surprise in Friday’s data releases would confirm the universally expected outcome of the November 7 Fed meeting, potentially forcing the hawks to take a back seat and just follow Chairman Powell’s lead.
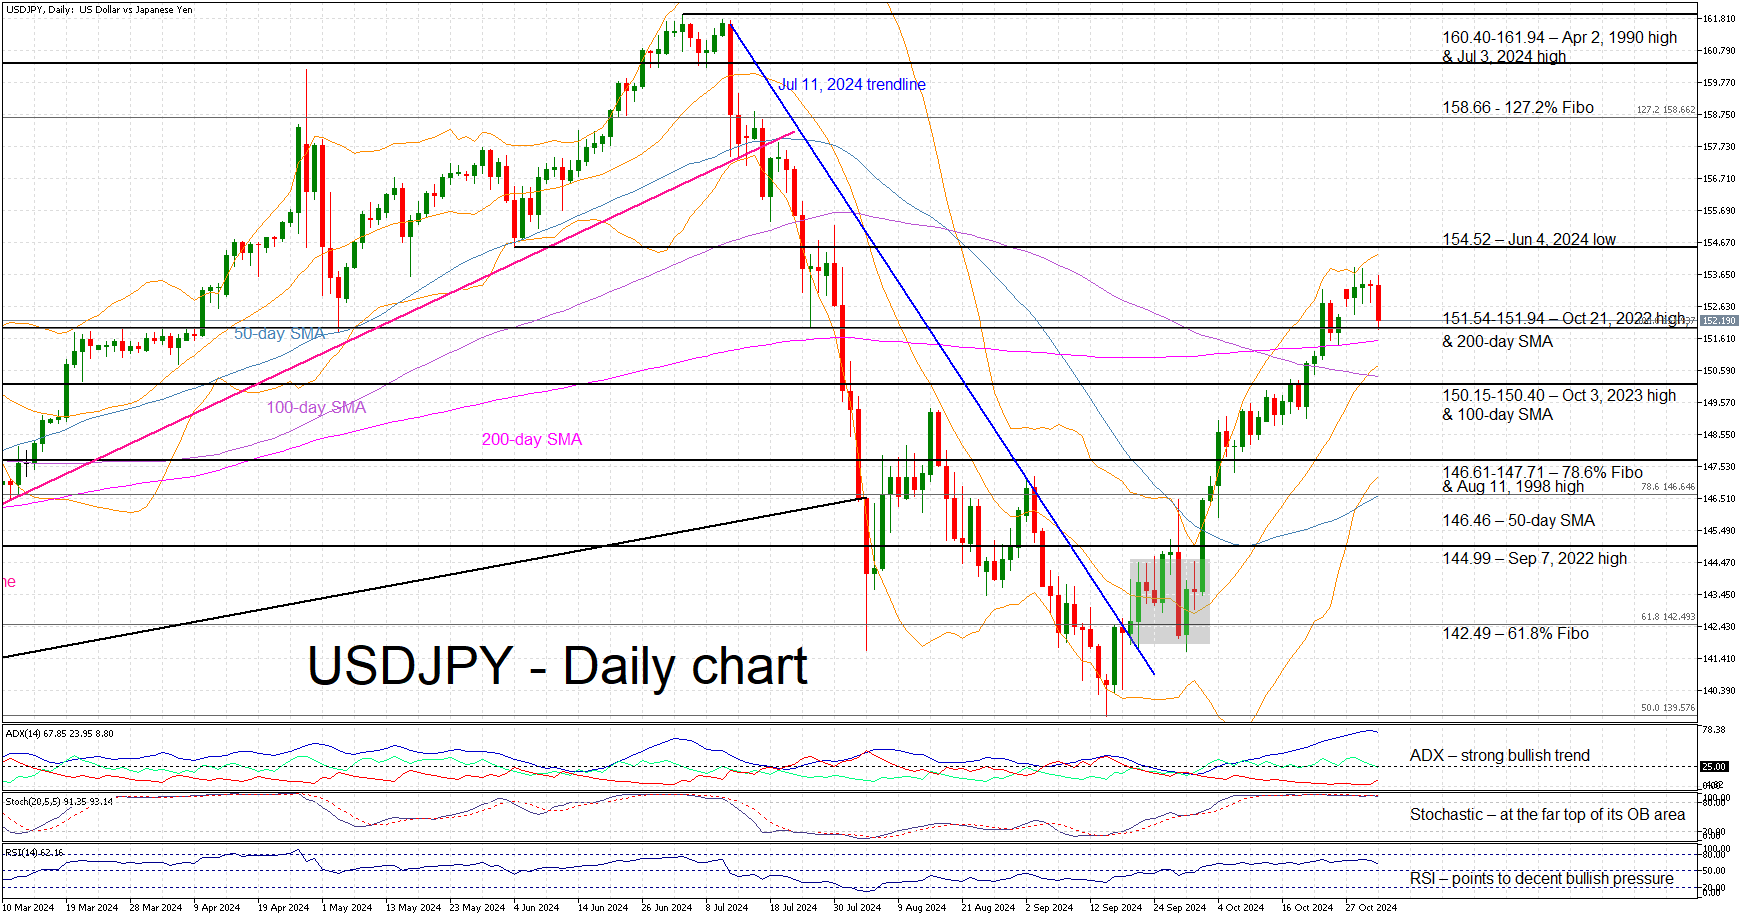
Dollar/yen rally pauses temporarily
The constant stream of strong US data, the imminent US election and the inconclusive outcome of the recent Japanese general election have pushed dollar/yen higher. Another positive set of US data releases on Friday could add to the recent bullish move with dollar bulls trying to push dollar/yen comfortably above the 154.52 level. On the other hand, weaker data prints could open the door to a selloff, which could become more protracted if the bears manage to break below the 151.54-151.94 area.
US Stocks Feel Selling Pressure
Indices
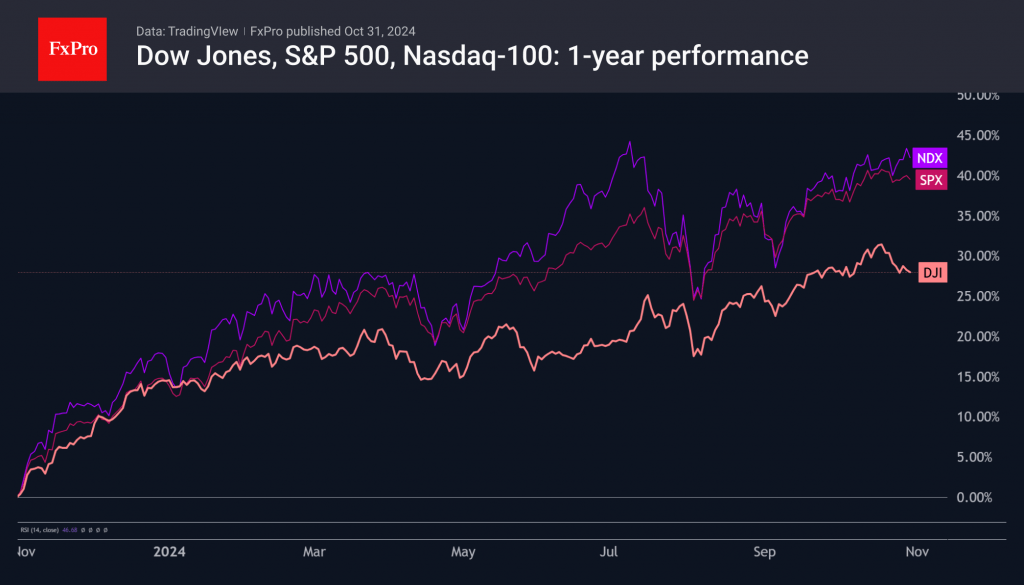
The major US indices began the week with an attempt to return to growth but were choked by selling. Once again, the laggard was the Dow Jones, which slipped below last week’s lows, losing 3% from its previous high on 21 October to levels near 42000. The Nasdaq100 briefly approached 20700, almost repeating its mid-July high, but the cold reception to reports from heavyweights Microsoft, Meta, and others triggered a fresh wave of selling.
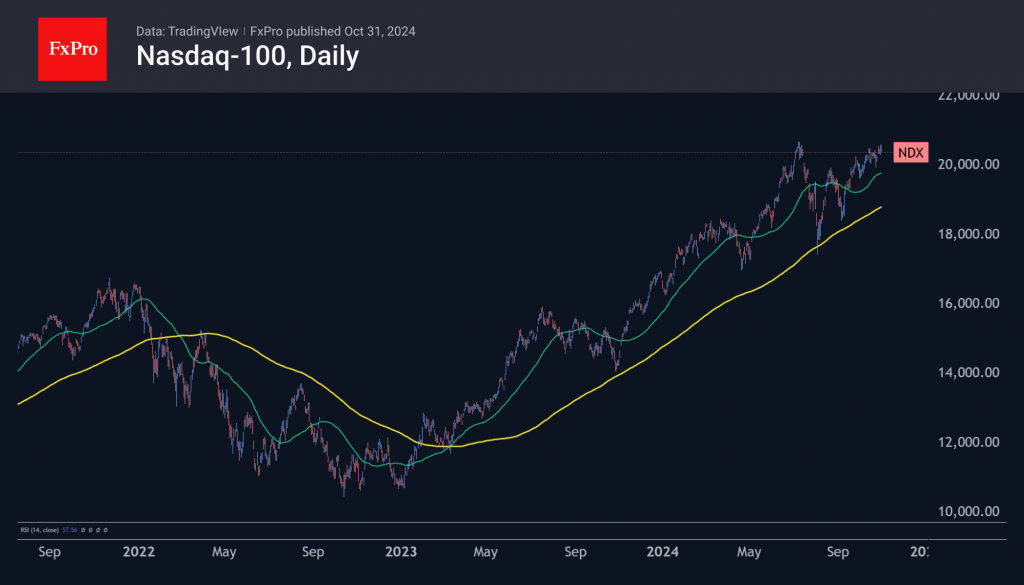
Back then, the Nasdaq100 went down 18% from its July highs, close to bear market territory, and tested the strength of its 200-day moving average before turning upwards. Nowadays, the 200-day moving average is at 18900, and the bear market threshold is at 16600.
Historical seasonality is now on the side of the bulls, both in the six-month outlook and for the rest of the year. But many remember well that the 2022 bear market began in November 2021 with a peak in the Nasdaq.
Stocks
The outgoing week had the most weighted companies reporting. Their combined capitalisation exceeded 50% of the weight of all S&P 500 constituents. The market’s reaction to the performance of the heavyweights was mixed.
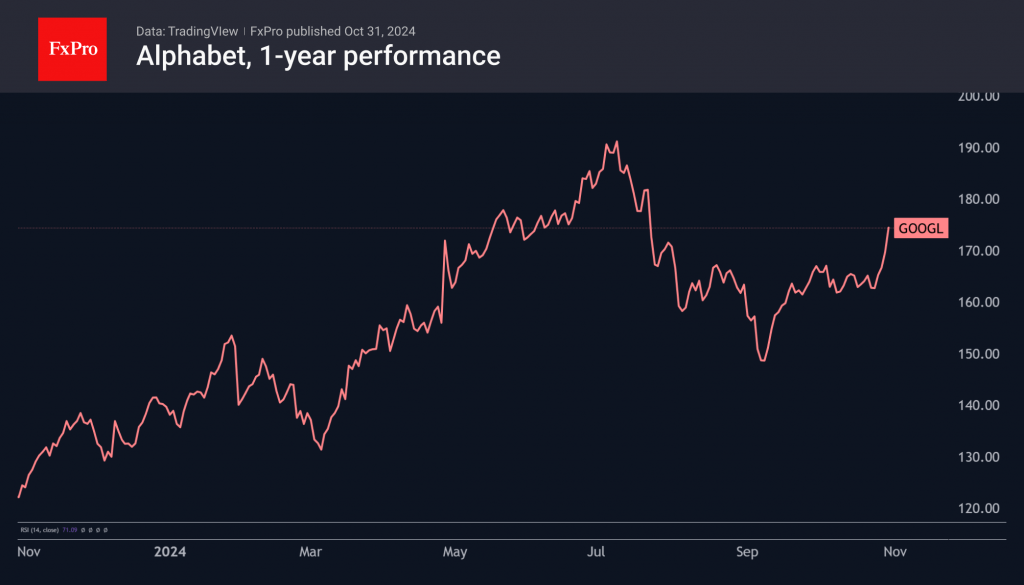
Alphabet has been working on the efficiency of its A.I. solutions, with a focus on lowering the asking price and creating value for advertisers. It seems this shift in focus to practical implementation was needed by investors, who rewarded the company with a 6% rise in its share price after the report, with a slight pullback the next day.
It’s a different story for Microsoft, which lost up to 5% in after-hours trading on unimpressive results from its Azure cloud business. We also see a 5% drop in net margin to 34 billion for the quarter, compared to Alphabet’s 13% rise to 28 billion.
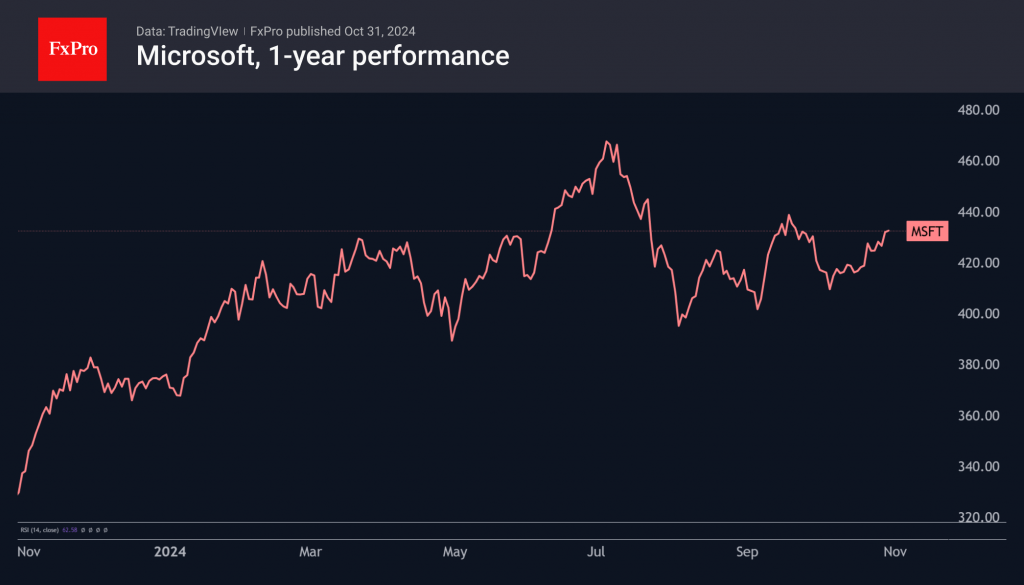
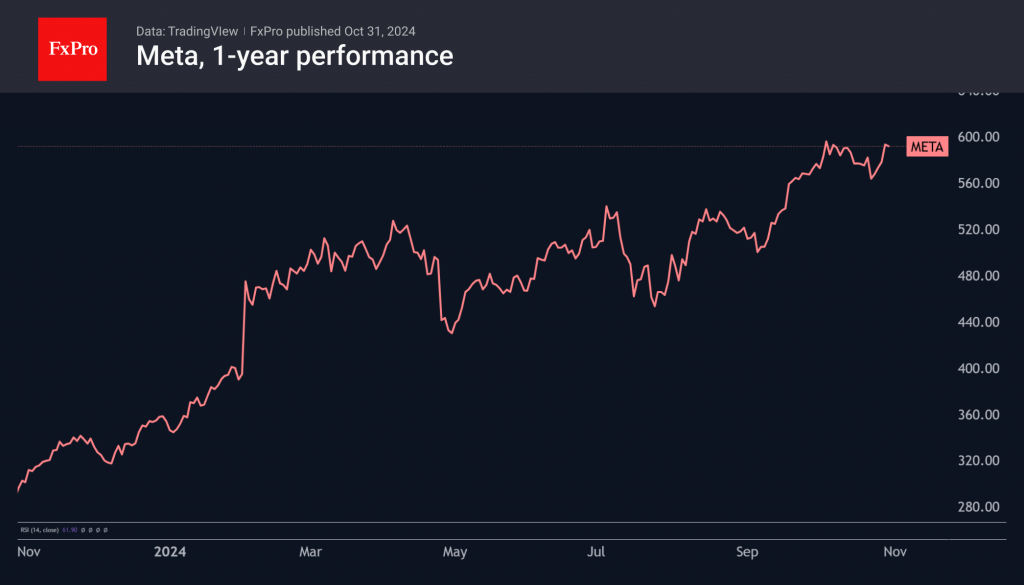
Meta impressively beat forecasts but is losing ground after the report. We attribute this to the outperformance of the share price, which was most pronounced in the second half of the year. Since the beginning of the year, Meta shares have gained more than 70%, while Alphabet has gained 26%, and Microsoft has gained just 16%. By comparison, the benchmark S&P500 is up 23% over the same period.
Nasdaq-100 Wave Analysis
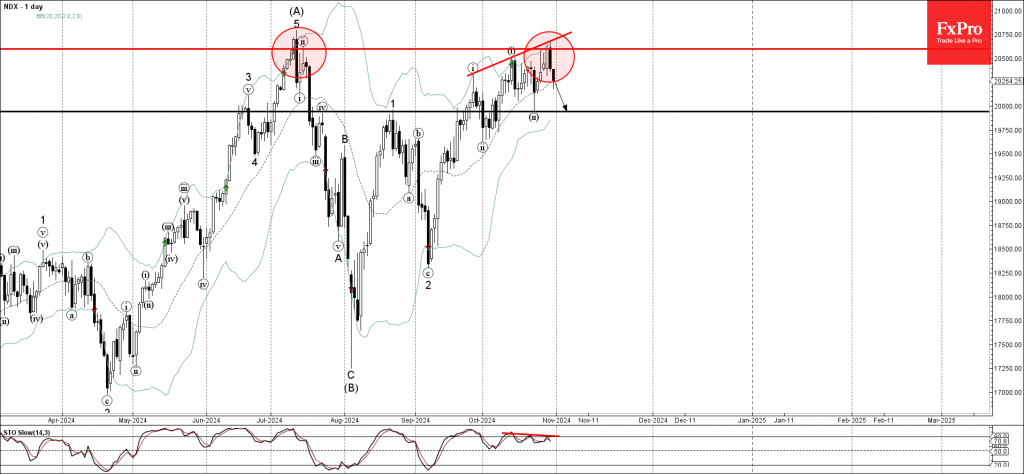
- Nasdaq-100 reversed from resistance level 20600.00
- Likely to fall to support level 20000.00
Nasdaq-100 index recently reversed down from the major resistance level 20600.00 (which stopped the previous sharp upward impulse wave (A) at the start of July), strengthened by the upper daily Bollinger Band.
The downward reversal from the resistance level 20600.00 created the daily Japanese candlesticks reversal pattern Bearish Engulfing.
Given the strength of the resistance level 20600.00 and the triple bearish divergence on the daily Stochastic indicator, the Nasdaq-100 index can be expected to fall further to the next round support level 20000.00 (which stopped the earlier wave ii).
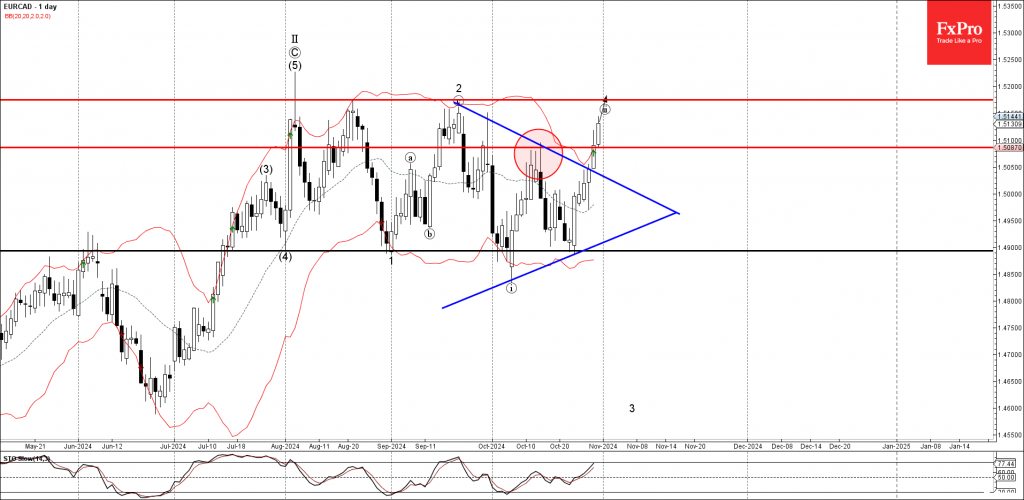
EURCAD Wave Analysis
- EURCAD broke resistance level 1.5085
- Likely to rise to resistance level 1.5175
EURCAD currency pair recently broke the resistance level 1.5085 (which reversed the price in the middle of October).
The breakout of the resistance level 1.5085 was preceded by the breakout of the daily Triangle from September – which accelerated the active wave ii.
Given the continuation of the bearish Canadian dollar sentiment, EURCAD currency pair can be expected to rise to the next resistance level 1.5175 (the former monthly high from September and the target for the completion of the active wave ii).
Oil: Bullish Impulse Expected
Yesterday, West Texas Intermediate (WTI) crude oil was trading at $68.17 per barrel, up by 0.37% over the last 24 hours. So far this year, WTI prices have fallen by 7.18%. Similarly, Brent crude oil was priced at $71.87 per barrel, marking a 0.35% increase in the past day, but it's still down 9.09% year-to-date.
WTI oil hit a 52-week low of $64.78 on September 10, 2024, while Brent reached its low of $68.33 on September 11, 2024. This year's highest prices for WTI and Brent were $87.85 and $92.58, respectively, back in April, which is about 22% higher than where prices currently stand. Historically, Brent crude reached an all-time high of $147.50 per barrel in 2008, whereas WTI prices once dropped as low as negative $40 during the COVID-19 pandemic due to storage issues in the U.S.
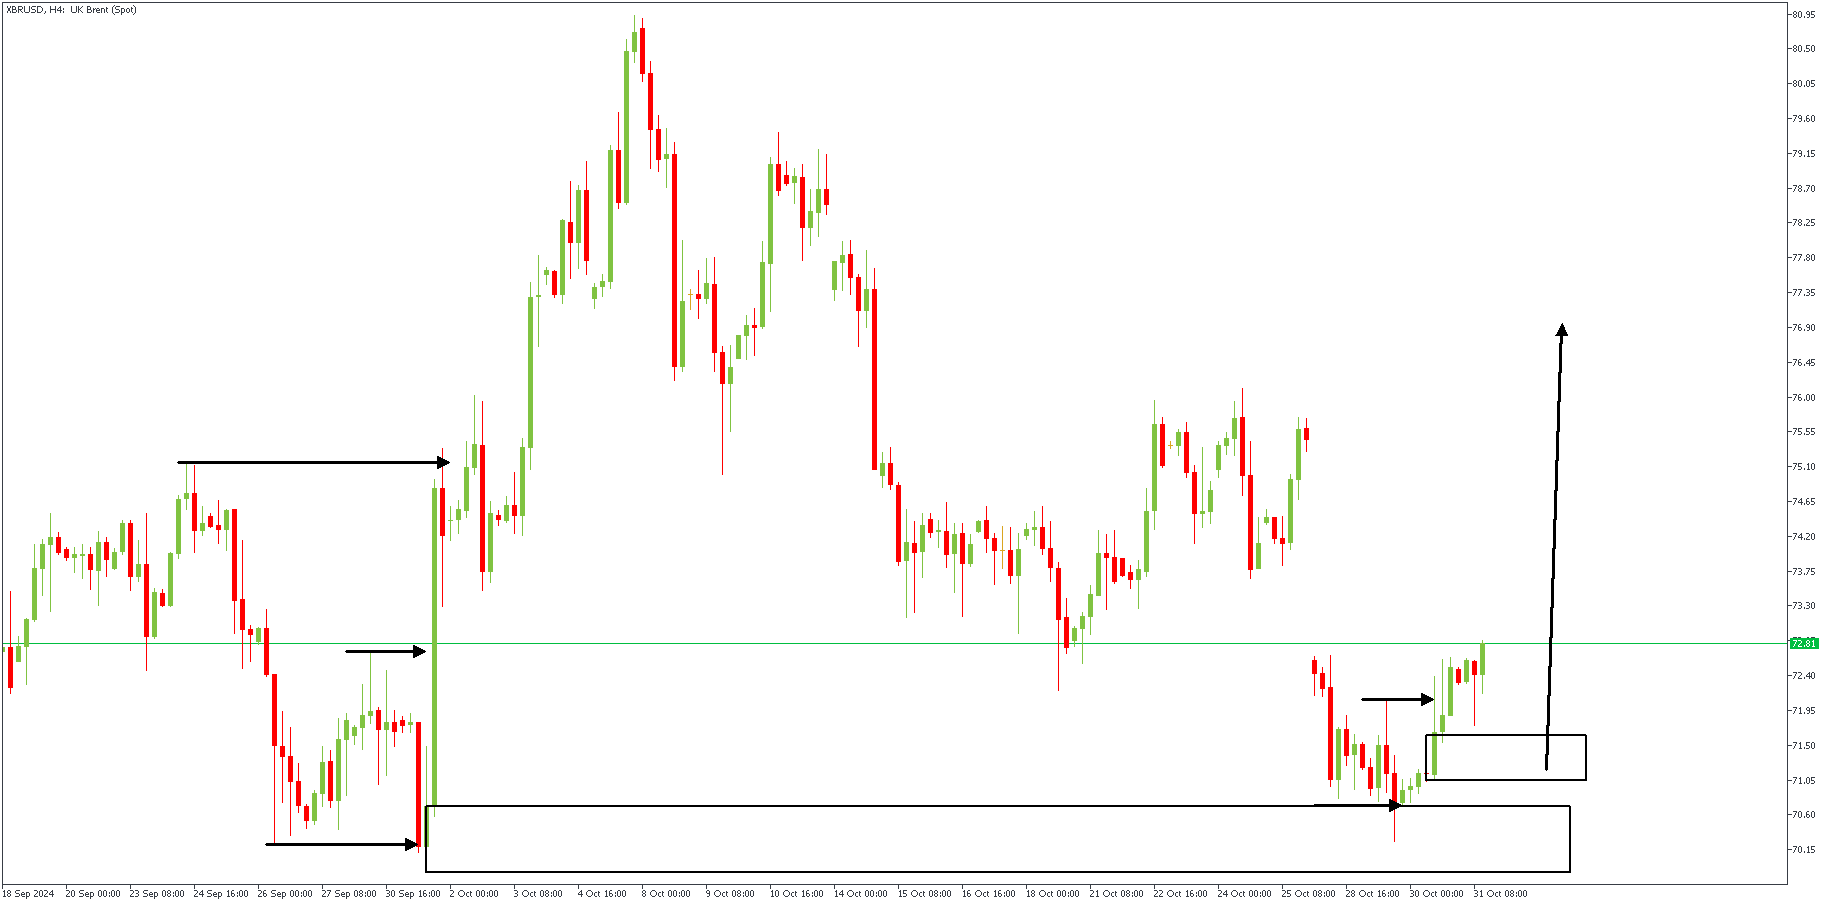
XBRUSD – H4 Timeframe
The 4-hour timeframe chart of XBRUSD shows prices reacting to the demand zone at the base of the previous low. After the price broke above the previous high at the highlighted arrowed lines, it slipped back down to retest the demand zone in preparation for a bullish impulse. It is expected that the price will reach the previous high as its initial target.
Analyst's Expectations:
- Direction: Bullish
- Target:77.34
- Invalidation:69.53
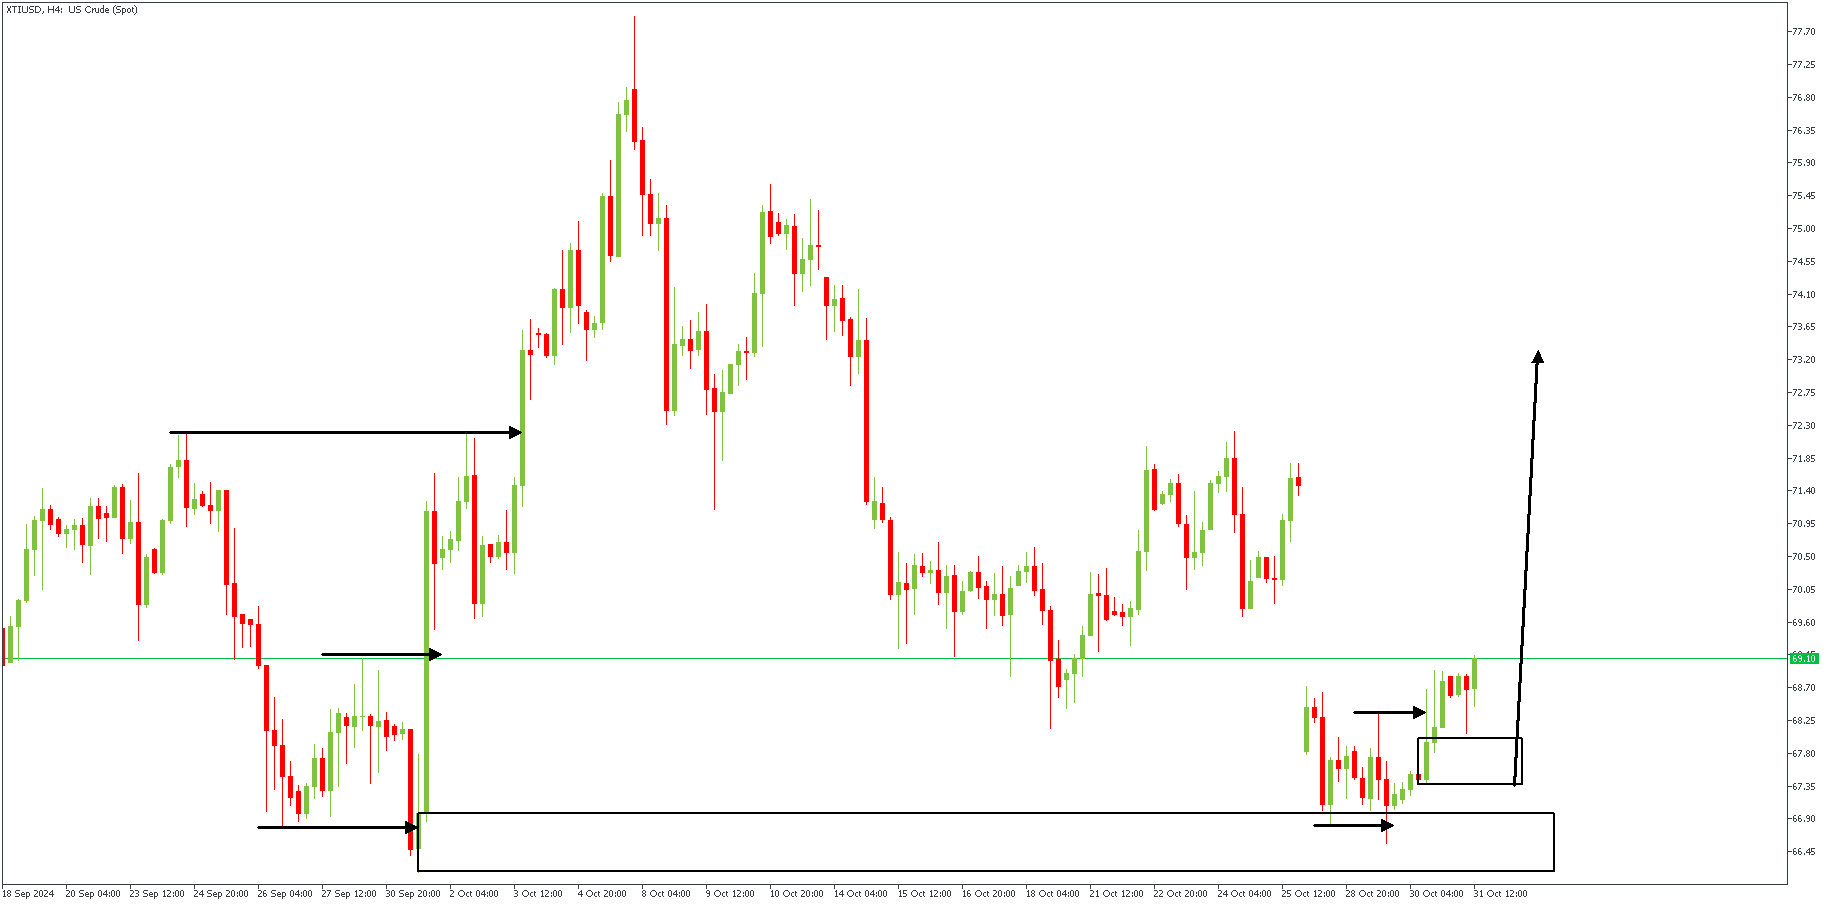
XTIUSD – H4 Timeframe
The price action on West Texas Oil's (WTI) 4-hour timeframe perfectly mirrors all the details from our analysis of Brent. As the price reacted initially from the demand zone, the price is expected to continue on its bullish trajectory until it reaches the previous high.
Analyst's Expectations:
- Direction: Bullish
- Target:73.49
- Invalidation:65.05