Sample Category Title
GBP/USD Mid-Day Outlook
Daily Pivots: (S1) 1.2919; (P) 1.2981; (R1) 1.3025; More...
Intraday bias in GBP/USD remains neutral as range trading continues above 1.2906 temporary low. Further decline is expected as long as 1.3070 minor resistance holds. Below 1.2906 will target 61.8% retracement of 1.2298 to 1.3433 at 1.2732. However, considering bearish divergence condition in 4H MACD, firm break 1.3070 resistance will indicate short term bottoming, and turn bias back to the upside for stronger rebound.
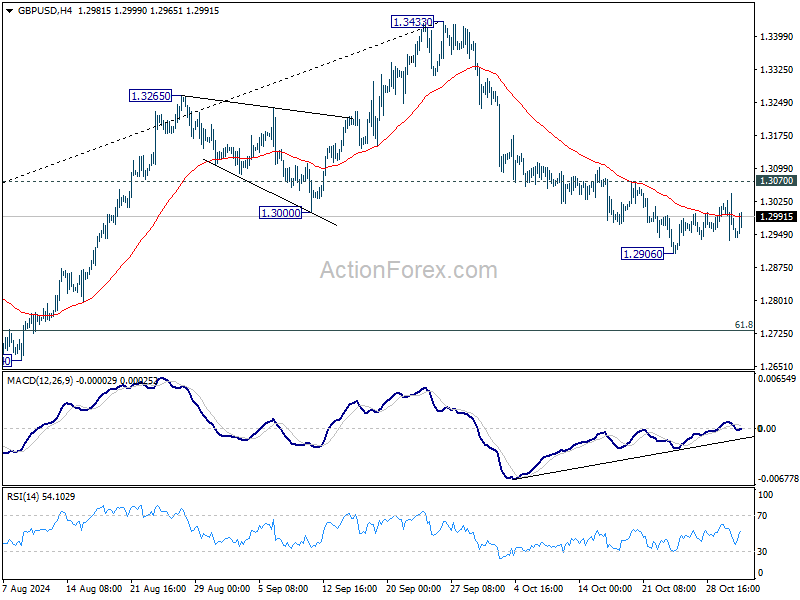
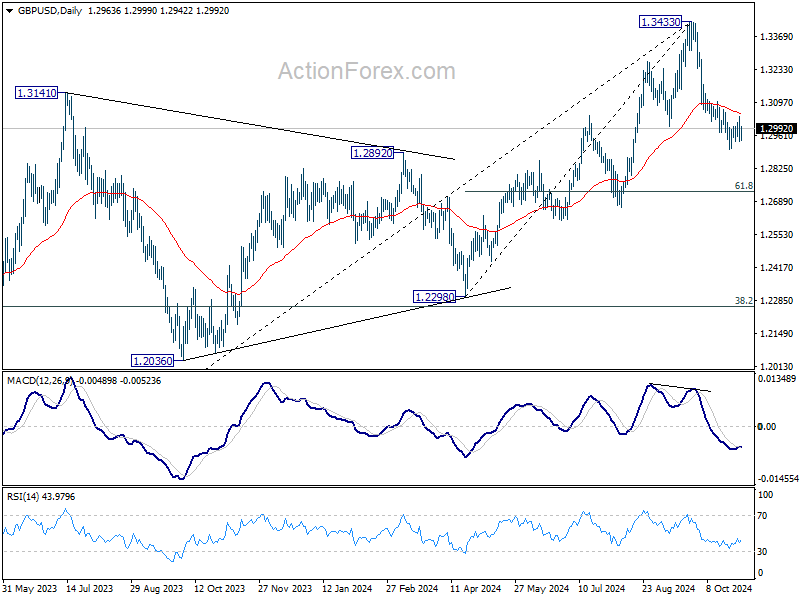
In the bigger picture, considering mildly bearish divergence condition in D MACD, a medium term top is likely in place at 1.3433 already. Price actions from there are seen as correction to whole up trend from 1.0351 (2022 low). Deeper decline would be seen to 38.2% retracement of 1.0351 to 1.3433 at 1.2256, which is close to 1.2298 structural support. Strong support should be seen there to bring rebound.
Euro Gains as Inflation Data Strengthens Hawkish Case for ECB
Euro strengthened broadly after Eurozone's flash CPI revealed stronger-than-expected increase in headline inflation, while the decline in core inflation has come to a halt. This data, coupled with the better-than-anticipated GDP figures released yesterday, has provided substantial support to the hawks within ECB. There appears to be no immediate need for ECB to accelerate monetary easing efforts. A 25 basis point rate cut at the December meeting is being solidified as the baseline.
Yen is also displaying firmness following BoJ decision to maintain its current monetary policy earlier today. Additional support emerged from Governor Kazuo Ueda's remarks during the post-meeting press conference. Markets continue to anticipate the next rate hike to occur in the first quarter of next year. with some interpret Ueda's comments as leaving the possibility open for a December hike. However, two significant uncertainties remain: the formation of Japan's new government after the recent indecisive elections, and the outcome of the US presidential elections next week and their implications for Japan.
Conversely, Dollar is on the softer side stronger-than-expected core PCE inflation reading. For the greenback to regain the dominance observed in recent weeks, robust non-farm payroll data due tomorrow would be essential, especially ahead of next week's elections.
In terms of currency performance for the week, the Euro currently sits at the top of the chart, followed by Sterling and Swiss Franc. Aussie remains at the bottom, followed by Yen and Loonie. Dollar and Kiwi are mixed, occupying middle positions.
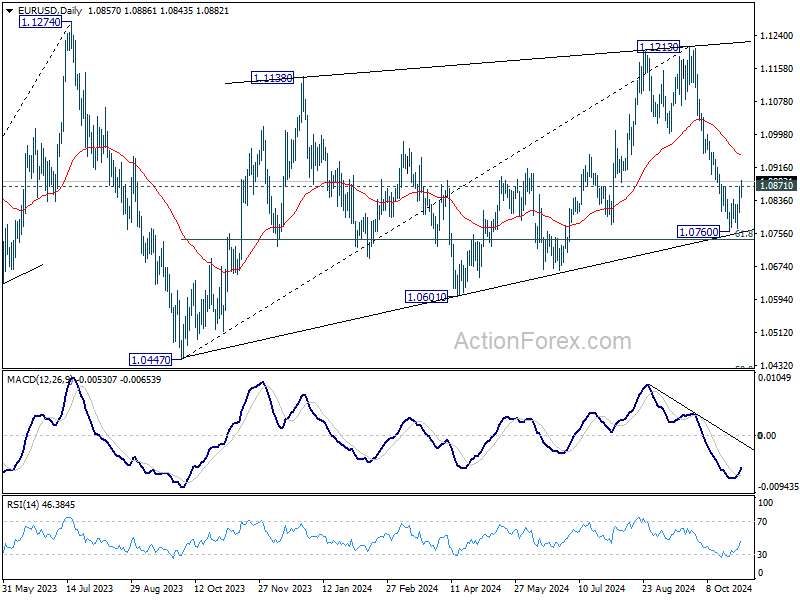
Technically, EUR/USD's break of 1.0871 resistance should confirm short term bottoming at 1.0760, after drawing support from 61.8% retracement of 1.0447 to 1.1213 at 1.0740. Stronger rebound should be seen to 55 D EMA (now at 1.0945). The immediate question is whether other major currency pairs will follow suit and validate the greenbacks' broad pullback.
In Europe, at the time of writing, FTSE is down -0.65%. DAX is down -0.41%. CAC is down -0.79%. UK 10-year yield is up 0.100 at 4.462. Germany 10-year yield is up 0.032 at 2.427. Earlier in Asia, Nikkei fell -0.50%. Hong Kong HSI fell -0.31%. China Shanghai SSE rose 0.42%. Singapore Strait Times fell -0.88%. Japan 10-year JGB yield fell -0.0114 to 0.941.
US core PCE price index unchanged at 2.7% yoy in Sep
In September, US personal income rose by 0.3% mom, or USD 71.6B, slightly below the expected 0.4% mom increase. Meanwhile, personal spending grew by 0.5% mom or USD 105.8B, exceeding forecasts of a 0.4% mom rise.
PCE price index rose 0.2% mom, while core PCE price index, which excludes food and energy, increased by 0.3% mom, both aligning with expectations. Breaking down price components, goods prices decreased by -0.1% mom, and services prices increased by 0.3% mom. Food prices rose by 0.4% mom, while energy prices saw a significant -2.0% mom decline.
On a year-over-year basis, the headline PCE price index edged down from 2.2% yoy to 2.1% yoy, meeting forecasts. However, core PCE price index remained unchanged at 2.7% yoy, slightly above the anticipated 2.6% yoy. Goods prices dropped by -1.2% yoy, while services prices rose by 3.7% yoy. Food prices increased by 1.2% yoy, and energy prices saw a sharp decline of -8.1% yoy.
US initial jobless claims falls to 216k, vs exp 231k
US initial jobless claims fell -12k to 216k in the week ending October 26, below expectation of 231k. Four-week moving average of initial claims fell -2k to 237k.
Continuing claims fell -26k to 1862k in the week ending October 19. Four-week moving average of continuing claims rose 11k to 1869k., highest level since November 27, 2021.
Canada’s August GDP stalls as goods production declines
Canada's GDP growth was flat month-over-month in August, missing the anticipated 0.1% mom growth.
Services sector provided some support, increasing by 0.1% mom, with notable gains in finance, insurance, and public administration.
However, the goods-producing sector contracted by -0.4% mom, marking its lowest point since December 2021, driven by declines in manufacturing and utilities.
Despite the overall stagnation, 12 out of 20 sectors showed growth, indicating resilience across much of the economy.
Early estimates for September indicate a modest recovery, with real GDP expected to rise by 0.3% mom.
Eurozone CPI rises to 2% in Oct, core unchanged at 2.7%
Eurozone CPI rose from 1.7% yoy to 2.0% yoy in October, above expectation of 1.9% yoy. CPI core (energy, food, alcohol & tobacco) was unchanged at 2.7% yoy, above expectation of 2.6% yoy.
Looking at the main components, services is expected to have the highest annual rate in October (3.9%, stable compared with September), followed by food, alcohol & tobacco (2.9%, compared with 2.4% in September), non-energy industrial goods (0.5%, compared with 0.4% in September) and energy (-4.6%, compared with -6.1% in September).
ECB's Lagarde: Inflation target in sight but prudence warranted
In an interview with Le Monde, ECB President Christine Lagarde expressed cautious optimism about Eurozone's inflation path, noting that the target is "in sight" but stressing that inflation is not yet fully subdued. While headline CPI dipped to 1.7% in September, core inflation, excluding energy and food, remained elevated at 2.7%.
Lagarde acknowledged satisfaction with the recent drop in headline inflation but warned that “inflation is going to rise again in the coming months” due to base effects. Thus, she emphasized that "prudence is warranted."
She reiterated the importance of reaching the 2% target "on a sustained and durable basis," projecting that, barring any major shocks, the ECB expects this goal to be achieved by 2025.
ECB’s Panetta calls for easing as inflation declines and economic weakness persists
Italian ECB Governing Council member Fabio Panetta emphasized the need for further easing of restrictive monetary conditions in the Eurozone, citing concerns about economic softness amid declining inflation.
Panetta highlighted in a speech today that as inflation moderates, it’s essential to consider “the weakness of the real economy” and avoid deepening the downturn.
"In the absence of a firm recovery we would run the risk of pushing inflation well below target, a situation that monetary policy would struggle to counter, and which must be avoided," he added.
BoJ maintains rate at 0.25% on unanimous vote
BoJ kept its uncollateralized overnight call rate steady at approximately 0.25% in a unanimous decision, aligning with market expectations. The central bank indicated that if the outlook for economic activity and prices materializes as anticipated, it will "accordingly continue to raise the policy interest rate and adjust the degree of monetary accommodation." This signals readiness to tighten monetary policy further, contingent on economic developments.
Nevertheless, BoJ emphasized the necessity of paying close attention to the "future course of overseas economies," particularly the US, along with developments in financial and capital markets due to their impact on Japan's economic activity and price outlook.
In its latest economic projections, the BoJ made the following adjustments:
Real GDP Growth:
- Fiscal 2024: Unchanged at 0.6%.
- Fiscal 2025: Revised upward from 1.0% to 1.1%.
- Fiscal 2026: Unchanged at 1.0%.
CPI Core (excluding fresh food):
- Fiscal 2024: Unchanged at 2.5%.
- Fiscal 2025: Revised downward from 2.1% to 1.9%.
- Fiscal 2026: Unchanged at 1.9%.
CPI Core-Core (excluding fresh food and energy):
- Fiscal 2024: Increased from 1.9% to 2.0%.
- Fiscal 2025: Unchanged at 1.9%.
- Fiscal 2026: Unchanged at 2.1%.
BoJ’s Ueda has no preset idea on the timing of next hike
Following BoJ’s decision to maintain its current interest rate, Governor Kazuo Ueda said at the press conference that the central bank has "no preset idea" on the timing of its next rate increase. He added that each policy decision will be based on a thorough assessment of the latest economic data and outlook revisions.
Ueda highlighted promising signs from the latest Tokyo CPI data, observing that the "pass-through of rising wages on services prices is broadening." He added that BoJ will closely monitor whether this trend spreads across the nation.
Domestically, wages and prices are generally moving in line with BoJ forecasts, and recent changes in companies' wage- and price-setting behaviors over the past two years point to a potential structural shift. However, Ueda acknowledged that it’s uncertain whether this shift will gain momentum or fade over time.
Ueda also pointed out the importance of currency volatility and commodity prices, as these factors significantly impact domestic import prices.
While recent political developments in Japan are unlikely to alter BoJ’s price forecasts, Ueda noted that substantial policy changes could prompt revisions as needed.
Japan’s industrial production rises 1.4% mom in Sep, continues to fluctuate indecisively
Japan’s industrial production increased by 1.4% mom in September, exceeding expectations of 0.8%. This recovery follows a sharp -3.3% mom drop in August when a typhoon disrupted operations across various sectors.
Out of the 15 industrial sectors surveyed, 10, including motor vehicles and chemical production, recorded growth. Five sectors, such as production machinery, saw declines.
Despite this recovery, the Ministry of Economy, Trade and Industry maintained its cautious view, describing industrial production as “fluctuating indecisively.”
Looking ahead, manufacturers polled by the ministry expect a robust 8.3% mom increase in output for October, followed by a -3.7% mom decline in November, indicating ongoing volatility in Japan’s production.
Meanwhile, Japan’s retail sales rose by a modest 0.5% yoy in September, falling significantly short of the anticipated 2.3% yoy growth.
China’s NBS PMI manufacturing rises to 50.1, first expansion in six months
China’s NBS Manufacturing PMI increased to 50.1 in October, meeting expectations and marking the first expansion since April. The improvement was led by large enterprises, which rose to 51.5 from 50.6, while medium-sized firms inched up to 49.4. Small enterprises, however, saw a further contraction, declining to 47.5 from 48.5.
Key subindices pointed to slight domestic improvement: production reached a six-month high of 52.0, and new orders returned to neutral at 50.0 after five months of contraction.
Though still below 50, subindices for employment (48.4), purchases (49.3), imports (47.0), and backlog of orders (45.4) showed smaller declines, suggesting a gradual stabilization.
However, new export orders continued to weaken, reaching an eight-month low at 47.3, underscoring soft external demand.
Non-Manufacturing PMI edged up from 50.0 to 50.2, just shy of the 50.5 forecast, with the employment subindex rising by 1.1 points to 45.8.
NZ ANZ business confidence hits 10-yr high , optimism grows on lower interest rates
New Zealand’s ANZ Business Confidence surged from 60.9 to 65.7 in October, marking its highest level in a decade and reflecting a wave of optimism among businesses.
This renewed confidence is supported by a range of positive indicators: the outlook for own activity increased slightly from 45.3 to 45.9, while export intentions jumped from 13.8 to 17.1, the highest since September 2018. Investment intentions also surged from 9.2, reaching 20.0, the highest level since June 2021, and employment intentions rose from 11.8 to 14.2, the highest since November 2021.
Several key metrics highlight this optimism. Cost expectations dropped from 66.8 to 64.2, indicating some relief in business expenses, while wage expectations edged up slightly from 76.4 to 77.0. Pricing intentions also rose, climbing from 42.8 to 44.2, suggesting businesses may feel confident in passing some costs to consumers. Profit expectations strengthened from 22.2 to 27.0, and inflation expectations continued their downward trend, dipping from 2.92% to 2.82%.
According to ANZ, "steady falls in interest rates" have provided a strong boost to business sentiment, encouraging growth across multiple sectors.
Australia’s retail sales show modest 0.1% mom growth in Sep
Australia’s retail sales turnover increased by a modest 0.1% mom in September, reaching AUD 36.46B but falling short of the expected 0.4% mom rise. This follows a 0.7% gain in August and a flat outcome in July.
Commenting on the data, Robert Ewing, Head of Business Statistics at ABS, noted that “retail spending held firm in September” following a boost in August from warmer-than-usual weather.
The report also highlighted quarterly retail sales volumes, which grew by 0.5% in Q3, marking a recovery after back-to-back declines of -0.4% in both Q2 and Q1.
Ewing added that this increase in volumes reflects “some of the lost ground in discretionary spending this year,” marking only the second quarterly rise in retail volumes over the past two years.
GBP/USD Mid-Day Outlook
Daily Pivots: (S1) 1.2919; (P) 1.2981; (R1) 1.3025; More...
Intraday bias in GBP/USD remains neutral as range trading continues above 1.2906 temporary low. Further decline is expected as long as 1.3070 minor resistance holds. Below 1.2906 will target 61.8% retracement of 1.2298 to 1.3433 at 1.2732. However, considering bearish divergence condition in 4H MACD, firm break 1.3070 resistance will indicate short term bottoming, and turn bias back to the upside for stronger rebound.
In the bigger picture, considering mildly bearish divergence condition in D MACD, a medium term top is likely in place at 1.3433 already. Price actions from there are seen as correction to whole up trend from 1.0351 (2022 low). Deeper decline would be seen to 38.2% retracement of 1.0351 to 1.3433 at 1.2256, which is close to 1.2298 structural support. Strong support should be seen there to bring rebound.
Canada’s August GDP stalls as goods production declines
Canada's GDP growth was flat month-over-month in August, missing the anticipated 0.1% mom growth.
Services sector provided some support, increasing by 0.1% mom, with notable gains in finance, insurance, and public administration.
However, the goods-producing sector contracted by -0.4% mom, marking its lowest point since December 2021, driven by declines in manufacturing and utilities.
Despite the overall stagnation, 12 out of 20 sectors showed growth, indicating resilience across much of the economy.
Early estimates for September indicate a modest recovery, with real GDP expected to rise by 0.3% mom.
US initial jobless claims falls to 216k, vs exp 231k
US initial jobless claims fell -12k to 216k in the week ending October 26, below expectation of 231k. Four-week moving average of initial claims fell -2k to 237k.
Continuing claims fell -26k to 1862k in the week ending October 19. Four-week moving average of continuing claims rose 11k to 1869k., highest level since November 27, 2021.
US core PCE price index unchanged at 2.7% yoy in Sep
In September, US personal income rose by 0.3% mom, or USD 71.6B, slightly below the expected 0.4% mom increase. Meanwhile, personal spending grew by 0.5% mom or USD 105.8B, exceeding forecasts of a 0.4% mom rise.
PCE price index rose 0.2% mom, while core PCE price index, which excludes food and energy, increased by 0.3% mom, both aligning with expectations. Breaking down price components, goods prices decreased by -0.1% mom, and services prices increased by 0.3% mom. Food prices rose by 0.4% mom, while energy prices saw a significant -2.0% mom decline.
On a year-over-year basis, the headline PCE price index edged down from 2.2% yoy to 2.1% yoy, meeting forecasts. However, core PCE price index remained unchanged at 2.7% yoy, slightly above the anticipated 2.6% yoy. Goods prices dropped by -1.2% yoy, while services prices rose by 3.7% yoy. Food prices increased by 1.2% yoy, and energy prices saw a sharp decline of -8.1% yoy.
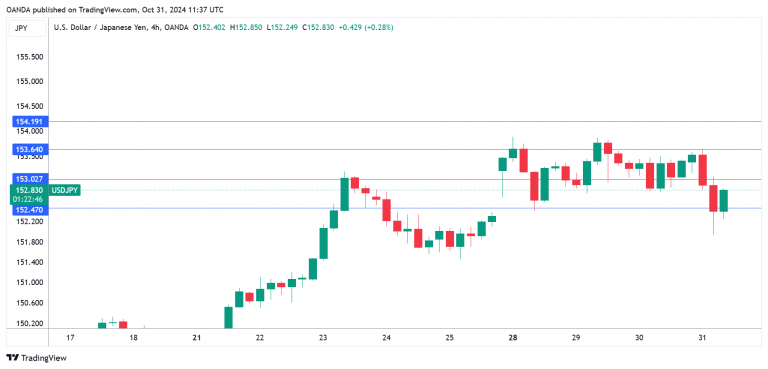
USD/JPY Soars on BoJ’s Ueda Comments
The Japanese yen has surged on Thursday after showing little movement this week. In the European session, USD/JPY is trading at 152.68, at the time of writing, down 0.48% on the day. Earlier, USD/JPY rose as high as 0.9% before retracting.
Bank of Japan stays on the sidelines
The Bank of Japan didn’t have any surprises up its sleeve and held interest rates at 0.25% at today’s policy meeting. The BoJ released updated growth and inflation forecasts, but these didn’t provide any clues about rate moves as the forecasts had only minor revisions.
Governor Ueda said at a press conference that “inflation was moving in line with our forecasts” towards the 2% target, but added that he had no “preset idea” as to the timing of a rate hike. Ueda said that the central bank would make its rate decisions based on the data, which means that investors shouldn’t expect any broad signals from the BoJ about its rate path.
Ueda made reference to the currency markets and that has sent the yen flying higher. Ueda stated that the currency markets have had a strong impact on Japan’s economy. The markets took this as a possible indication that a rate hike will be sooner rather than later, although the BoJ is likely to wait until early 2025 before raising interest rates.
The BoJ has intervened in the currency markets when the yen depreciated quickly and another intervention could be in the works, as the yen has had a miserable October, falling 6.3%.
The political uncertainty is not helping the wobbly yen. Japan’s general election left the ruling Liberal Democratic Party without a majority and it’s unclear if Prime Minister Ishiba will be able to cobble together a government.
USD/JPY Technical
- USD/JPY tested support at 153.02 earlier. The next support level is 152.47
- 153.64 and 154.19 are the next resistance lines
ECB’s Panetta calls for easing as inflation declines and economic weakness persists
Italian ECB Governing Council member Fabio Panetta emphasized the need for further easing of restrictive monetary conditions in the Eurozone, citing concerns about economic softness amid declining inflation.
Panetta highlighted in a speech today that as inflation moderates, it’s essential to consider “the weakness of the real economy” and avoid deepening the downturn.
"In the absence of a firm recovery we would run the risk of pushing inflation well below target, a situation that monetary policy would struggle to counter, and which must be avoided," he added.
Eurozone CPI rises to 2% in Oct, core unchanged at 2.7%
Eurozone CPI rose from 1.7% yoy to 2.0% yoy in October, above expectation of 1.9% yoy. CPI core (energy, food, alcohol & tobacco) was unchanged at 2.7% yoy, above expectation of 2.6% yoy.
Looking at the main components, services is expected to have the highest annual rate in October (3.9%, stable compared with September), followed by food, alcohol & tobacco (2.9%, compared with 2.4% in September), non-energy industrial goods (0.5%, compared with 0.4% in September) and energy (-4.6%, compared with -6.1% in September).
US Nonfarm Payroll Report: Market Insights
Navigating the complex waves of the financial markets requires an astute understanding of various economic indicators. Among them, the nonfarm payroll report stands out as a pivotal monthly metric that can significantly sway financial markets. This article demystifies the intricacies of this influential report, walking through what to know before trading it.
Nonfarm Payroll Definition
The nonfarm payroll (NFP) is a key economic barometer that tallies the number of employed individuals in the US, excluding the agricultural sector. Besides the farm workers, government, private household, and nonprofit organisation workers are not included.
This nonfarm payroll, meaning the workforce in industries like manufacturing, services, construction, and goods, reflects the health of corporate America and, by extension, the US economy. It’s one of the components of the Employment Situation report released on the first Friday of every month by the US Bureau of Labor Statistics. Nonfarm employment change data is released along with unemployment rate and average hourly earnings data.
Given its encompassing nature, the NFP and its importance to economic vitality makes it a beacon for investors and traders, who see the data as a projection of economic trends and an influencer of the Federal Reserve's monetary policy. Fluctuations in NFP numbers can cause significant movements in currency, bond, and stock markets.
The Nonfarm Payroll Report and Market Volatility
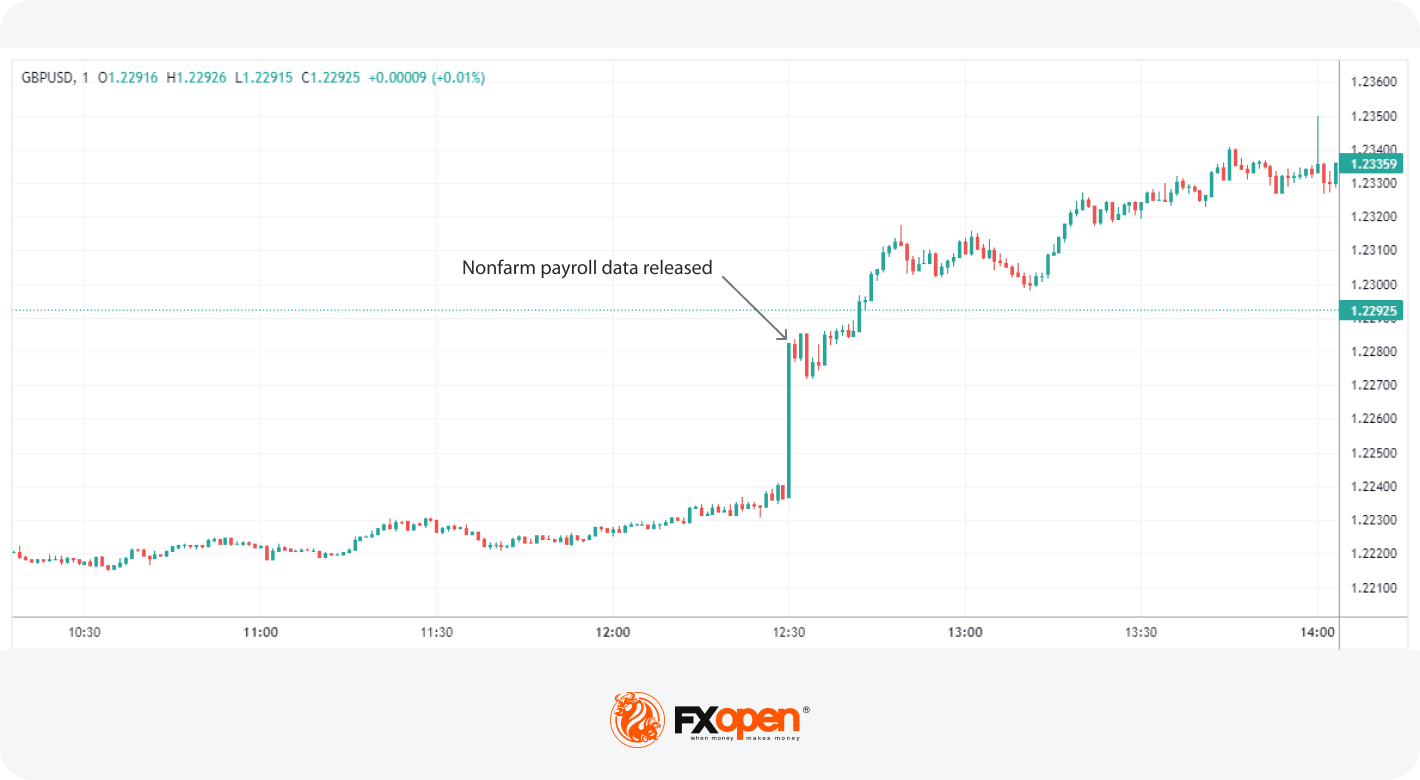
The release of NFP figures is a major event on the economic calendar, often triggering heightened market volatility. As nonfarm payroll news hits the wires, traders and investors brace for potential rapid swings in asset prices, particularly in the forex market. The immediate aftermath can see significant fluctuations in currency pairs with the US dollar. The anticipation and reaction to the nonfarm payroll in forex markets exemplify the weight this report carries.
Impact of NFP on USD Pairs
The nonfarm payroll report has a profound influence on USD pairs. When the NFP data is released, traders immediately compare the figures to market expectations, leading to price adjustments based on how well the actual data aligns with analyst forecasts. The broader trend of NFP data is also important, but it generally takes a backseat compared to actual vs expected figures.
For example, if the report indicates stronger-than-expected job growth, the US dollar typically strengthens, especially against currencies like the euro, yen, and pound. A robust employment outlook suggests economic health, potentially raising expectations for tighter monetary policy from the Federal Reserve.
On the flip side, if the NFP numbers fall short of expectations, the US dollar may weaken, particularly if the data points to economic slowdown or stagnation. In such cases, currencies like the euro or Japanese yen might rise against the dollar, as traders speculate that the Federal Reserve could delay interest rate hikes or even consider easing measures to boost the economy.
The NFP report also reverberates through other major currency markets. For instance, currencies in economies closely tied to US trade and investment—such as the Canadian dollar or Mexican peso—may experience volatility as changes in US employment data often reflect shifts in economic demand for their goods and services.
The Role of Employment Rates and Wages in Market Sentiment
Within the US nonfarm payroll release, two key indicators—unemployment rates and average hourly earnings (month-on-month)—are pivotal in influencing market sentiment.
Unemployment Rates
The unemployment rate measures the percentage of the labour force actively seeking employment but currently without a job. A falling unemployment rate generally signals that more people are finding work, a positive indicator for economic growth.
As a result, equities may rally, and the US dollar often strengthens, particularly if the data beats expectations. Traders interpret lower unemployment as a sign of economic resilience, which could influence the Federal Reserve to maintain or tighten monetary policy, further boosting the dollar.
Conversely, a rising unemployment rate may signal economic weakness, spurring concerns over reduced consumer spending and slowing economic activity. This could lead investors to shift towards so-called safer assets like bonds or gold.
In the forex market, a rising unemployment rate tends to weaken the US dollar as it lowers expectations for interest rate hikes and prompts speculation about potential stimulus or rate cuts by the Federal Reserve, further pressuring the dollar and encouraging risk-off sentiment.
Average Hourly Earnings
Alongside unemployment, average hourly earnings (m/m) is another key metric that traders closely monitor. This indicator tracks changes in wages from one month to the next and offers insight into inflationary trends.
When average hourly earnings rise, it can indicate that workers have more disposable income, which can increase consumer spending. Higher wages often fuel concerns about inflation, prompting markets to anticipate interest rate hikes to combat potential overheating in the economy. This expectation typically strengthens the US dollar.
However, if average hourly earnings come in below expectations or show signs of stagnation, markets may interpret this as a sign of weaker inflationary pressures. In such cases, traders may anticipate a more dovish stance from the Federal Reserve, potentially delaying or even reversing interest rate hikes. This can weigh on the US dollar and boost equities.
Execution Tactics for the Nonfarm Payroll Report Release
On the day the NFP data is released, specific execution tactics tailored to the NFP's unique market footprint can add substantial value. Due to the potential for rapid price movements, traders narrow their focus to liquid markets, like EUR/USD, USD/JPY, and GBP/USD, to facilitate quick entries and exits. They’ll typically trade on the 1m, 2m, 5m, or 15m charts and often require platforms built with speed in mind, like FXOpen’s advanced TickTrader platform.
Nonfarm payroll trading involves comparing the actual data against market expectations. The outcomes can typically be categorised as follows, with each scenario influencing forex markets differently:
- As Expected: Currency values may experience minimal immediate impact if the report aligns with analyst forecasts, as the anticipated news is already priced into the market.
- Better than Expected: A robust report can boost the US dollar, as higher employment rates suggest economic strength, potentially leading to rising interest rates.
- Worse than Expected: Conversely, weak employment figures can devalue the US dollar, reflecting economic concerns and pressuring policymakers towards accommodative measures.
Given the volatility, many traders prefer limit orders to manage slippage, potentially ensuring they enter the market at predetermined points. Lastly, spreads can widen substantially, inadvertently triggering a stop loss. Some traders choose to set a wider stop loss than normal for this reason.
Traders usually monitor not just the headline number but also revisions of previous reports and associated metrics, such as unemployment rate and wage growth, which can influence market sentiment. High-speed news feeds and an economic calendar containing nonfarm payroll dates are employed to access the numbers in real-time, enabling immediate analysis.
Analysing Unemployment and Wage Growth Numbers Together with NFP
When trading around the nonfarm payroll release, it's essential to look beyond the headline number and integrate unemployment and wage growth data into your analysis. The NFP number alone can drive initial market reactions, but combining it with unemployment and wage growth figures provides a more nuanced view of the economy’s direction.
Traders start by comparing the trends across these three metrics. For example, if the NFP report shows strong job creation but unemployment remains stubbornly high, this could indicate that the economy is absorbing a larger labour force, potentially due to discouraged workers returning to job-seeking. This dynamic might lead to a more muted market response, as the overall labour market picture is mixed.
On the other hand, rising average hourly earnings alongside strong US nonfarm payrolls often signals not just employment growth but increasing inflationary pressure. If wages grow faster than expected, especially when paired with a low unemployment rate, it could indicate that labour shortages are driving up pay, raising inflation risks and making Federal Reserve action more likely. In this scenario, traders might anticipate a stronger US dollar, as higher interest rates become more probable.
To streamline your analysis during nonfarm payrolls, consider the following approach:
- Aligning Expectations: Traders compare actual numbers for NFP, unemployment, and wage growth with analyst forecasts. If NFP and wages grow but the unemployment rate falls, the market is likely to favour USD strength, while mixed results can trigger choppier price action as traders digest the implications.
- Gauging Momentum: Looking at the broader trend can provide further insight. If unemployment has been trending down and wages are steadily increasing (i.e. an expanding economy), the overall market sentiment may remain bullish even if NFP slightly underperforms. Conversely, if there’s a rising unemployment rate despite decent NFP growth, it could signal that the economy is slowing down.
- Assessing Policy Impact: It’s good to know how the Federal Reserve might interpret the combined data. For instance, moderate NFP growth with stagnant wage numbers may not trigger immediate policy shifts, allowing for more accommodative conditions in the near term. However, strong wage growth and low unemployment alongside robust NFP numbers are more likely to prompt a hawkish response.
Trading the NFP: A Strategy
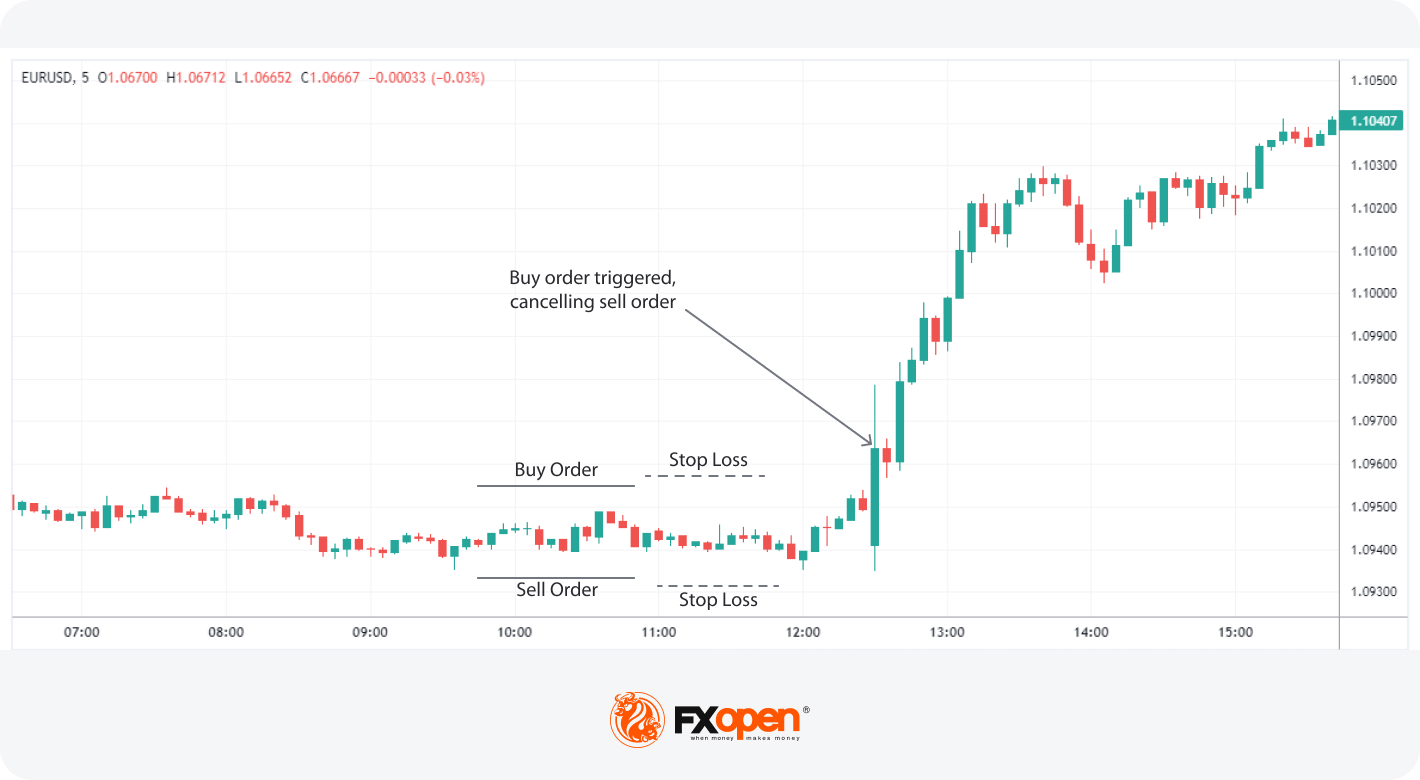
Traders often consider analytical nonfarm payroll predictions to calibrate their strategies. However, an approach to take advantage of whichever direction the market takes uses an OCO (One Cancels the Other) order. This order straddles the current price range just before the report is released. Such a strategy prepares the trader for movement in either direction, as the NFP release can generate a significant breakout from the prevailing range.
According to theory, the strategy unfolds:
- An OCO order is placed with one order above the current price range and another below it. This setup positions the trader to catch the initial surge regardless of its direction.
- Stop losses might be set on the opposite side of the pre-report range to potentially manage risk.
- Profit targets might be established within a four-hour window post-release, aiming for a favourable risk/reward ratio, such as 1:3.
- Alternatively, a trailing stop may be utilised, adjusting above or below newly formed swing points to protect potential returns as a trend develops.
Such strategies allow traders to potentially capitalise on the new trend direction ushered in by the NFP data.
Risk Management When Trading NFP
Trading the NFP report often brings heightened volatility, making risk management crucial for protecting capital during these market swings. Below are some key risk management practices often employed when trading the NFP:
- Awareness of Spreads: Spreads can widen substantially during NFP releases. This can trigger even wide stop losses; tight stop losses can suffer extreme slippage, where the stop loss execution price differs substantially from the desired price.
- Conservative Position Sizing: Some traders take smaller positions when entering pre- and post-NFP release. The increased volatility when the report is released can lead to slippage and greater-than-anticipated losses as a consequence. Likewise, post-release conditions can also be unpredictable if data is mixed.
- Avoiding Overtrading: Aim to be selective with trades to avoid chasing price swings in a highly reactive market. It might be preferable to wait for a clear direction to emerge before entering a trade.
Comparative Analysis with Other Economic Indicators
The NFP report serves as a primary mover in the forex market, but its full value is best understood in concert with other economic indicators. Investors compare its findings with the Consumer Confidence Index for insights into spending trends, as employment health can influence consumer optimism and spending behaviours.
Likewise, juxtaposing NFP data against the Gross Domestic Product (GDP) figures provides a more complete narrative of the economic cycle since higher employment typically signals increased production and economic growth. Additionally, assessing the Consumer Price Index (CPI) and Producer Price Index (PPI) alongside NFP numbers can offer insight into inflationary pressures; strong employment data may point to higher inflation, a significant factor in central bank policy decisions.
The Bottom Line
In closing, learning how to trade nonfarm payroll data today may sharpen your market acumen and create exciting trading opportunities in the future. For those ready to apply these insights when NFP data is released, opening an FXOpen account provides access to over 700 markets, high-speed trade execution, tight spreads from 0.0 pips, and low commissions from $1.50. Happy trading!
FAQ
What Is NFP and How Does It Work?
The NFP meaning refers to the nonfarm payroll report, data that measures the number of jobs added in the US economy, excluding the agricultural sector. Released on the first Friday of every month by the US Bureau of Labor Statistics, the NFP is a key indicator of economic health, affecting currency, bond, and stock markets.
How Does Nonfarm Payroll Affect the Stock Market?
NFP data can drive stock market volatility. Strong job growth signals economic strength, often boosting equities. Conversely, weak NFP figures may indicate a slowing economy, leading to stock market declines as investors anticipate weaker corporate earnings.
What Happens When NFP Increases?
An NFP increase suggests robust job growth, typically strengthening the US dollar and stock markets, as investors expect economic expansion and potentially tighter monetary policy from the Federal Reserve.
Why Is Nonfarm Payroll So Important?
An NFP report is crucial because it reflects the overall health of the US labour market and economy. Traders and investors use the data to gauge economic trends, determine Federal Reserve actions, and understand where markets are headed.
This article represents the opinion of the Companies operating under the FXOpen brand only. It is not to be construed as an offer, solicitation, or recommendation with respect to products and services provided by the Companies operating under the FXOpen brand, nor is it to be considered financial advice.
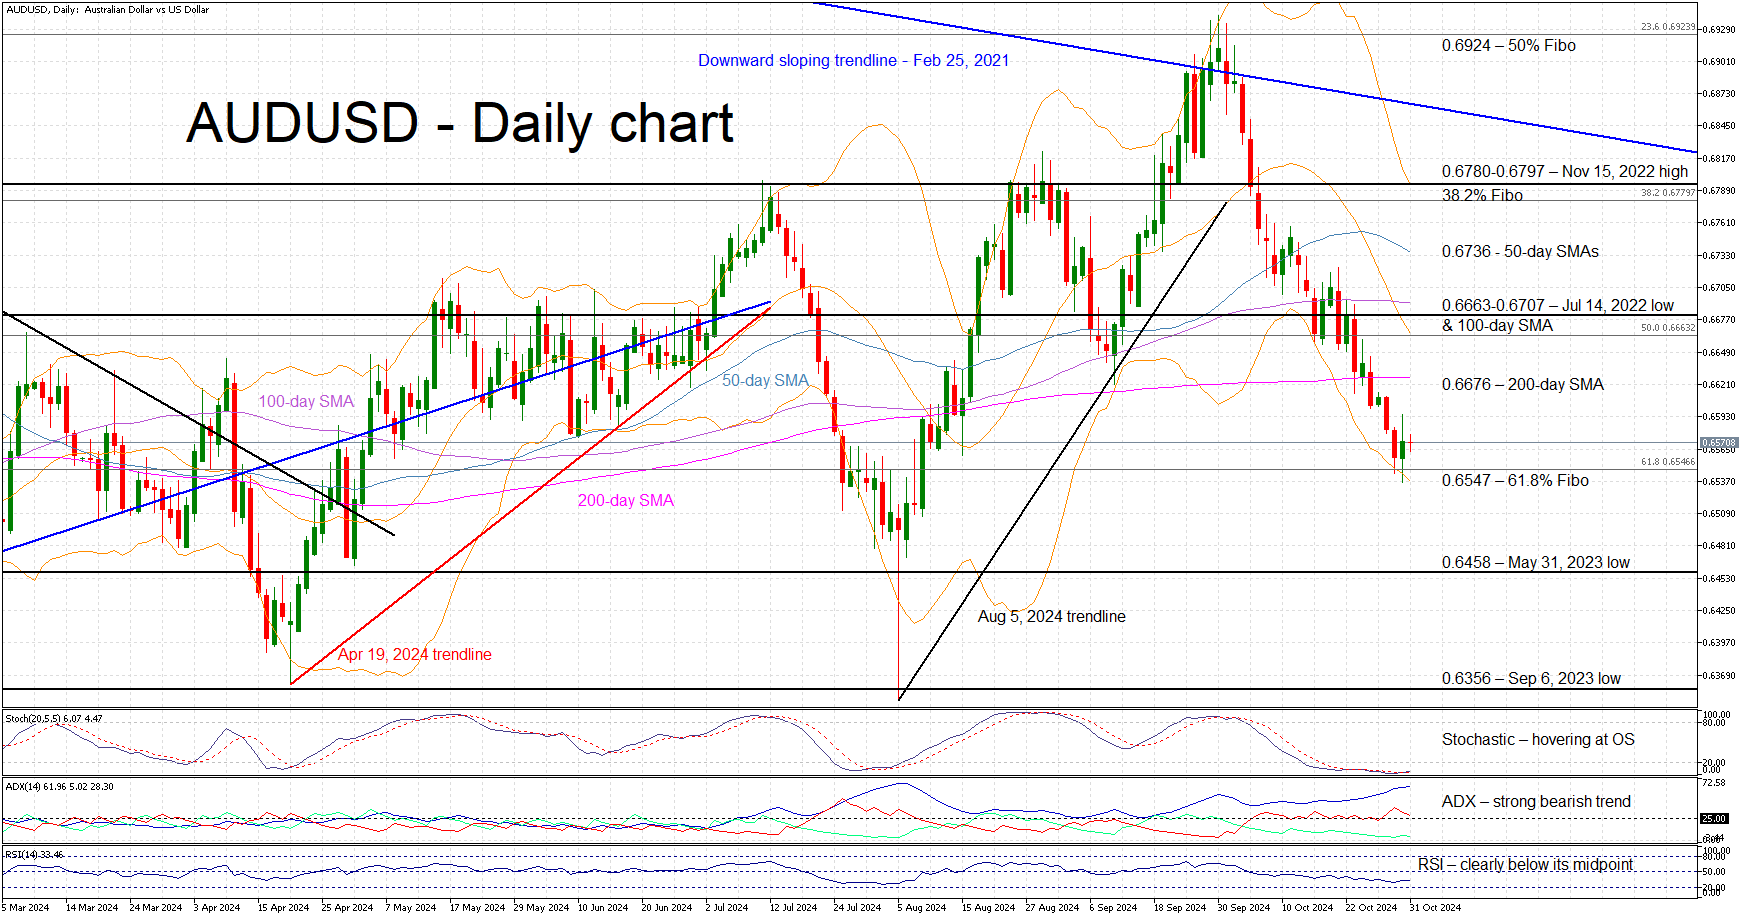
Could AUDUSD Selloff Pause Temporarily?
- AUDUSD is trading sideways, a tad above 0.6547
- The downtrend from the September 30 high remains in place
- Momentum indicators are mostly bearish
AUDUSD is trading sideways today, a tad above 0.6547. The bearish trend from the September 30 peak remains firmly in place, and, quite interestingly, AUDUSD bulls have failed, up to now, to stage an upleg and temporarily interrupt the ongoing selloff. The market’s focus is on the US presidential election although this week’s US data could also materially impact the dollar’s performance.
The momentum indicators are bearish at this juncture. In more detail, the Average Directional Movement Index (ADX) is edging higher and thus signalling a strong bearish trend in AUDUSD, while the RSI is comfortably trading below its 50-midpoint. Interestingly, the stochastic oscillator is hovering inside its oversold territory (OS), but it has failed, up to now, to climb above its moving average (MA). A move above both its MA and OS could be the signal the bulls have been waiting for in order to finally stage a small rally.
Should the bears remain hungry, they could try to break below the 61.8% Fibonacci retracement level of the October 13, 2022 – February 2, 2023 uptrend at 0.6547. The door could then open for a move towards the March 31, 2023 low at 0.6458, with the next plausible target being the September 6, 2023 low at 0.6536.
On the other hand, the bulls are desperate for a small upleg. They could firstly try to keep AUDUSD above the 0.6547 level and then gradually push it higher towards the 200-day simple moving average (SMA) at 0.6676. If successful, they could then test the resistance set by the busier 0.6663-0.6707 area, which is populated by the July 14, 2022 low and the 100-day SMA.
To sum up, AUDUSD bears remain in control and potentially in a strong position for next big US events starting with Friday’s job report.