Sample Category Title
UK Budget Preview: GBP/USD, GBP/JPY and EUR/GBP Price Action Ideas
- UK Autumn Budget anticipation mounts as markets remain calm, unlike during the ‘Trussonomics’ era.
- GBP/USD faces a critical juncture at the 1.3000 level, with potential for both upside and downside breaks.
- GBP/JPY nears the 200.00 handle, a daily close above could trigger a run towards July highs.
The GBP has steadily gained ground against the majority of G7 counterparts with the exception of the US Dollar and Euro. The British Pound has held steady against the Euro and the USD as markets await more clarity on the rate cycles of the three central banks.
Over the last few weeks there appears to be a growing divergence in the expectations for the Federal Reserve and its counterparts at the Bank of England and the European Central Bank. Markets are starting to price in the possibility of more aggressive rate cuts from the latter two with the Fed seeing a reduction in rate cut expectations.
The change for the US Dollar has come from ongoing data releases which paint a positive picture for the US economy. The British Pound on the other hand has seen a significant drop in its latest services inflation print which came in well below the 5.5% the BoE projected for the end of 2024. This has ramped up rate cut expectations for the BoE and has weighed slightly on the Pound. Now all attention turns to the UK budget due tomorrow.
UK Autumn Budget
Attention now turns to the highly anticipated Autumn Budget in the UK which is also the first under the recently elected Labor Government. There are a host of questions regarding the UK budget with memory still fresh for many regarding the disaster of the ‘Trussonomics mini budget’ in 2022.
However, there are some important differences this time around and it seems markets are calm ahead of the event. There does not appear to be any political risk premium this time around with ING research pointing to a short-term EUR/GBP fair value at 0.834. Remember that in previous instances of political/gilt-related turmoil in the UK, the EUR/GBP risk premium was around 3-5%.
Secondly, CFTC figures from October 22 point to speculators holding a long bias on the British Pound. Traders held the largest net-long positions in GBP among G10 currencies, making up 32% of open interest, and these positions have resisted the shift back to the dollar seen in other major currencies.
The key issues to pay attention to in the budget tomorrow include tax changes, fiscal rule changes and growth objectives and targets. The Labour manifesto emphasized in particular the importance of striking a “balance between prioritizing investment and the urgent need to rebuild our public finances”. This strikes a particular chord after Rachel Reeves stated last week that the Labor Government would look to redefine public debt in the budget. This has sparked some interest and it will be interesting to see how the Chancellor aims to do this.
This change, according to Reeves, aims to allow for increased borrowing to fund infrastructure and investment projects, potentially unlocking up to £50 billion. Reeves emphasized that this borrowing would be for long-term investments rather than day-to-day spending, aiming to boost economic growth and job creation.
Public Sector Balance Sheet (% of GDP)
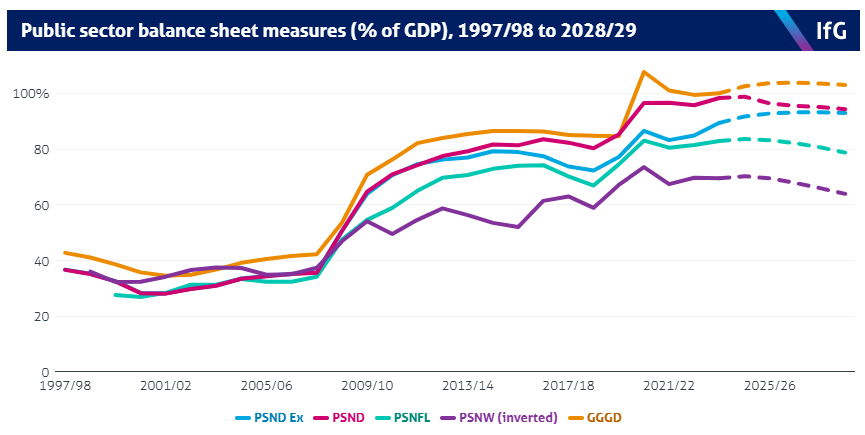
Source: IFG
Tax on the wealthy is another sticking point of tomorrow’s budget. Looking back historically however, this would not be the first time the incoming Government has delivered tax hikes. In every fiscal event following an election since 1992, the chancellor has increased taxes.
All in all it promises to be an interesting one, although many would hope not as interesting as the now infamous Trussonomics budget of 2022.
Technical Analysis
GBP/USD
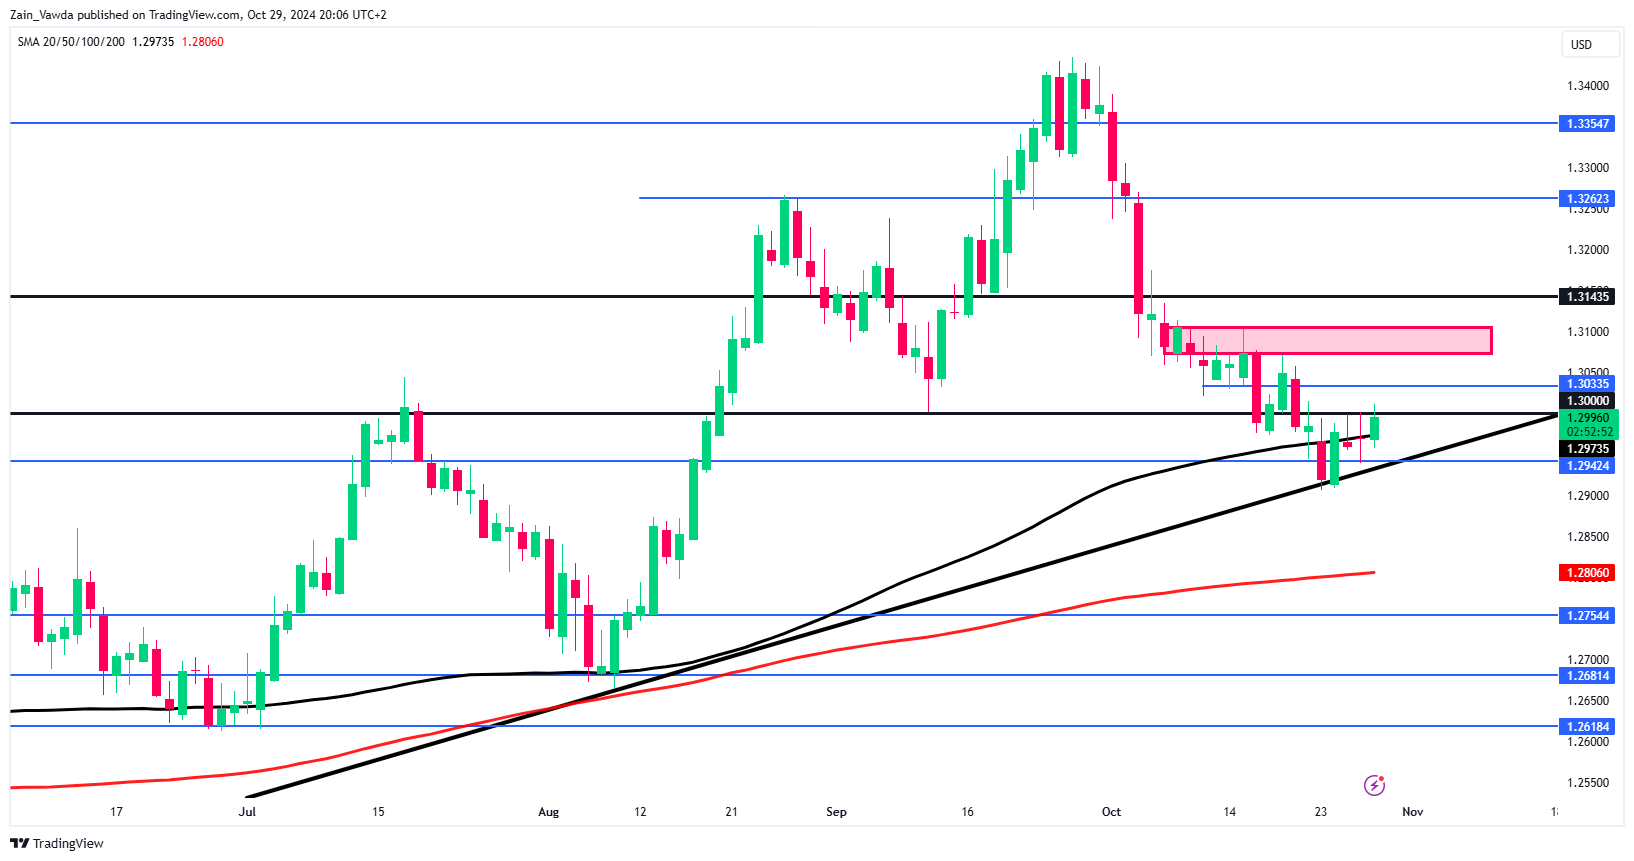
From a technical standpoint, GBP/USD is at a very important level with the 1.3000 psychological level in play. A daily candle close below this level could open up further downside for the pair.
A daily candle close above the 1.3000 level has proved elusive for the better part of a week. This leaves cable vulnerable to further downside with a potential run toward the 1.2800 area growing ever more appealing. Following my previous piece on GBP pairs where I had hoped for further gains above 1.3000, the technicals are beginning to point to the possibility of a break to the downside. .
There are two scenarios that could develop in the day/days ahead. The first one being a break and daily candle close above the 1.3000 handle which could open up further upside.
The second scenario, is a push lower and a break of the ascending trendline, this would open up a run toward support at 1.28060 (200-day MA).
Support
- 1.2950 (100-day MA)
- 1.2900
- 1.2806 (200-day MA)
Resistance
- 1.3040
- 1.3100
- 1.3143
GBP/USD Daily Chart, October 29, 2024
Source: TradingView.com (click to enlarge)
GBP/JPY
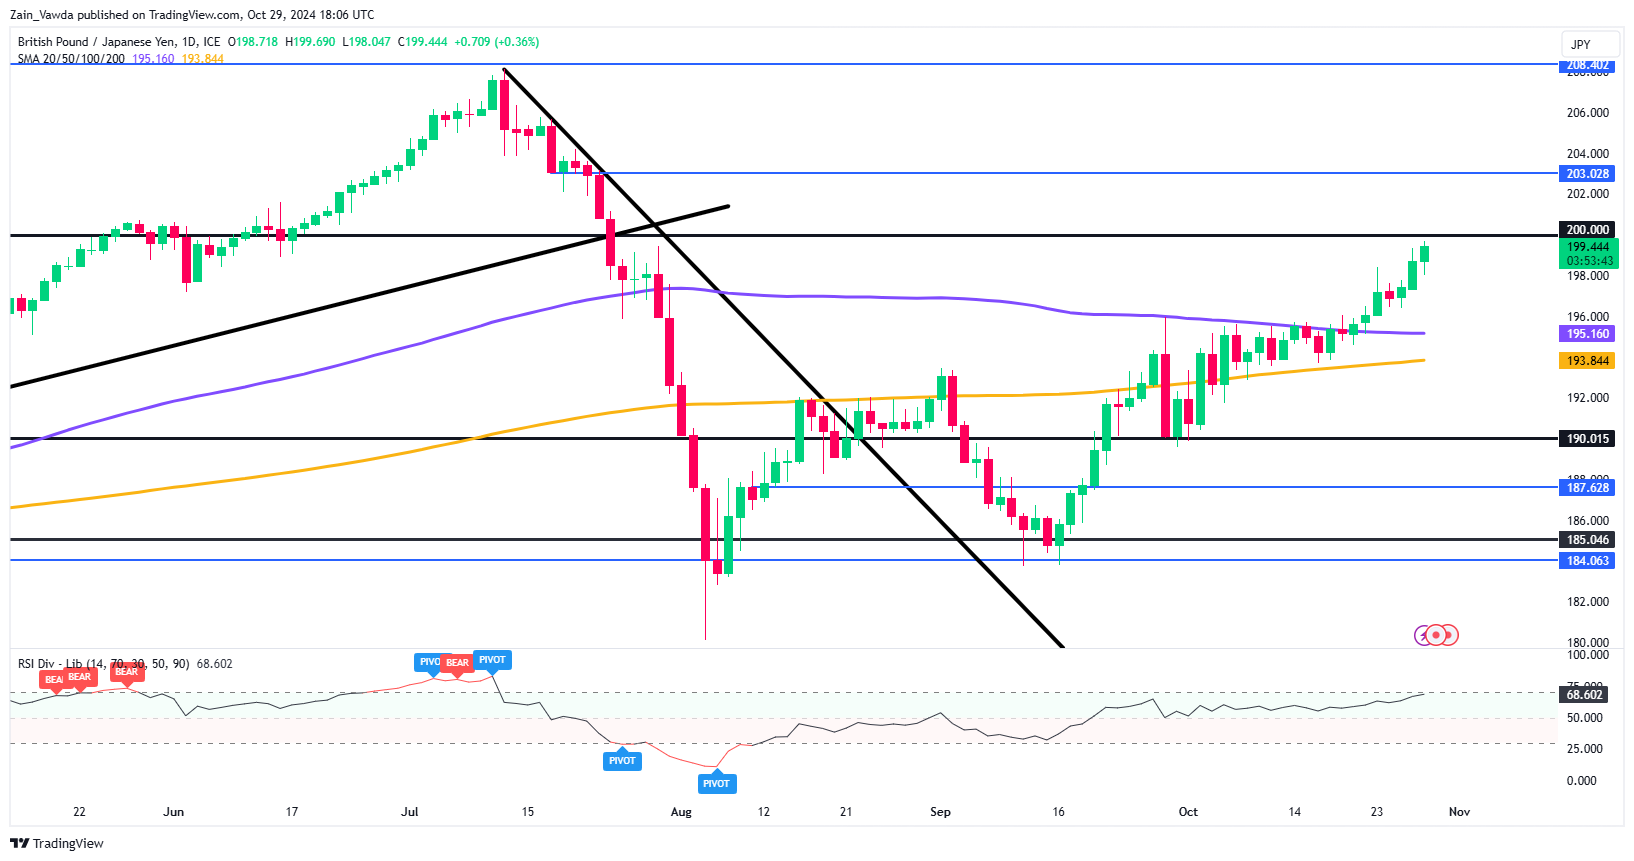
GBP/JPY has been inching its way higher since bottoming out on August 5. There was another push down to the mid 180s on September 16 before the move higher began once more.
GBP/JPY broke above the 200-day MA as mentioned in my October 16 article before making a run toward the 200.00 handle. A high today of 199.690 leaves GBP/JPY at a critical junction heading into tomorrow’s budget.
On a daily chart, a daily candle close above the 200.00 handle tomorrow could open up GBP/JPY for a run toward its July highs at 207.57. There may be some resistance around the 203.00 handle which could lead to a pullback as the RSI is currently just shy of overbought territory.
Weakness in the British Pound tomorrow could bring the GBP/JPY toward the 200-day MA resting at the 195.00 handle. There is also another area of support resting at 193.84 before the 190.00 handle comes into focus.
GBP/JPY Daily Chart, October 29, 2024
Source: TradingView.com (click to enlarge)
Support
- 195.16 (200-day MA)
- 193.84
- 190.00
Resistance
- 200.00
- 203.00
- 207.57
EUR/GBP
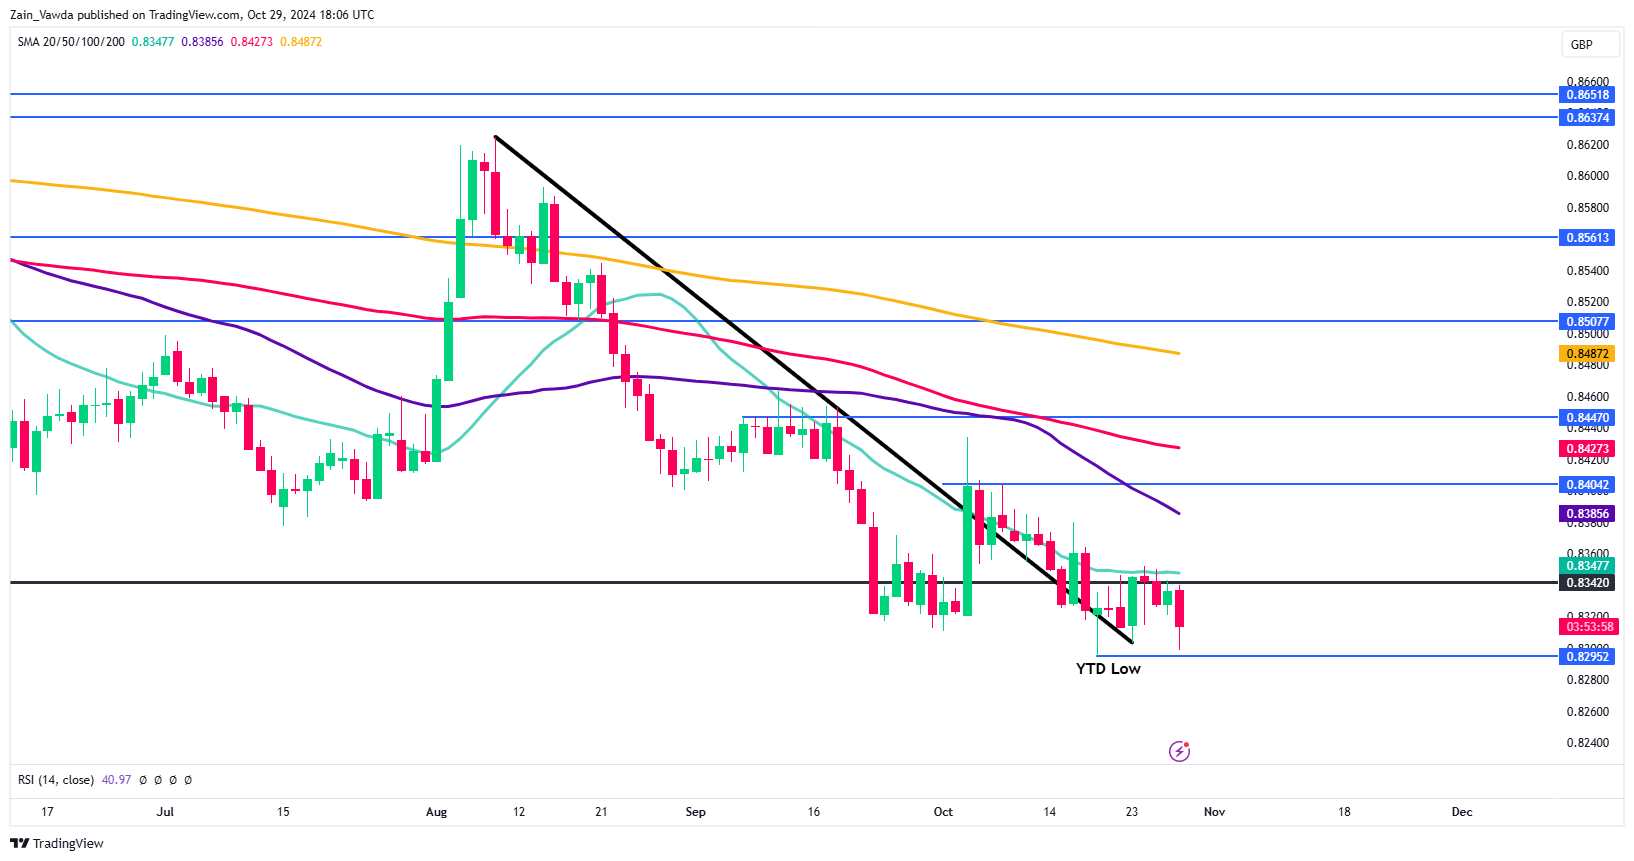
EUR/GBP remains near the YTD low around the 0.8300 handle. The pair is struggling to gain acceptance above the confluence level of 0.8345 which is a confluence area.
Immediate resistance rests at 0.8342 with the 50 day MA resting at 0.8385 likely to provide some resistance as well. The region between 0.8400-0.8487 plays host to the 100 and 200-day MAs as well as the most recent swing high.
Conversely, should the GBP strengthen in light of the UK budget tomorrow then the YTD lows around 0.8295 will likely be broken before the 2022 lows around 0.8200 comes into focus.
EUR/GBP Daily Chart, October 29, 2024
Source: TradingView.com (click to enlarge)
Support
- 0.8300
- 0.8250
- 0.8200
Resistance
- 0.8345
- 0.8400
- 0.8447
Gold Wave Analysis
- Gold broke resistance level 2750.00
- Likely to rise to resistance level 2800.00
Gold recently broke above the minor resistance level 2750.00 (which stopped the previous minor impulse wave 1 earlier this month).
The breakout of the resistance level 2750.00 should accelerate the active intermediate impulse sequence (5) from the start of October.
Given the strong daily uptrend, Gold be expected to rise further toward the next resistance level 2800.00 (target price for the completion of the active impulse wave (5)), coinciding with the resistance trendline of the daily up channel from September.

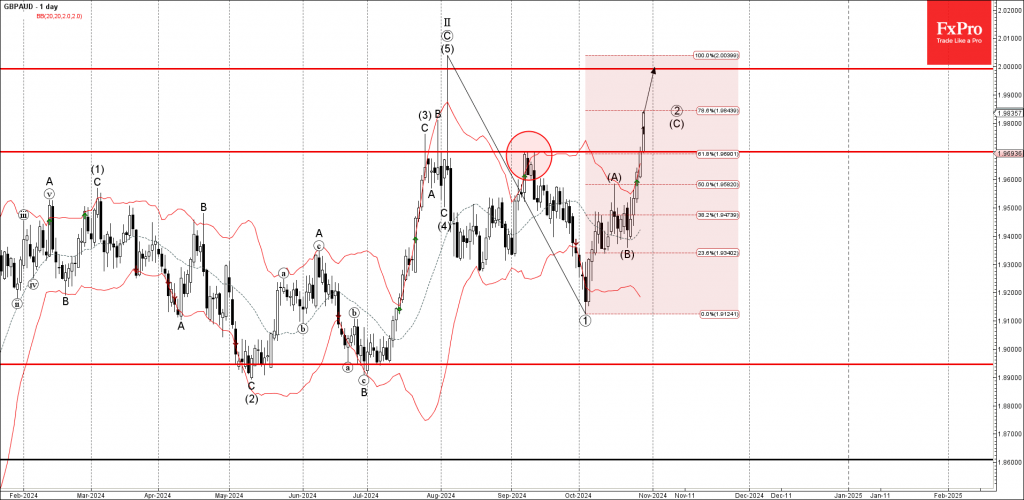
GBPAUD Wave Analysis
- GBPAUD broke resistance zone
- Likely to rise to resistance level 2.0000
GBPAUD currency pair recently broke the resistance zone located between the resistance level 1.9700 (former multi-month high from September) and the 61.8% Fibonacci correction of the downward impulse from August.
The breakout of this resistance zone accelerated the impulse wave (C) of the primary ABC correction 2 from the start of October.
GBPAUD be expected to rise further in the active impulse wave (C) toward the next round resistance level 2.0000 (which stopped the sharp upward impulse wave (5) in August).
Sunset Market Commentary
Markets
The busy eco calendar kicked off today with US JOLTS job openings and consumer confidence. The former missed the bar. The August reading was revised down from 8.04mln to 7.86mln and job vacancies came down further in September to 7.44mn, way off the 8mn mark. It was the lowest reading since early 2021 and for the first time this cycle dropped below the pre-pandemic high (7.6 mn). Given the Fed’s sensitivity towards the labour market and employment, US yields in a kneejerk reaction wiped out (almost) all of the intraday gains (5-7 bps). The larger-than-expected improvement in consumer confidence halted the move though. The Conference Board indicator in October jumped from 99.2 to 108.7 vs 99.5 expected. It’s the highest level since January of this year. Joe Sixpack turned more optimistic on the current situation (123.8 to 138) and sees a rosier future ahead. The expectations component (from 82.8 to 89.1) recovered to levels not seen since December 2022. The chief economist at the Conference Board noted that “views on the current availability of jobs rebounded after several months of weakness, potentially reflecting better labor market data.” US yields currently still add between 0.4-2 bps in a small steepening of the curve. German Bunds underperform with yields adding 2.5-4 bps in a similar curve shift. UK gilt yields eke out a few bps as well ahead of tomorrow’s long-awaited budget proposal. The 2-yr yield is currently testing a 5-month high, the 10-yr is setting one. US data and technical support areas nearby allowed EUR/USD to recover from a low around 1.077 to back above 1.08. USD/JPY holds steady around 153.3, keeping DXY in place as well at 104.41. Sterling’s audacious attempt to seize the EUR/GBP 0.83 big figure failed for the time being. EUR/GBP is nonetheless down for the day (0.831).
The Slovak Republic launched a new 7-yr syndication (Nov 6, 2031) deal today. With their second and final syndication of the year following a €3bn 10-yr deal in March they raised €2bn, priced at MS+70 bps (compared to MS+90 area initial guidance). Books ran above €7.5bn. Via multiple regular and a special auction in February, Ardal also raised €7.2bn year-to-date. Combined with a small FX-deal (CHF; €0.65bn), the total raised so far amounts to €12.85bn. The original long-term funding target from the start of the year stood at €13bn (€5bn redemptions, €7.6bn deficit) but could be revised lower due to a lower cash deficit (+/- €5.8bn). Part of today’s proceeds could therefore be used in prefunding for next year. The 2025 funding target will be €12-13bn stemming from €6.5bn bond redemptions and a forecasted deficit of €6.4bn. Ardal targets to raise €6bn via regular monthly auctions and €6bn via syndications.
News & Views
News agency Reuters reports that China is mulling approving the issuance of over CNY 10tn in extra debt in the next few years. It would be split between CNY 6tn of special sovereign bonds and CNY 4tn worth of special-purpose bonds for idle land and property purchases over the next 5 years. China’s NPC is looking to approve the fresh fiscal package on the last day of the November 4-8 meeting. In case Donald Trump wins a second term in office, Beijing may even decide on a stronger fiscal package according to sources. Under impulse of dollar strength, USD/CNY rose to its strongest level since the end of August (USD/CNY 7.14).
The Swedish Riksbank published its new Business Survey today. The general tone is that it’s hard to see any improvement in the near term. The manufacturing industry no longer believes that the economy will improve in the near future, and optimism in the retail trade sector has also declined compared with the spring. The export industry is feeling the effects of weaker demand from the rest of the world, which is reflected in the continued fall in new orders. The construction sector believes that it will take even longer to see a clear upturn in the demand for housing. Weak demand is putting pressure on selling prices. The fact that inflation and interest rates have fallen suggests that the wage bargaining rounds will not get out of hand. Today’s Business Survey strengthens the case for a 50 bps Riksbank rate cut at the next, November 7, meeting. EUR/SEK is unmoved near 11.50, the weakest SEK level since mid-August.
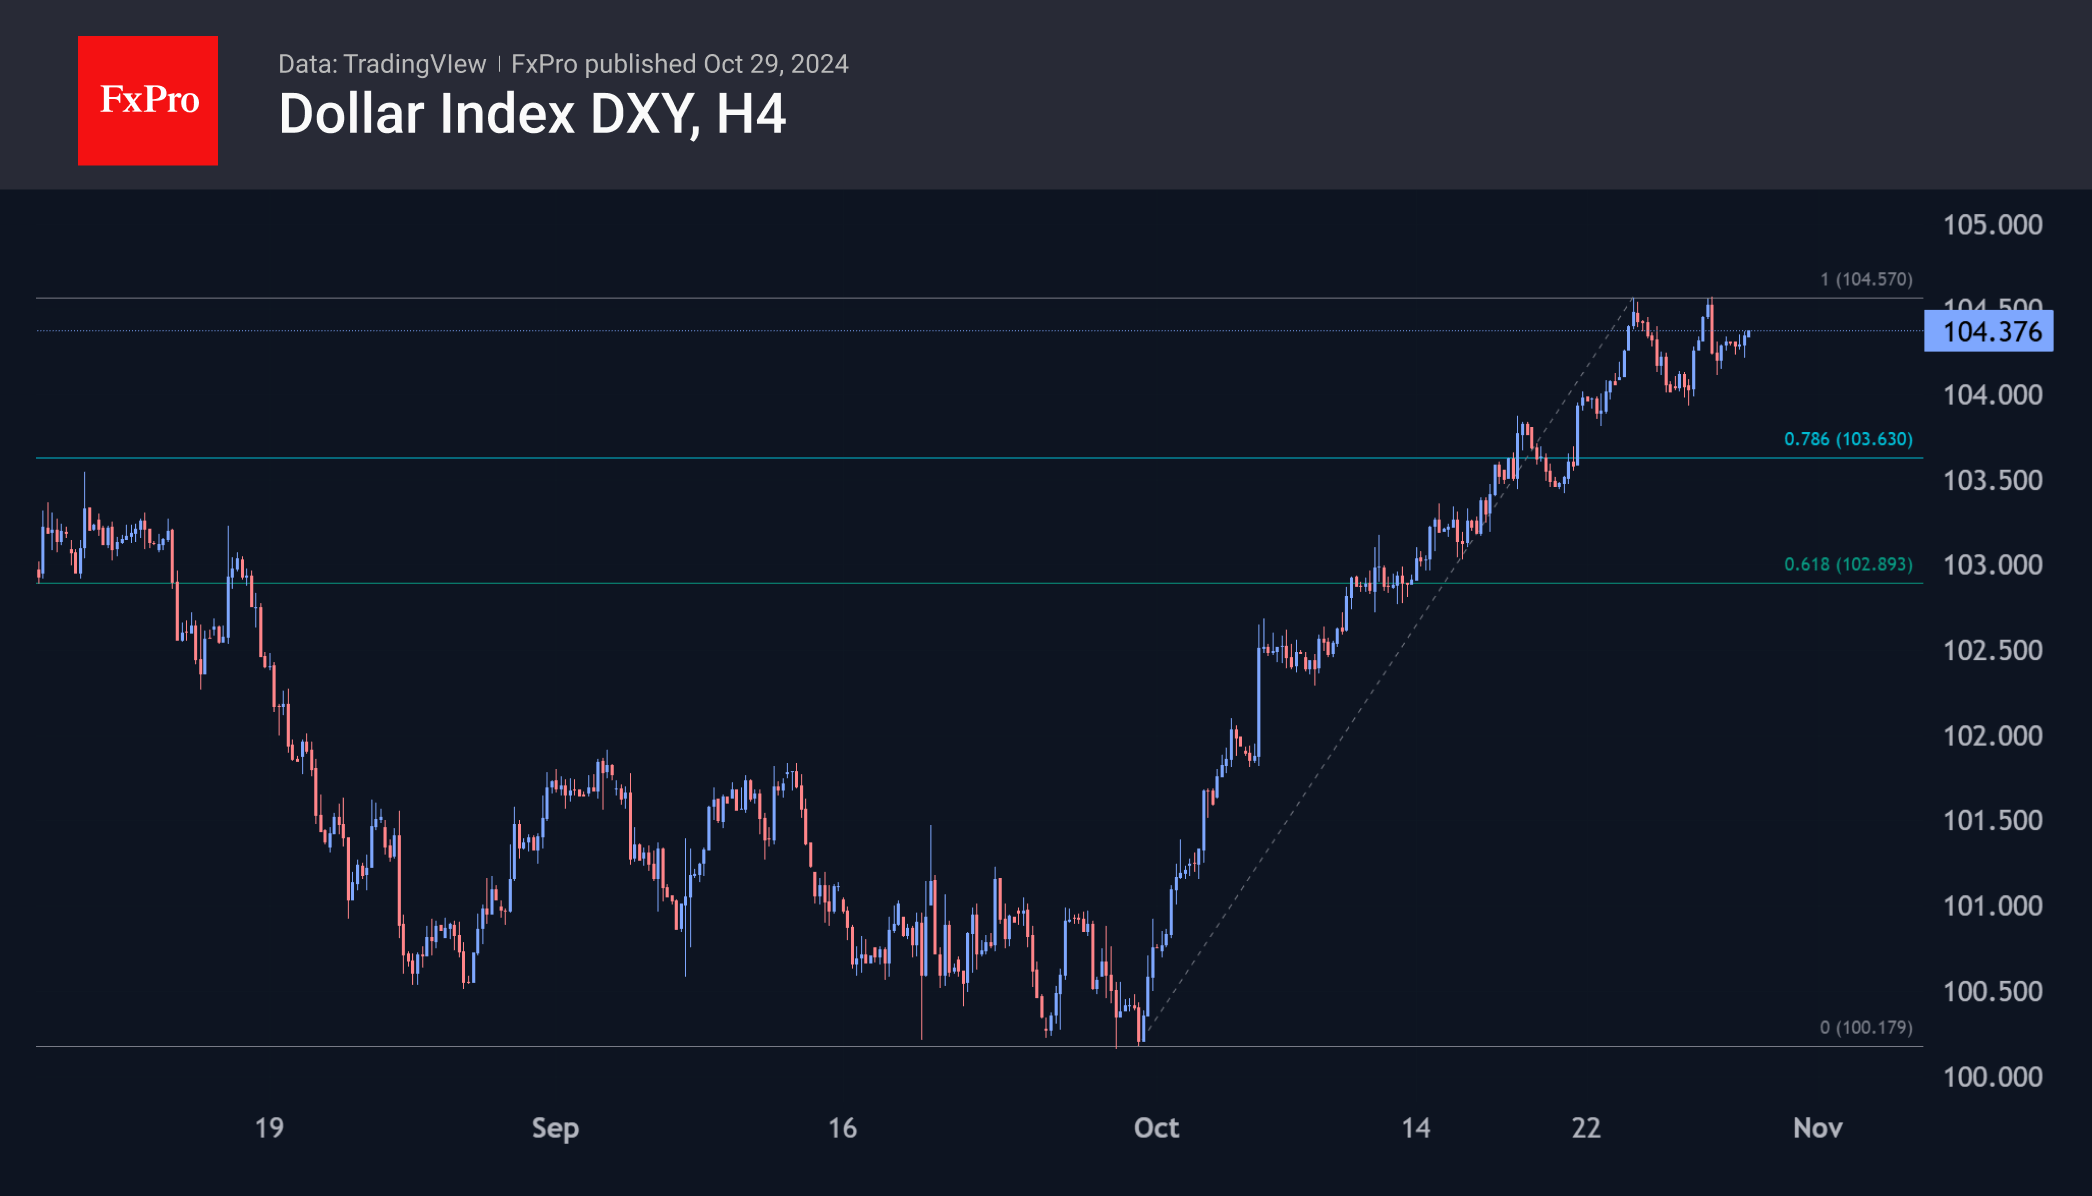
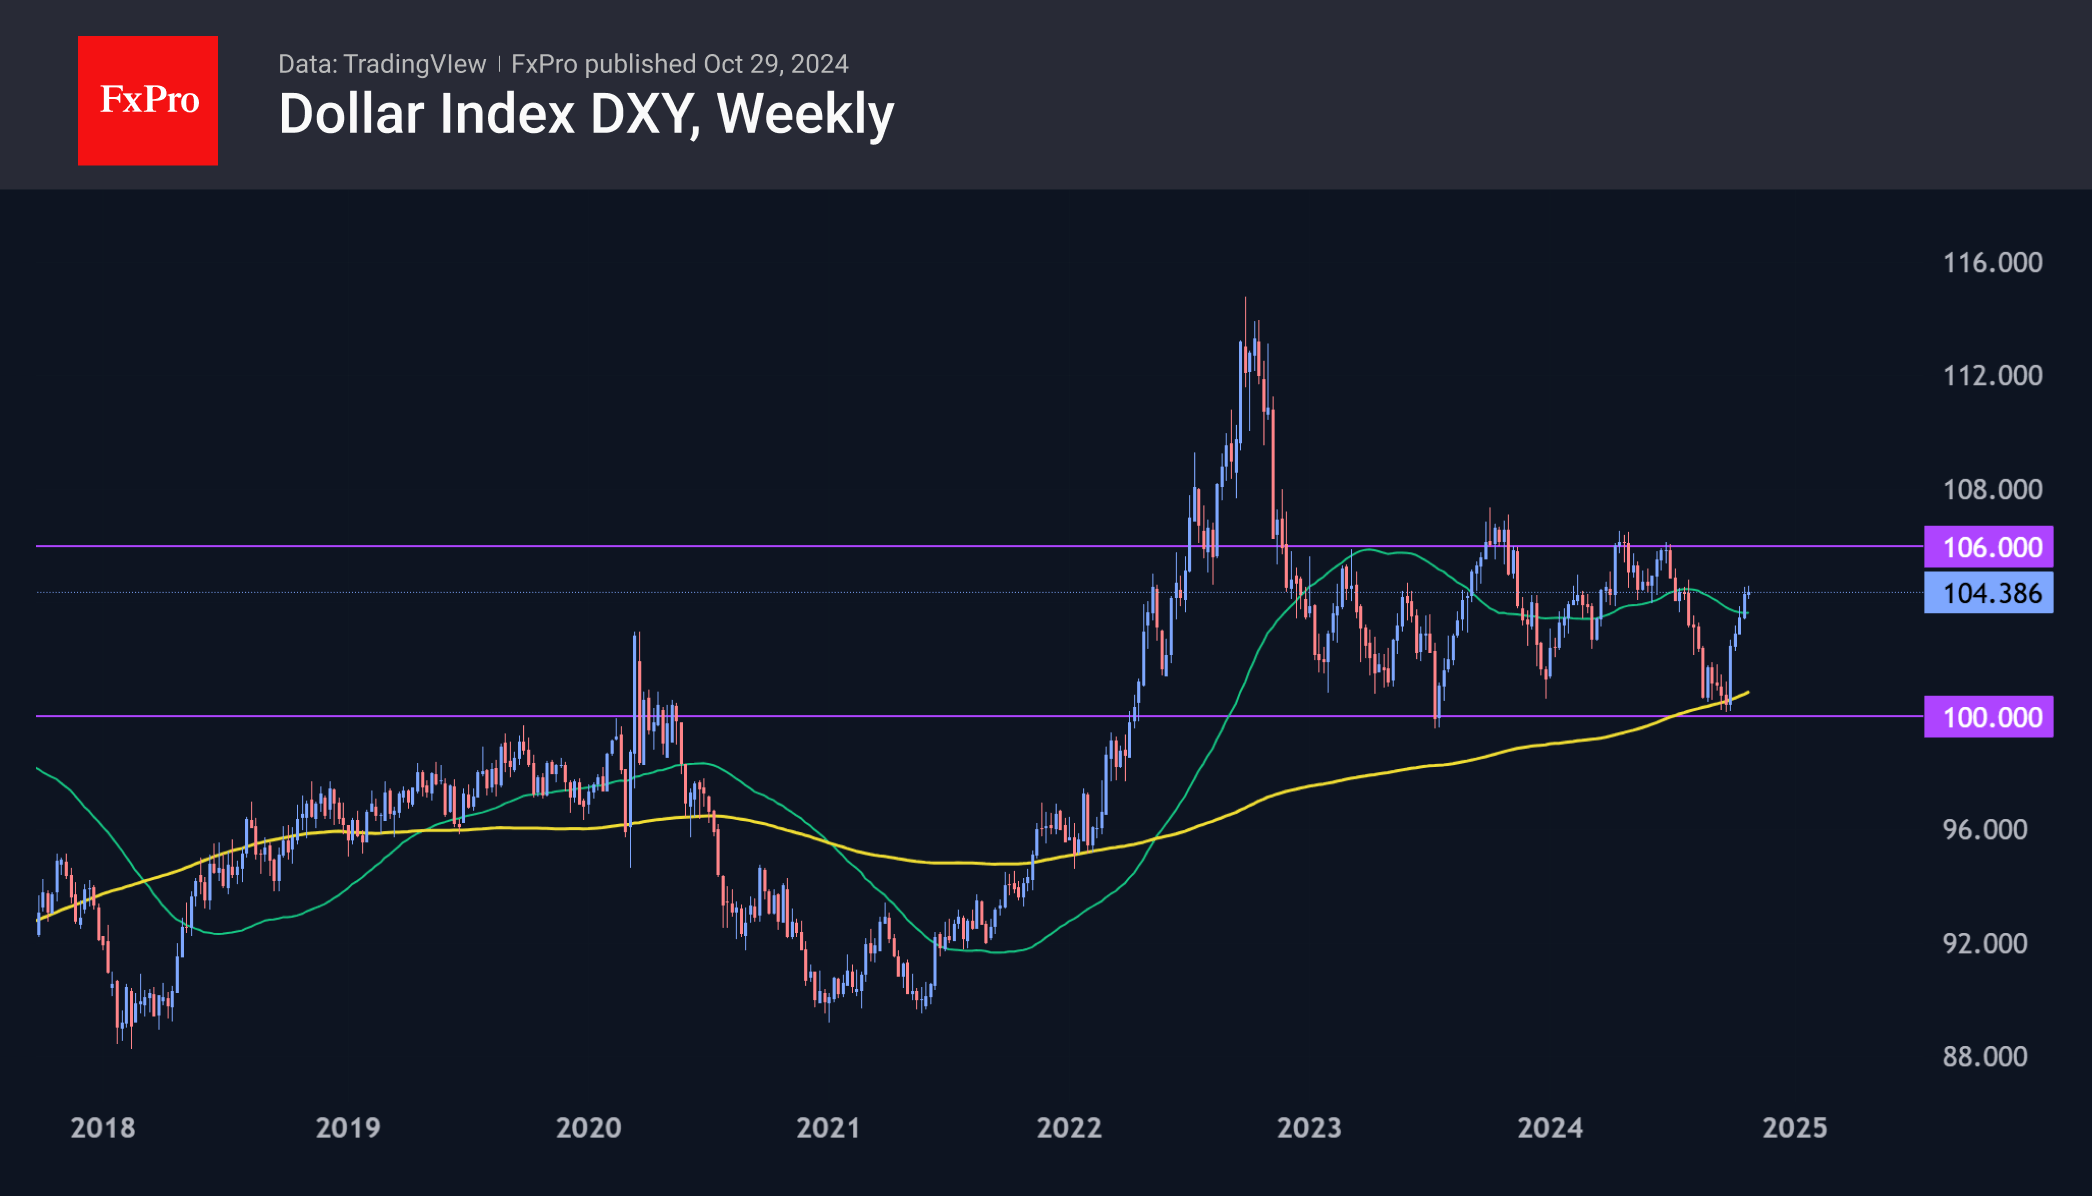
Dollar Picks Its Way
The Dollar Index stabilised in the 0.5% range for the fifth session, quietly finding its feet after a near 5% rally over the past thirty days. Since last week, currency market participants have taken a wait-and-see approach after four weeks of gains that fundamentally changed the dollar’s technical picture. However, a blockbuster of major news by the end of next week could strengthen or reverse the current trend.
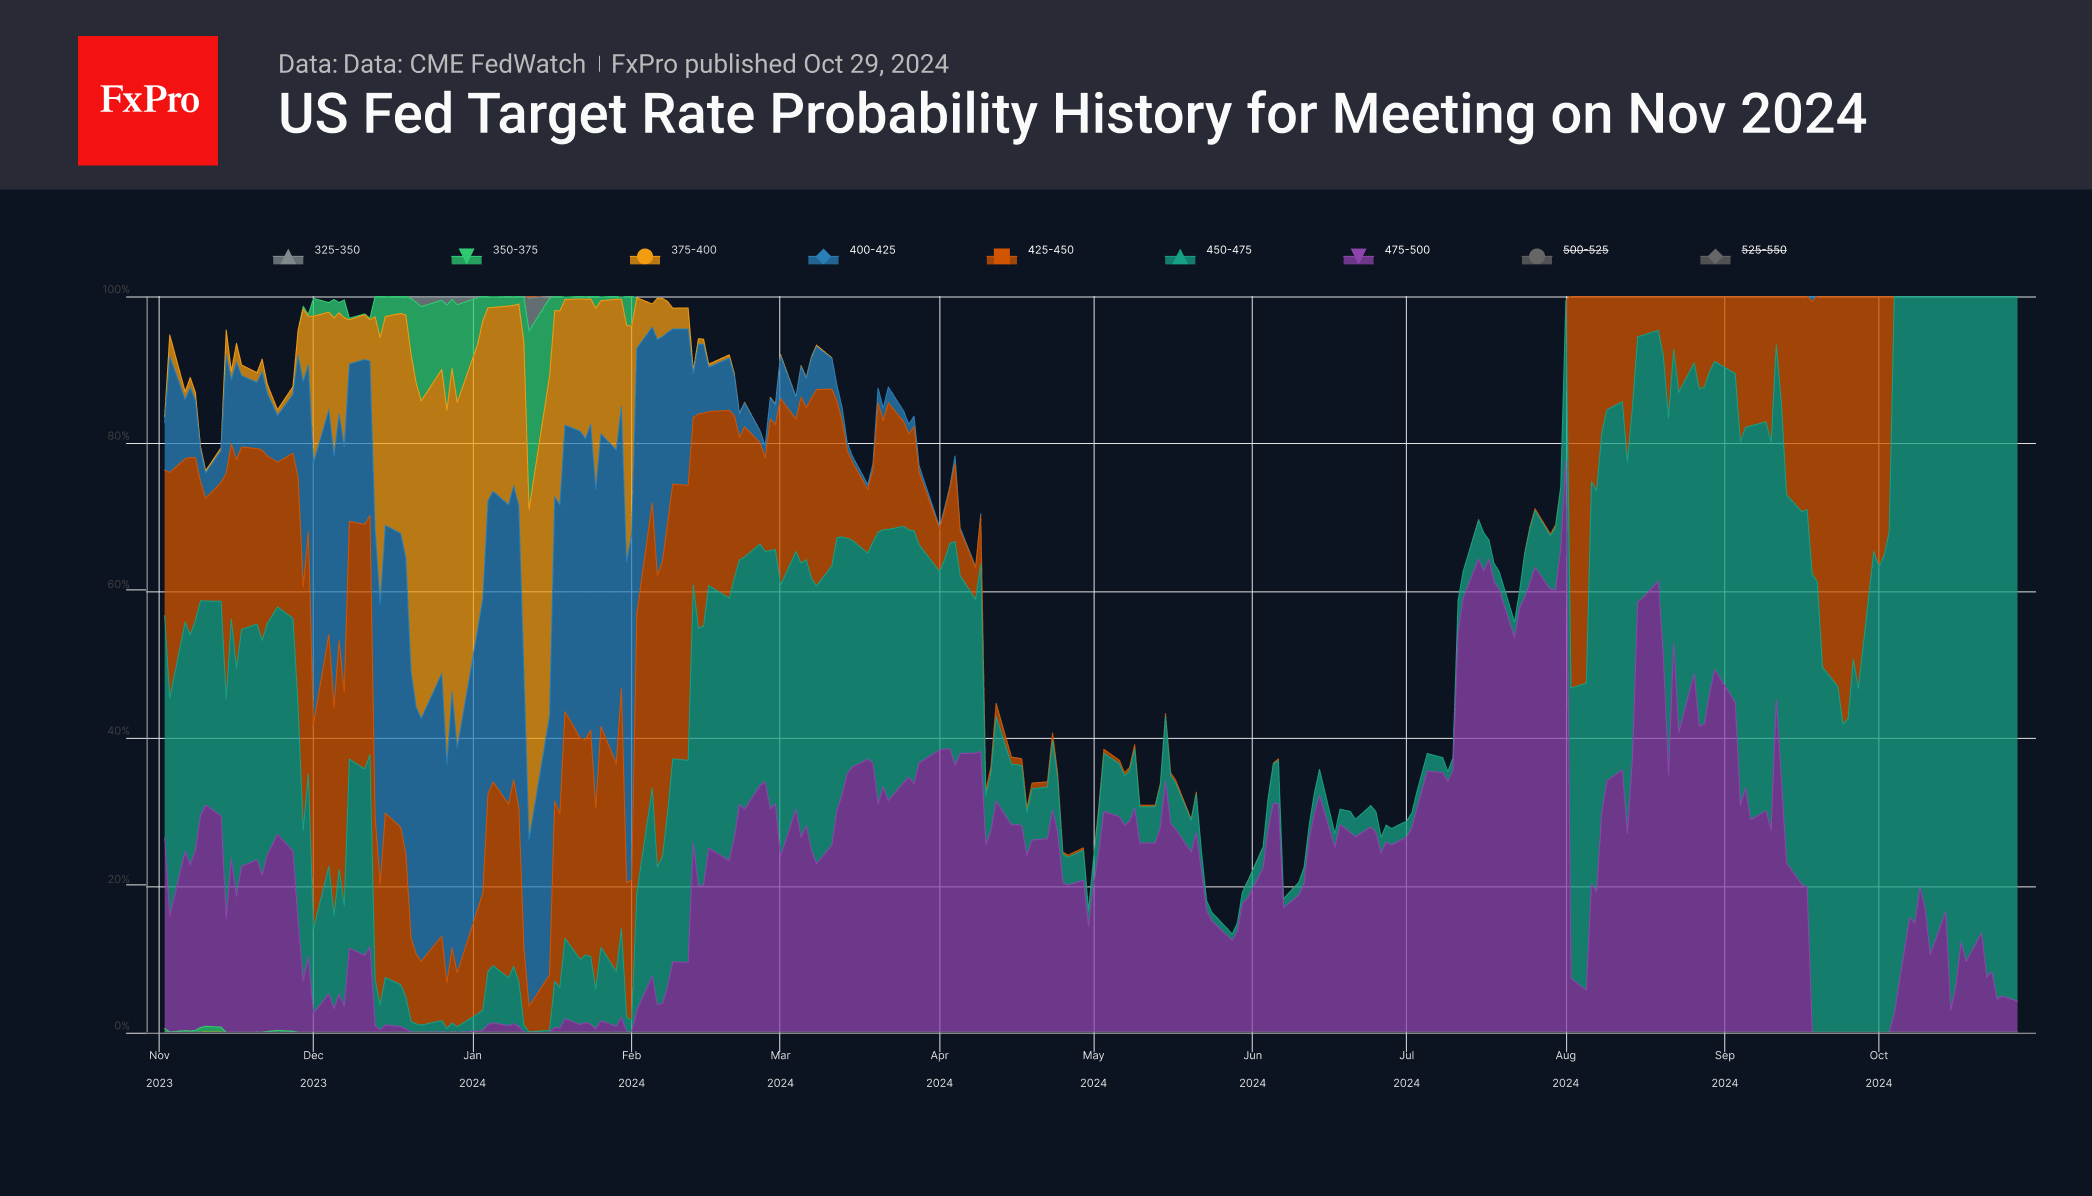
Firstly, the dollar steadied as market expectations settled around the Fed’s key rate outlook. From the end of September to the 10th of October, the market oscillated between expectations of a 50-basis point cut and a 20% chance of no change. However, in the last two weeks, there has been growing confidence in a 25-point easing, leaving about a 10% chance of no change. There is also a 30% chance that the Fed will only cut rates by 25 basis points before the end of the year. This is a hawkish scenario, attracting buyers of the dollar and sellers of long-term US Treasuries.
Several near-term events could dramatically affect market expectations. Until then, it is logical to expect a lull or pullback against the Dollar to take profits from earlier gains. The regular monthly US Non-Farm Payrolls report is due on Friday, but other labour market indicators will refine expectations later in the week and could influence prices. Hiring is expected to have slowed sharply, with only 111k jobs added in October, although Hurricane Milton will complicate the assessment of the economy in the outgoing month.
Next week’s presidential election will be in the spotlight until Wednesday. The dollar may feel a sense of relief when the results are announced, as it often weakens ahead of elections. The longer-term trend will depend on what the president-elect says. The risk of new tariffs is bullish for the dollar, while increased fiscal spending is bearish.
Later, the Fed will get into the game. The Fed has already entered a blackout period in which central bank officials will not comment on monetary policy until the meeting results are known. However, sentiment can be influenced by comments from influential journalists from the Wall Street Journal, Bloomberg, or the Financial Times, who many believe are familiar with the discussions or the real balance of power.
The DXY has a good chance of remaining in the 104.00-104.40 range until Friday or even retreating towards 103.5 as part of the correction of the previous rally. However, only a sustained consolidation below 102.7 would shift the primary outlook to a renewed dollar decline, with the potential to drop below 100 and beyond. A rally above 104.5 on the back of all the important news will make us consider the next stop at 106—the area of the highs of the last two years.
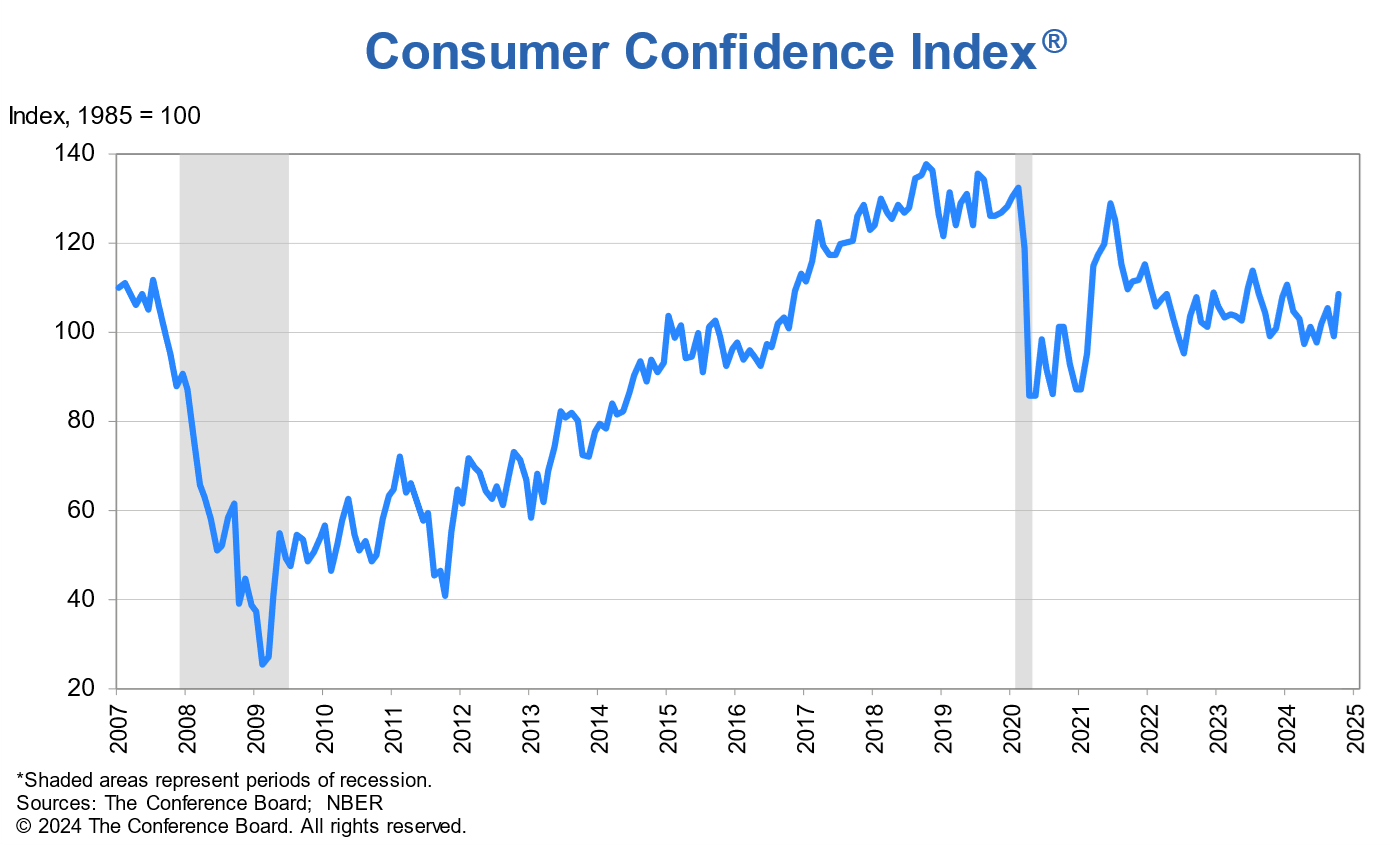
US Consumer Confidence surges to 108.7 in Oct, strong labor market and income optimism
US Conference Board Consumer Confidence Index rose sharply from 99.2 to 108.7 in October, significantly surpassing the expected 98.9 and marking the highest monthly gain since March 2021. Although this increase keeps the index within its two-year range, it reflects a notable boost in consumer sentiment driven by improving views on the economy and labor market.
Present Situation Index, a gauge of consumers’ perceptions of current economic conditions, climbed 14.2 points to 138.0, highlighting a strong rebound in how Americans view the job market and business environment.
Additionally, Expectations Index rose 6.3 points to 89.1, moving well above the recession-warning threshold of 80, indicating that consumers are increasingly positive about future economic conditions.
Dana M. Peterson, Chief Economist at The Conference Board, noted that October’s data saw improvements across all five components of the index. Consumers reported a more positive assessment of business conditions, reflecting recent labor market strength. Views on current job availability also improved, suggesting renewed optimism in employment prospects. Notably, consumers expressed greater optimism about future business conditions and income expectations, and for the first time since July 2023, showed cautious optimism regarding future job availability.
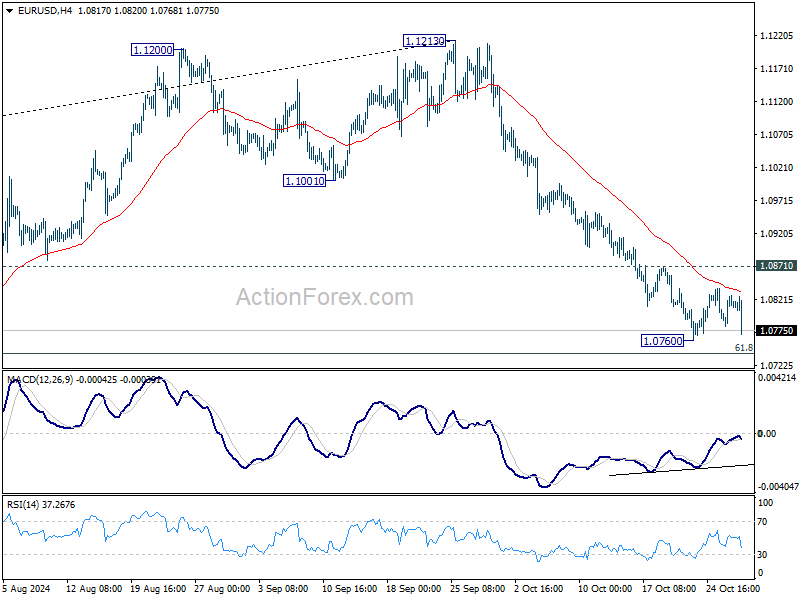
EUR/USD Mid-Day Outlook
Daily Pivots: (S1) 1.0787; (P) 1.0807; (R1) 1.0833; More...
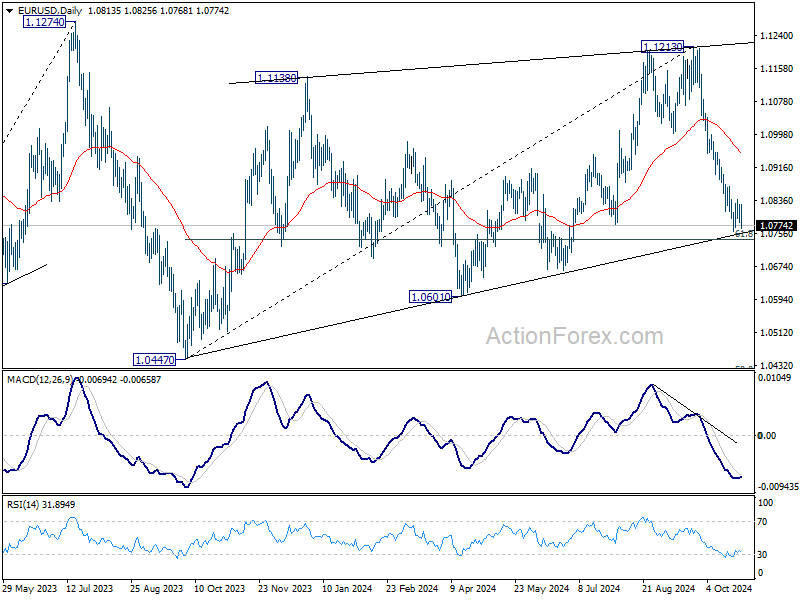
EUR/USD falls notably after rejection by 55 4H EMA (now at 1.0832), but stays above 1.0760 temporary low. Intraday bias remains neutral first. Further decline is expected as long as 1.0871 resistance holds. Below 1.0760 will target 61.8% retracement of 1.0447 to 1.1213 at 1.0740. Firm break there will target 1.0601 support next. However, considering bullish convergence condition in 4H MACD, break of 1.0871 will indicate short term bottoming, and turn bias back to the upside for 55 D EMA (now at 1.0956).
In the bigger picture, price actions from 1.1274 (2023 high) are seen as a consolidation pattern to up trend from 0.9534 (2022 low), with fall from 1.1213 as the third leg. Downside should be contained by 50% retracement of 0.9534 (2022 low) to 1.1274 at 1.0404, to bring up trend resumption at a later stage.
GBP/USD Mid-Day Outlook
Daily Pivots: (S1) 1.2940; (P) 1.2971; (R1) 1.3001; More...
GBP/USD is still bounded in consolidation above 1.2906 and intraday bias stays neutral. Further decline is expected as long as 1.3070 minor resistance holds. Below 1.2906 will target 61.8% retracement of 1.2298 to 1.3433 at 1.2732. However, considering bearish divergence condition in 4H MACD, firm break 1.3070 resistance will indicate short term bottoming, and turn bias back to the upside for stronger rebound.
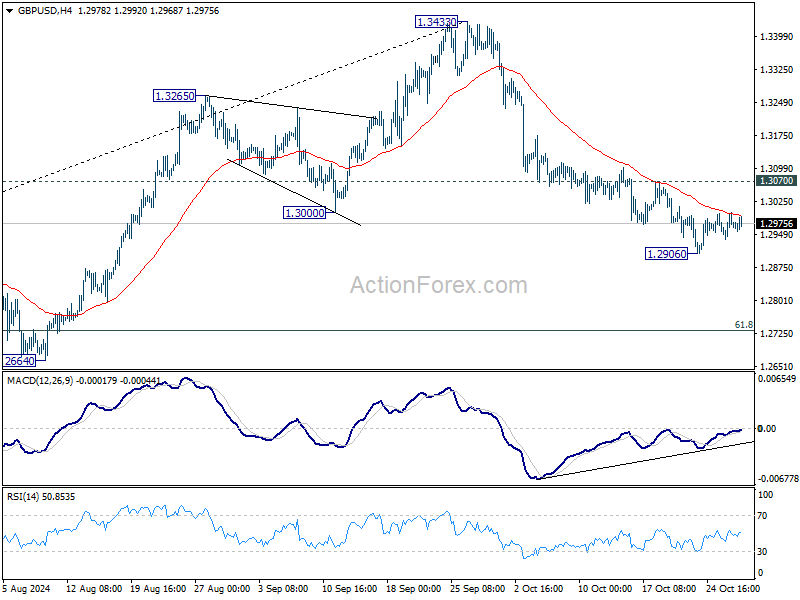
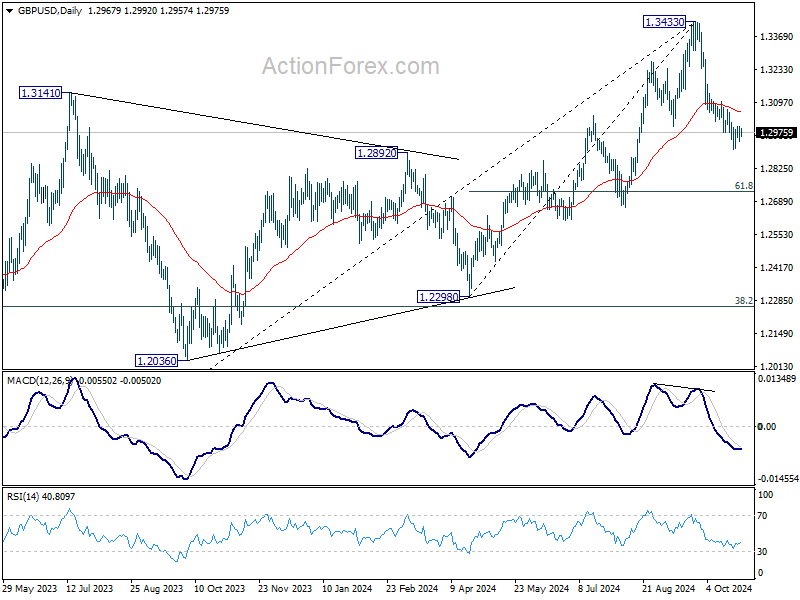
In the bigger picture, considering mildly bearish divergence condition in D MACD, a medium term top is likely in place at 1.3433 already. Price actions from there are seen as correction to whole up trend from 1.0351 (2022 low). Deeper decline would be seen to 38.2% retracement of 1.0351 to 1.3433 at 1.2256, which is close to 1.2298 structural support. Strong support should be seen there to bring rebound.
USD/JPY Mid-Day Outlook
Daily Pivots: (S1) 152.51; (P) 153.20; (R1) 153.98; More...
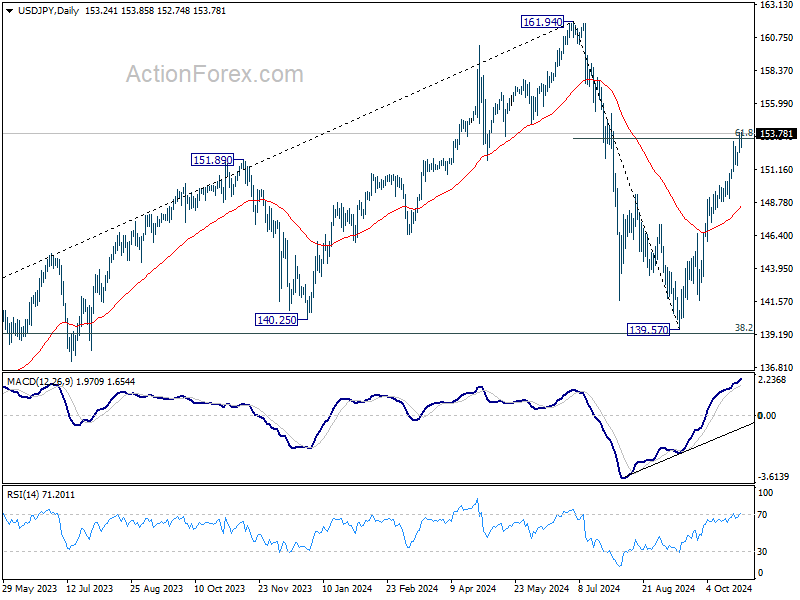
Intraday bias in USD/JPY remains on the upside as rise from 139.57 is in progress. Sustained trading above 61.8% retracement of 161.94 to 139.57 at 153.39 will pave the way to retest 161.94 high. On the downside, below 151.44 minor support will turn intraday bias neutral again first.
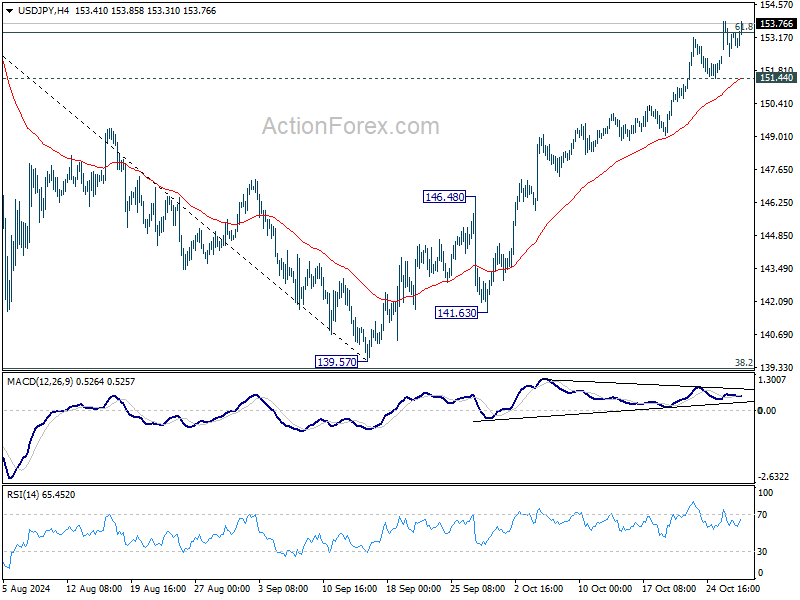
In the bigger picture, price actions from 161.94 are seen as a corrective pattern to rise from 102.58 (2021 low). The range of medium term consolidation should be set between 38.2% retracement of 102.58 to 161.94 at 139.26 and 161.94. Nevertheless, sustained break of 139.26 would open up deeper medium term decline to 61.8% retracement at 125.25.