Sample Category Title
Swedish GDP and US Labour Market Data in Focus Today
In focus today
In the US, we receive JOLTs labour turnover, which is a key measure of labour demand for the Fed. The October consumer confidence survey is also due for release.
In Sweden, at 08:00 CET, the GDP indicator for Q3 is released. The first two quarters presented a mixed growth picture; the Q1 growth of 0.8% q/q was followed by a contraction of 0.3% in Q2. We expect growth of 0.5% q/q driven by net exports and private consumption. Riksbank's quarterly business survey is also due and it will be interesting to see whether Swedish businesses have seen any improvements yet. Both releases will carry weight for the Riksbank in their upcoming rate decision on 7 November.
In Australia we receive CPI; consensus expects a decline of 0.9 percentage points from 3.8% to 2.9%
Economic and market news
What happened yesterday
In euro area, commenting on the speculation of an ECB jumbo cut, ECB policymaker Pierre Wunsch (hawk) stated that due to an improved economic landscape that there is no urgency to accelerate the easing of monetary policy. Instead, the market should wait for upcoming releases of inflation and results of the US election which will affect ECB's rate decision. Markets currently price in around 20% probability of a 50bp cut.
Equities: Global equities were higher yesterday, adopting a wait-and-see approach ahead of the very busy period that kicks off today with numerous earnings reports and the first batch of job data from the US. The big loser yesterday was the energy sector, following a 6% decrease in oil prices. To illustrate the non-macro-driven performance yesterday, we saw tech underperforming alongside energy, while small caps experienced a relatively solid day despite rising yields. We have mentioned this previously, but it may be worth highlighting again. With several multifactorial, eventful days ahead, we are likely to witness days marked by special cross-asset moves and rotations. Hence, it is prudent to remain somewhat humble over the next couple of weeks when attempting to discern the causalities in fundamentals and markets. In the US yesterday: Dow +0.7%, S&P 500 +0.3%, Nasdaq +0.3%, Russell 2000 +1.6%. Asian markets are presenting a mixed picture this morning, with Japan experiencing another day of strong equities and a weaker yen. European and US futures are marginally higher.
FI: The decoupling of USD and EUR rates continued through yesterday's session as implied probabilities of a 'Republican Sweep' gained further traction through the weekend. 2Y UST yields rose 3bp throughout the session, while the comparable Schatz yield was down a couple of basis points. The recent repricing has left the SOFR terminal rate at an elevated level of 3.5%, which is about 0.5 percentage point above the median FOMC longer-term projection. In our view, this gives a significant downside for USD rates in the case of a Harris win next week. In terms of implied volatility, the MOVE index is at its highest levels since mid-2023.
FX: EUR/USD stayed around 1.08 in a quiet start to the week, with data on the US labour market in focus, starting with the JOLTS job openings today. Political uncertainty in Japan has further contributed to the USD/JPY rise over the past month. Our tactical recommendation to go short on AUD/USD spot reached its target level of 0.66 yesterday, resulting in a booked profit of 4.4%, including carry. EUR/SEK and EUR/NOK both edged higher, hovering around 11.50 and 11.90, respectively. Oil prices dropped yesterday to their lowest in about a month as investors priced out the geopolitical premium following Israel's targeted retaliatory strike on Iran.
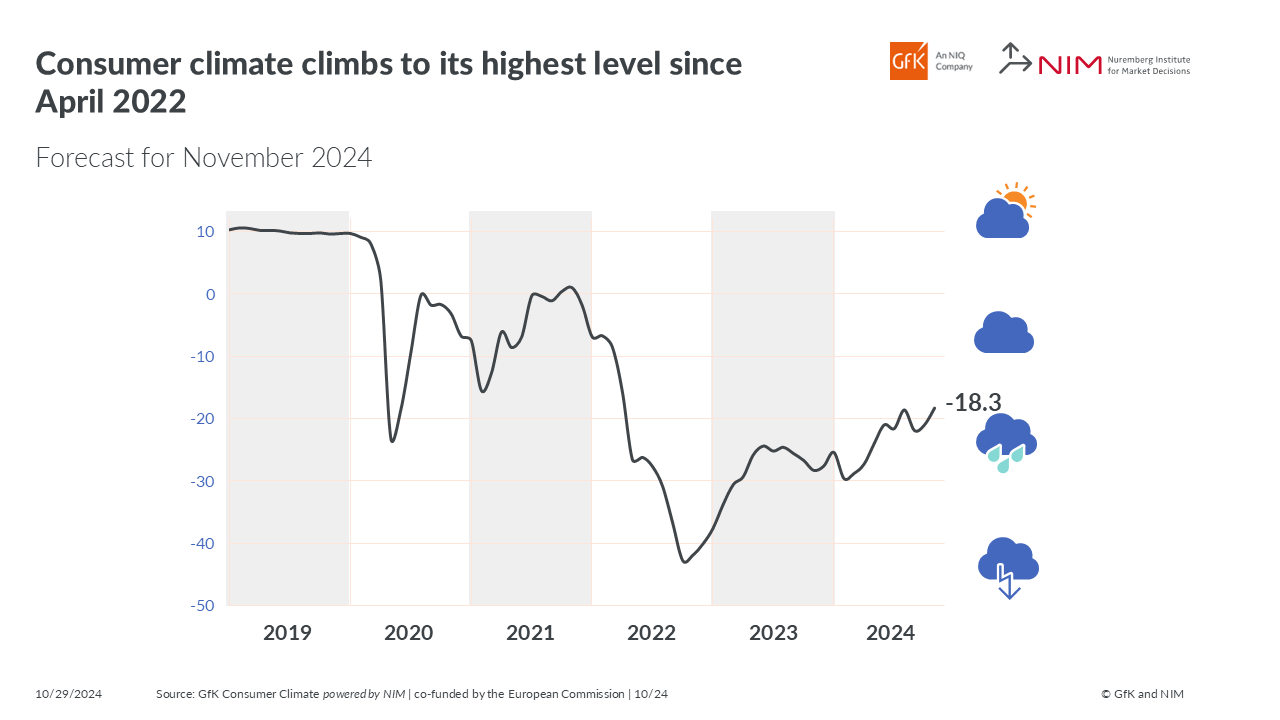
Germany’s Gfk consumer sentiment rises to -18.3, remains fragile
Germany’s GfK Consumer Climate index for November improved from -21.0 to -18.3, exceeding forecast of -20.5 and marking its highest level since April 2022. However, the underlying sentiment remains subdued, as economic expectations continued to trend downward for the third consecutive month, dropping -0.5 to -0.2, the lowest level since March.
Rolf Bürkl, consumer expert at the NIM, cautioned that while consumer sentiment has improved, it remains historically low due to persistent uncertainties driven by "crises, wars and rising prices".
He noted that rising company insolvencies, job cut plans, and discussions around shifting production abroad are "preventing a more significant recovery in consumer sentiment."
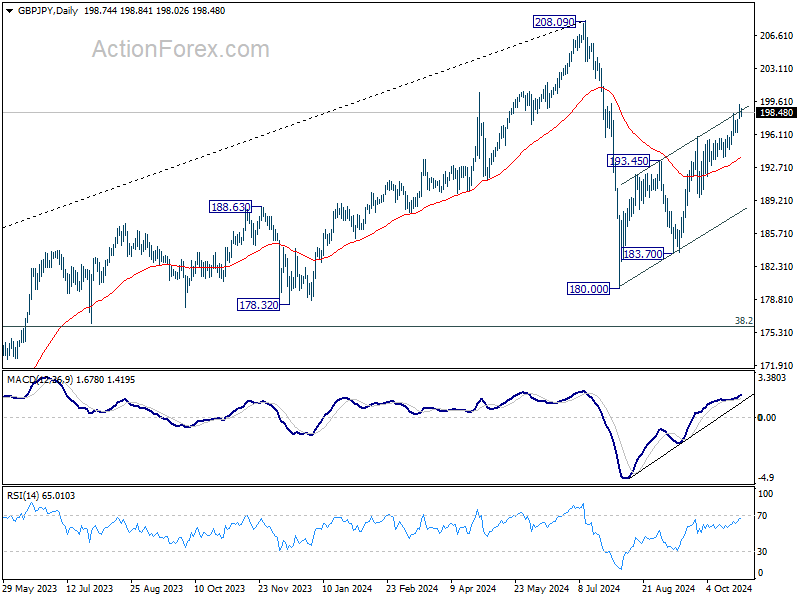
GBP/JPY Daily Outlook
Daily Pivots: (S1) 197.97; (P) 198.67; (R1) 199.52; More...
Intraday bias in GBP/JPY remains on the upside for the moment. Current rise from 180.00 should target a retest on 208.09 high next. On the downside, below 196.37 minor support will turn intraday bias neutral again first.
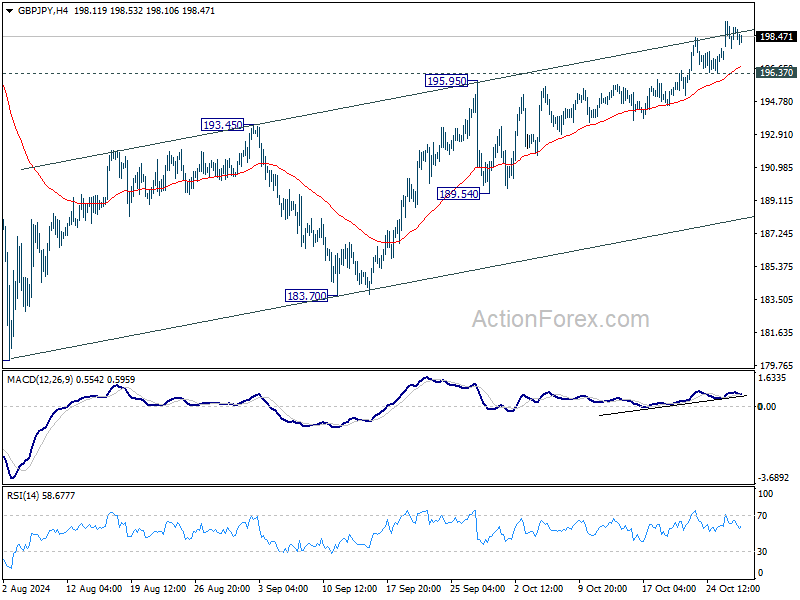
In the bigger picture, price actions from 208.09 are seen as a correction to whole rally from 123.94 (2020 low). The range of consolidation should be set between 38.2% retracement of 123.94 to 208.09 at 175.94 and 208.09. However, decisive break of 175.94 will argue that deeper correction is underway.
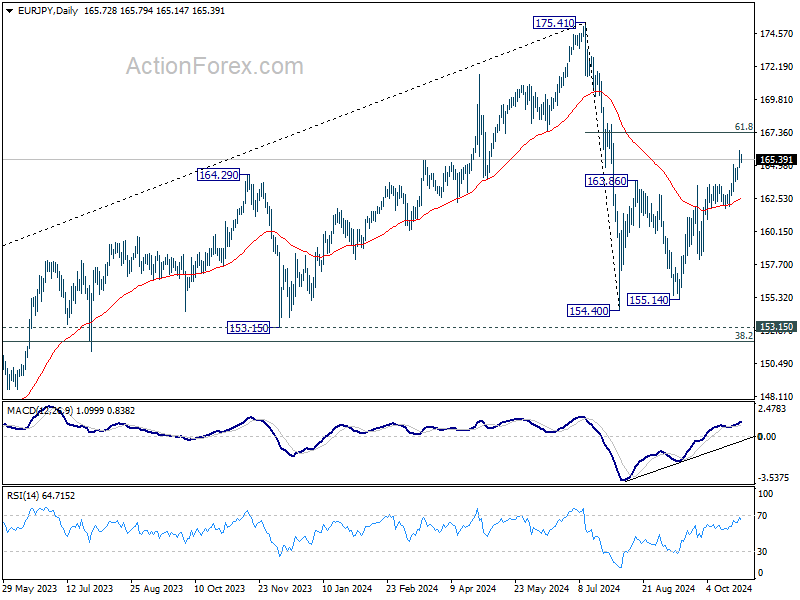
EUR/JPY Daily Outlook
Daily Pivots: (S1) 164.95; (P) 165.52; (R1) 166.32; More....
Intraday bias in EUR/JPY stays on the upside at this point, and rise fro 155.14 is in progress for 61.8% retracement of 175.41 to 154.40 at 167.38. Sustained break there will pave the way to retest 175.41 high. On the downside, below 163.79 minor support will turn intraday bias neutral again first.
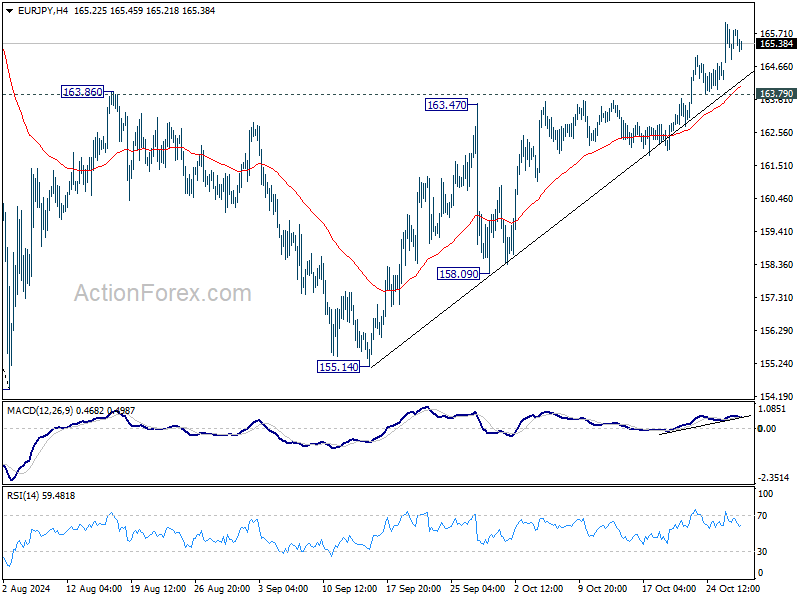
In the bigger picture, price actions from 175.41 are seen as correction to rally from 114.42 (2020 low). The range of consolidation should have been set between 38.2% retracement of 114.42 to 175.41 at 152.11 and 175.41 high. However, decisive break of 152.11 would argue that deeper correction is underway.
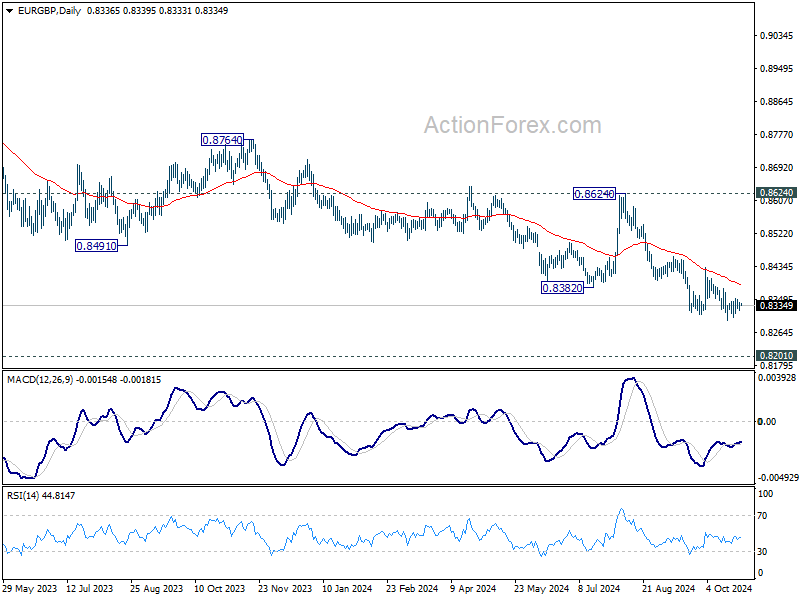
EUR/GBP Daily Outlook
Daily Pivots: (S1) 0.8322; (P) 0.8333; (R1) 0.8347; More...
EUR/GBP is still extending the consolidation pattern from 0.8294 and intraday bias stays neutral. Outlook remains bearish with 0.8433 resistance intact. On the downside, break of 0.8294 will resume larger down trend to 0.8201 key support next. Strong support could be seen from there to bring rebound.
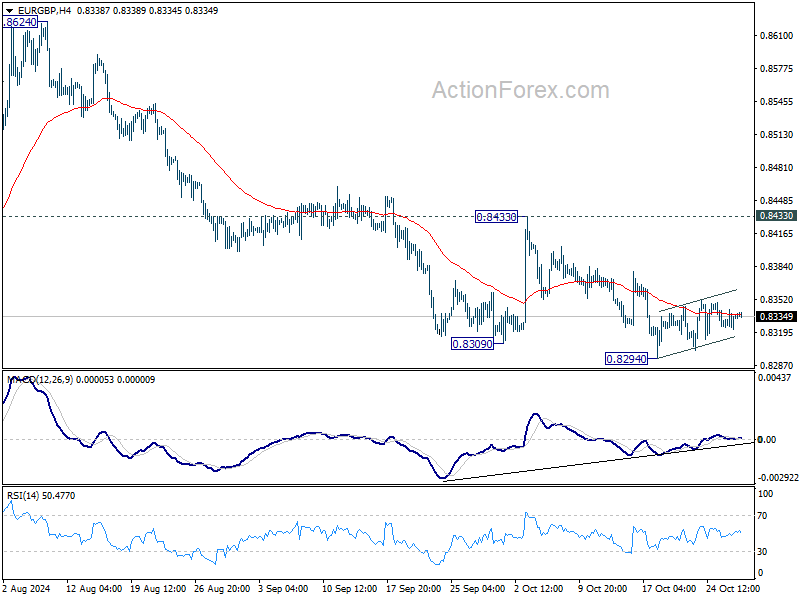
In the bigger picture, down trend from 0.9267 (2022 high) is in progress. Next target is 0.8201 (2022 low), but strong support should be seen there to bring rebound. However, outlook will remain bearish as long as 0.8624 resistance holds even in case of strong rebound. Decisive break of 0.8201 will indicate long term bearish reversal.
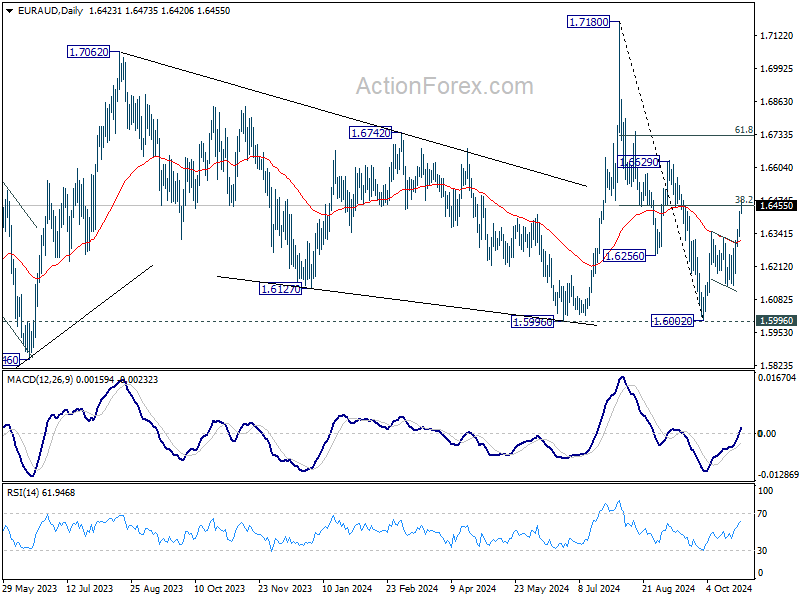
EUR/AUD Daily Outlook
Daily Pivots: (S1) 1.6336; (P) 1.6385; (R1) 1.6472; More...
EUR/AUD's rally from 1.6002 continues today and intraday bias stays on the upside. Decisive break of 38.2% of 1.7180 to 1.6002 at 1.6452 should confirm that whole fall from 1.7180 has completed with three waves down to 1.6002, after being supported by 1.5996. Next target is 61.8% retracement at 1.6730. On the downside, below 1.6351 resistance turned support will turn intraday bias neutral first.
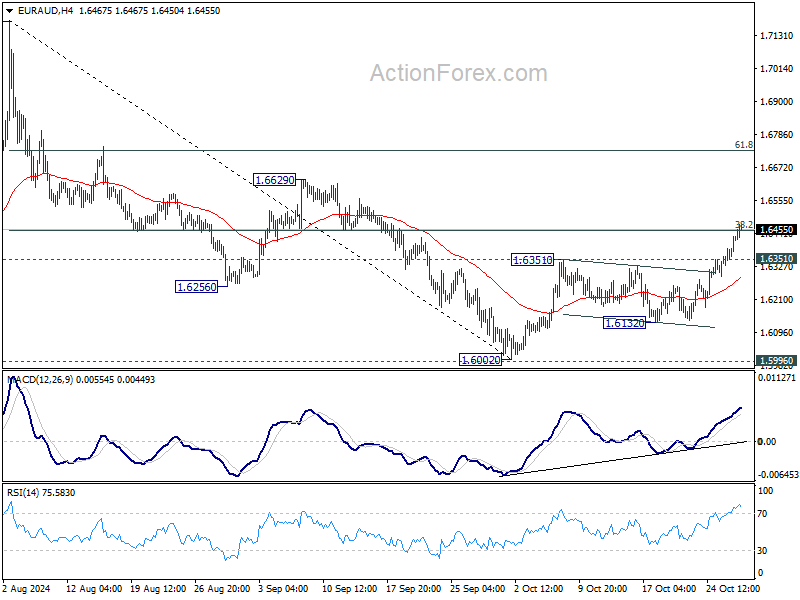
In the bigger picture, as long as 1.5996 cluster support holds (38.2% retracement of 1.4281 to 1.7062 (2023 high) at 1.6000), up trend from 1.4281 (2022 low) is still expected to resume at a later stage. However, decisive break of 1.5996 will argue that the medium term trend has reversed and turn outlook bearish.
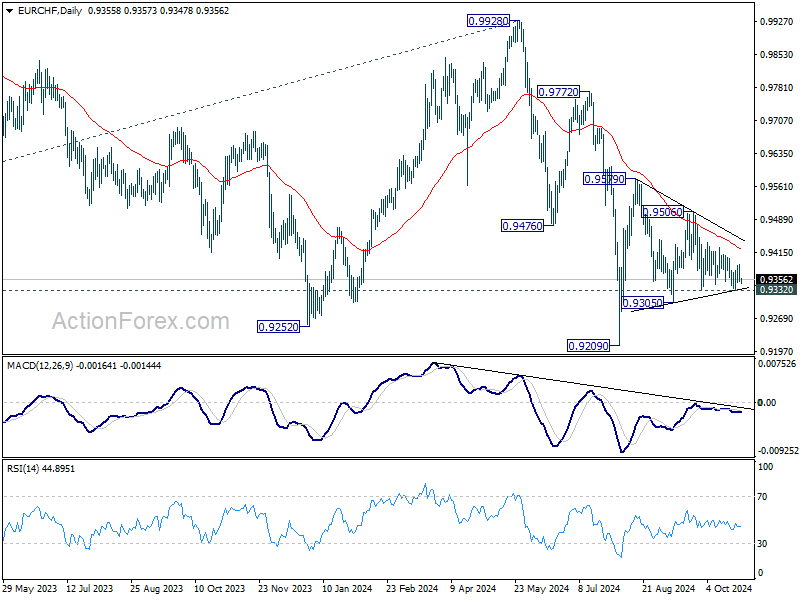
EUR/CHF Daily Outlook
Daily Pivots: (S1) 0.9343; (P) 0.9366; (R1) 0.9380; More....
Range trading continues in EUR/CHF and outlook is unchanged. Intraday bias stays neutral for the moment. On the downside, break of 0.9332 will resume the fall from 0.9579 towards 0.9209 low. On the upside, break of 0.9506 will turn intraday bias to the upside for 0.9579 resistance and above.
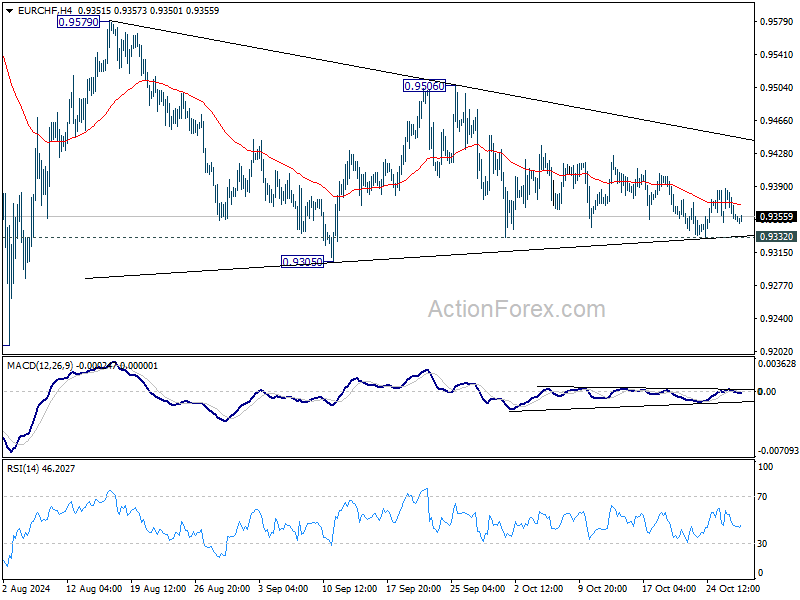
In the bigger picture, fall from 0.9928 is seen as part of the long term down trend. Repeated rejection by 55 D EMA (now at 0.9427) keeps outlook bearish for breaking through 0.9209 low at a later stage. Nevertheless, sustained trading above 55 D EMA will confirm medium term bottoming and bring stronger rebound back towards 0.9928 key resistance.
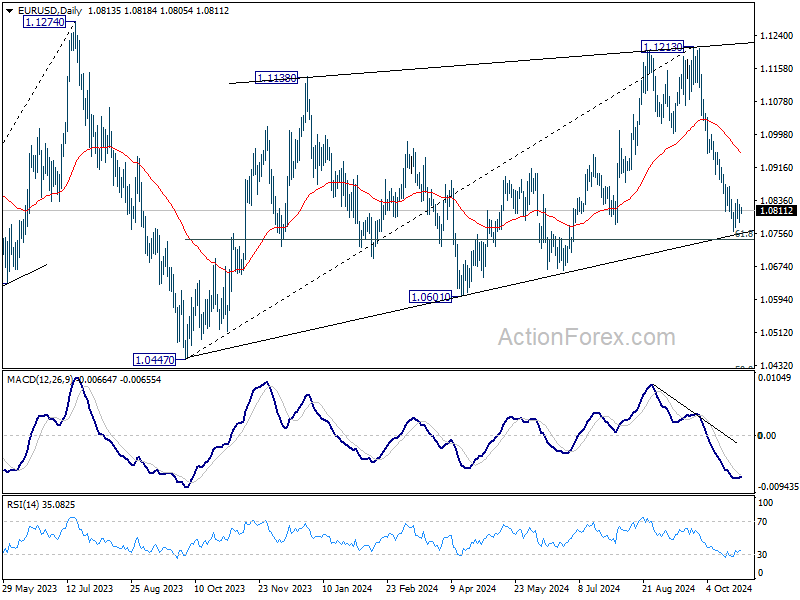
EUR/USD Daily Outlook
Daily Pivots: (S1) 1.0787; (P) 1.0807; (R1) 1.0833; More...
Intraday bias in EUR/USD remains neutral as consolidations from 1.0760 is extending. Further decline is expected as long as 1.0871 resistance holds. Below 1.0760 will target 61.8% retracement of 1.0447 to 1.1213 at 1.0740. Firm break there will target 1.0601 support next. However, considering bullish convergence condition in 4H MACD, break of 1.0871 will indicate short term bottoming, and turn bias back to the upside for 55 D EMA (now at 1.0956).
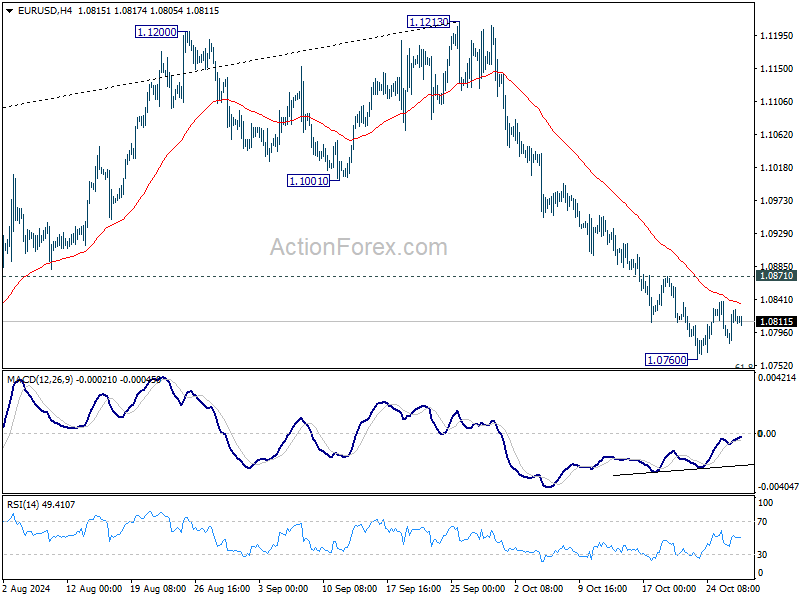
In the bigger picture, price actions from 1.1274 (2023 high) are seen as a consolidation pattern to up trend from 0.9534 (2022 low), with fall from 1.1213 as the third leg. Downside should be contained by 50% retracement of 0.9534 (2022 low) to 1.1274 at 1.0404, to bring up trend resumption at a later stage.
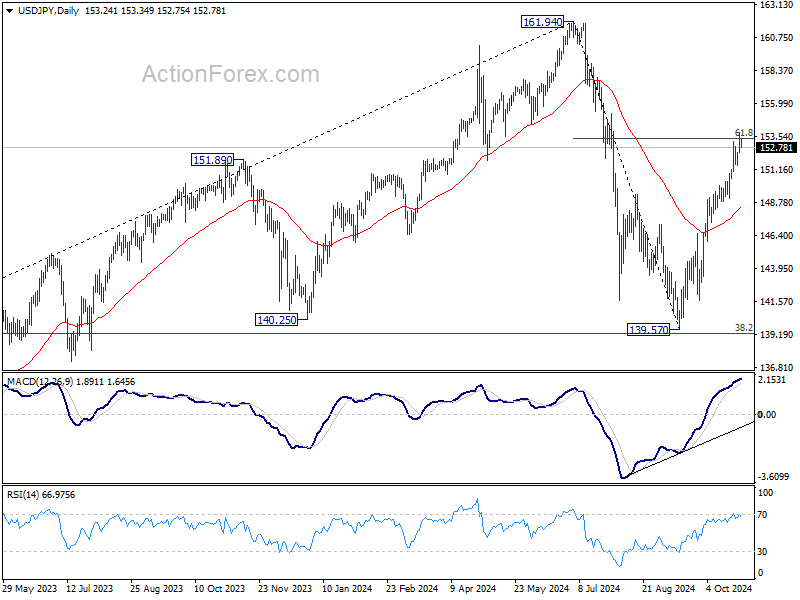
USD/JPY Daily Outlook
Daily Pivots: (S1) 152.51; (P) 153.20; (R1) 153.98; More...
No change in USD/JPY's outlook and intraday bias stays on the upside. Sustained trading above 61.8% retracement of 161.94 to 139.57 at 153.39 will pave the way to retest 161.94 high. On the downside, below 151.44 minor support will turn intraday bias neutral again first.
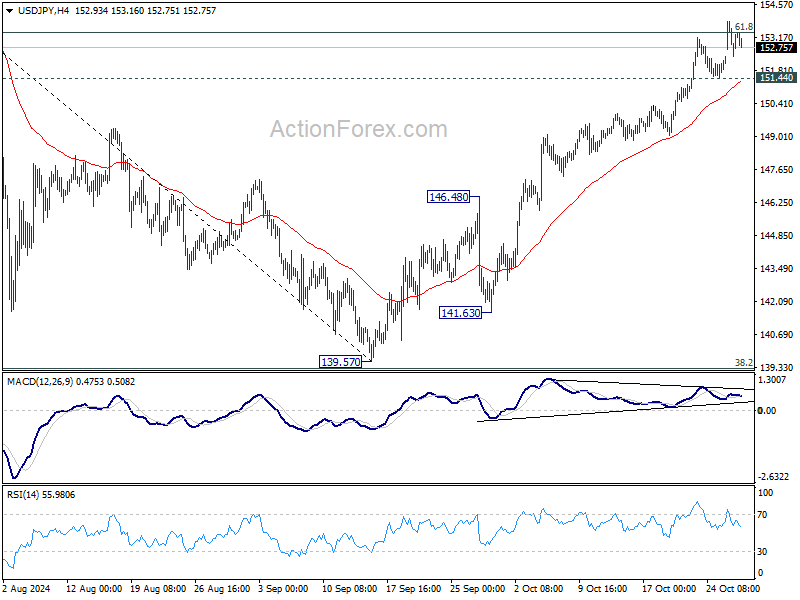
In the bigger picture, price actions from 161.94 are seen as a corrective pattern to rise from 102.58 (2021 low). The range of medium term consolidation should be set between 38.2% retracement of 102.58 to 161.94 at 139.26 and 161.94. Nevertheless, sustained break of 139.26 would open up deeper medium term decline to 61.8% retracement at 125.25.
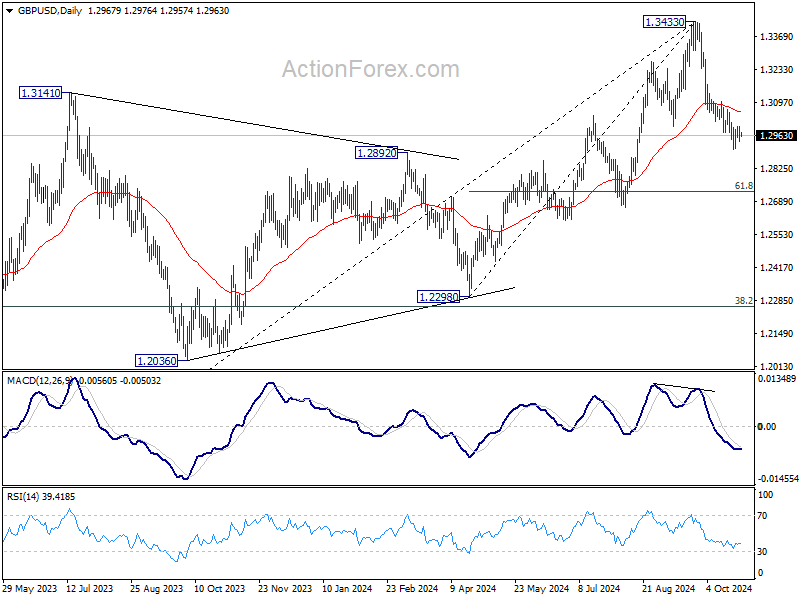
GBP/USD Daily Outlook
Daily Pivots: (S1) 1.2940; (P) 1.2971; (R1) 1.3001; More...
Intraday bias in GBP/USD remains neutral as consolidations continues above 1.2906 temporary low. Further decline is expected as long as 1.3070 minor resistance holds. Below 1.2906 will target 61.8% retracement of 1.2298 to 1.3433 at 1.2732. However, considering bearish divergence condition in 4H MACD, firm break 1.3070 resistance will indicate short term bottoming, and turn bias back to the upside for stronger rebound.
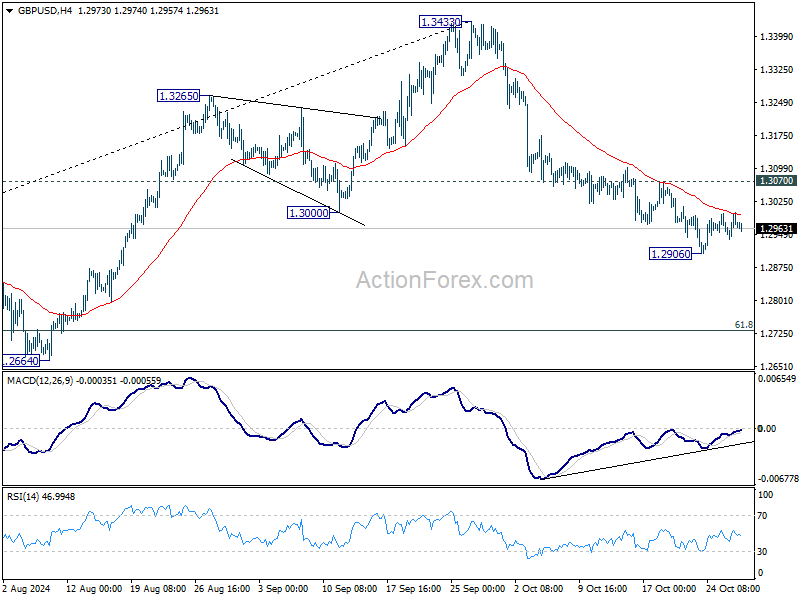
In the bigger picture, considering mildly bearish divergence condition in D MACD, a medium term top is likely in place at 1.3433 already. Price actions from there are seen as correction to whole up trend from 1.0351 (2022 low). Deeper decline would be seen to 38.2% retracement of 1.0351 to 1.3433 at 1.2256, which is close to 1.2298 structural support. Strong support should be seen there to bring rebound.