Sample Category Title
EUR/USD Turns Red, Upsides Could Face Hurdles
Key Highlights
- EUR/USD started a fresh decline below the 1.1080 support.
- It traded below a key bullish trend line with support at 1.1145 on the 4-hour chart.
- GBP/USD declined below the 1.3150 support level.
- USD/JPY rallied above the 146.50 and 147.20 resistance levels.
EUR/USD Technical Analysis
The Euro failed to continue higher above 1.1200 and started a fresh decline against the US Dollar. EUR/USD traded below 1.1100 to enter a bearish zone.
Looking at the 4-hour chart, the pair gained bearish momentum below the 1.1150 support, the 100 simple moving average (red, 4-hour), and the 200 simple moving average (green, 4-hour). The pair traded below a key bullish trend line with support at 1.1145 on the same chart.
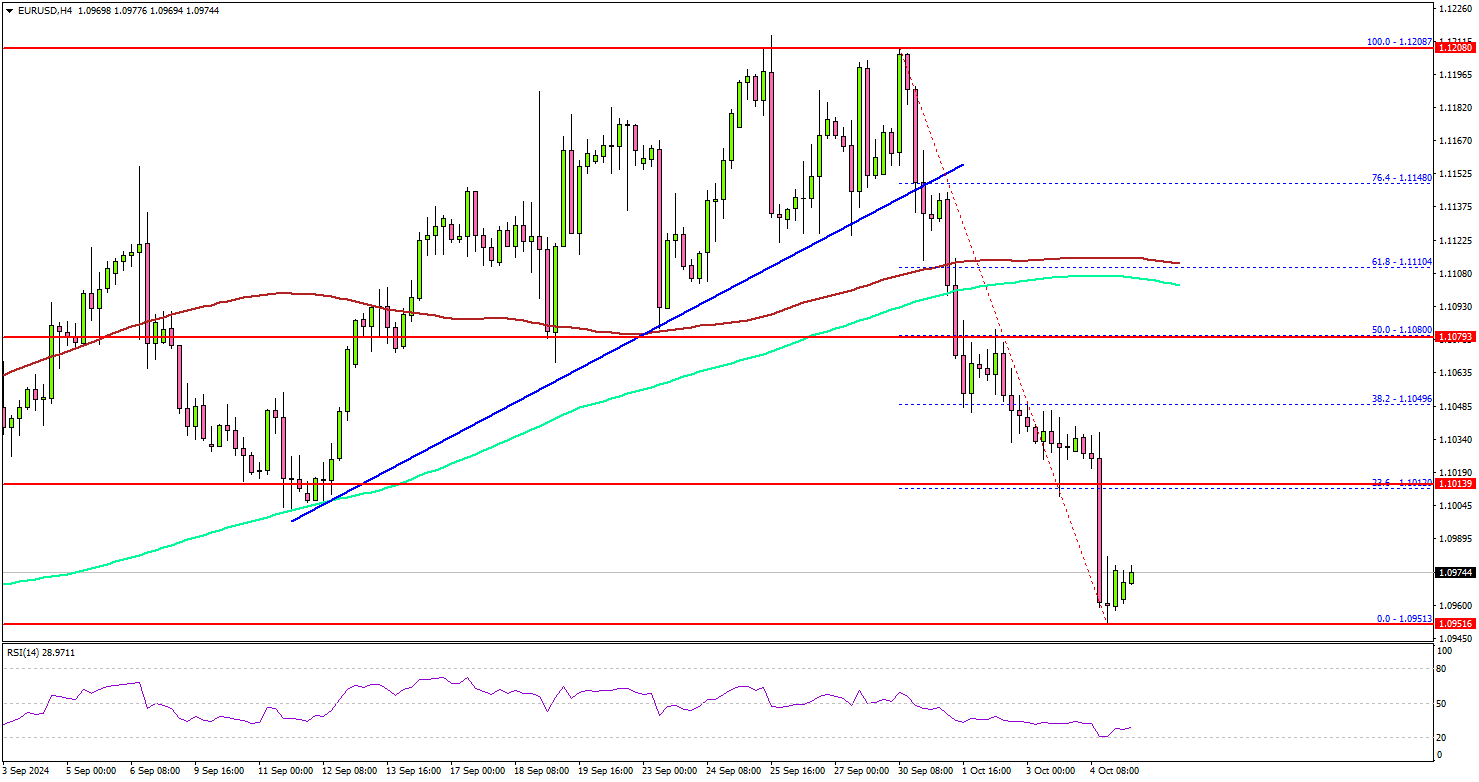
The bears even pushed the pair below 1.1020. It seems like the pair might struggle to recover. On the upside, the bears might be active near the 1.1000 level.
The first major resistance might be near the 1.1080 level. It is close to the 50% Fib retracement level of the downward move from the 1.1208 swing high to the 1.0950 zone. A close above the 1.1080 level could set the tone for another increase.
The next major resistance could be 1.1145. A clear move above the 1.1145 level might send EUR/USD toward 1.1200. Any more gains might call for a test of the 1.1250 zone.
On the downside, immediate support sits near the 1.0950 level. The next key support sits near the 1.0920. Any more losses could send the pair toward the 1.0840 support.
Looking at GBP/USD, the pair also saw bearish moves, and the bears were able to push the pair below the 1.3150 support.
Upcoming Economic Events:
- Euro Zone Retail Sales for August 2024 (MoM) - Forecast +0.2%, versus +0.1% previous.
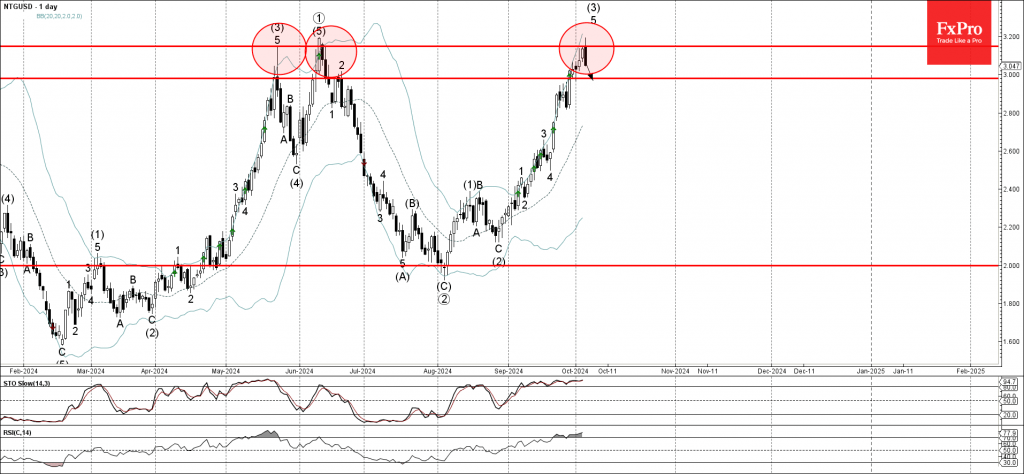
Natural Gas Wave Analysis
- Natural gas reversed from long-term resistance level 3.150
- Likely to fall to support level 3.0000
Natural gas recently reversed down from the long-term resistance level 3.150 (the previous month’s high from May and June).
The resistance level 3.150 was strengthened by the upper daily Bollinger Band. If natural gas closes today near the current levels it will then form the daily Bearish Engulfing.
Given the strength of the resistance level 3.150 and the overbought daily Stochastic and RSI, Natural gas can be expected to fall further to the next round support level 3.0000.
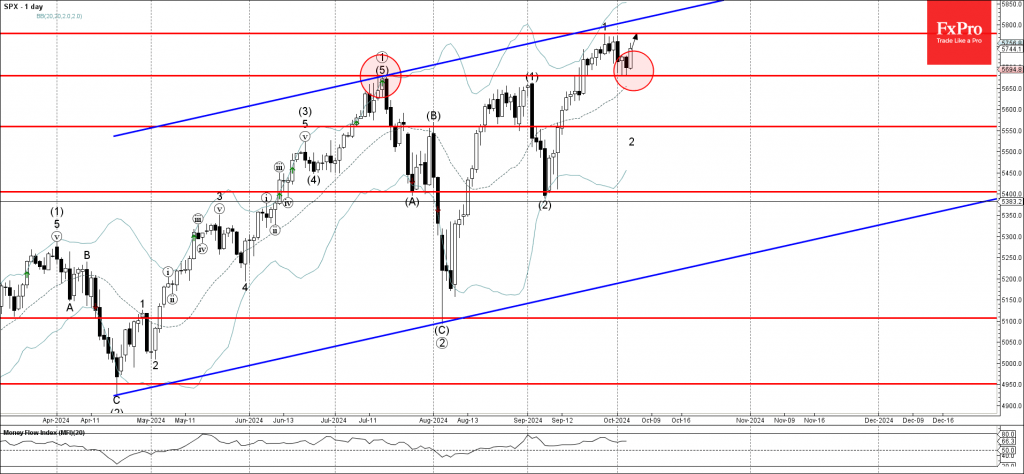
S&P 500 Wave Analysis
- S&P 500 reversed from support level 5680.00
- Likely to rise to resistance level 5780.00
S&P 500 index recently reversed up from the pivotal support level 5680.00 (a former multi-month high from July, acting as the support after it was broken last month).
The upward reversal from the support level 5680.00 will likely form the daily Japanese candlesticks reversal pattern Bullish Engulfing – if the index closes today near the current levels.
Given the clear daily uptrend, S&P 500 index can be expected to rise further to the next resistance level 5780.00 (top of the impulse wave 1 from last month).
Dollar Rises on Fed Clarity, Oil Jumps on Rising Fears of Wider Middle East War
The financial markets gained much-needed clarity last week as strong US employment data aligned market expectations with Fed’s own monetary policy outlook. The possibility of a 50bps rate cut in November has now vanished, with traders anticipating two more standard 25bps cuts this year, matching Fed's dot plot.
This development boosted Dollar, which ended the week as the strongest performing currency. Additionally, funds appeared to flow heavily from bonds into stock markets, driving up Treasury yields, and lifted DOW to new record close. The surge in 10-year yield was more than offset the typical "risk-on" sentiment’s negative effect on the greenback.
Canadian Dollar finished as the second strongest currency, largely driven by the significant rally in oil prices. Escalating tensions in the Middle East pose a serious threat to global oil supply, a wildcard that could influence not only the Loonie but also global inflation, monetary policy, and financial markets in the near term. Australian Dollar was the third strongest, although it seemed to lose some momentum towards the end of the week.
On the other end of the spectrum, Yen struggled as the weakest currency of the week. New Japanese Prime Minister Shigeru Ishiba's dovish pivot on monetary policy, combined with a sharp rise in U.S. and European yields, pressured Yen further. New Zealand dollar also languished near the bottom, with firm expectations of a 50bps rate cut from RBNZ next. Swiss Franc also found itself among the weakest performers after the new SNB Chair, Martin Schlegel, clearly outlined a dovish stance.
Euro and Sterling settled in middle positions. The ECB’s unified stance on a October rate cut contrasted sharply with BoE's internal division, with top officials offering conflicting views on the future of monetary policy.
Fed’s 50bps Cut Off the Table After Strong Jobs Data, Dollar and Yields Surge
The possibility of a 50bps rate cut by Fed in November has effectively been eliminated following the robust September non-farm payroll report. The earlier fears of a recession, fueled by a summer of weak employment data in the US, have dissipated too. Investors reacted positively to the strong jobs data, pushing the DOW to a record close. Funds flowed out of Treasury bonds, causing 10-year yield to rise sharply and break through a key near-term resistance level. Simultaneously, Dollar Index staged a strong rebound, surpassing a near-term resistance level and suggesting bullish trend reversal.
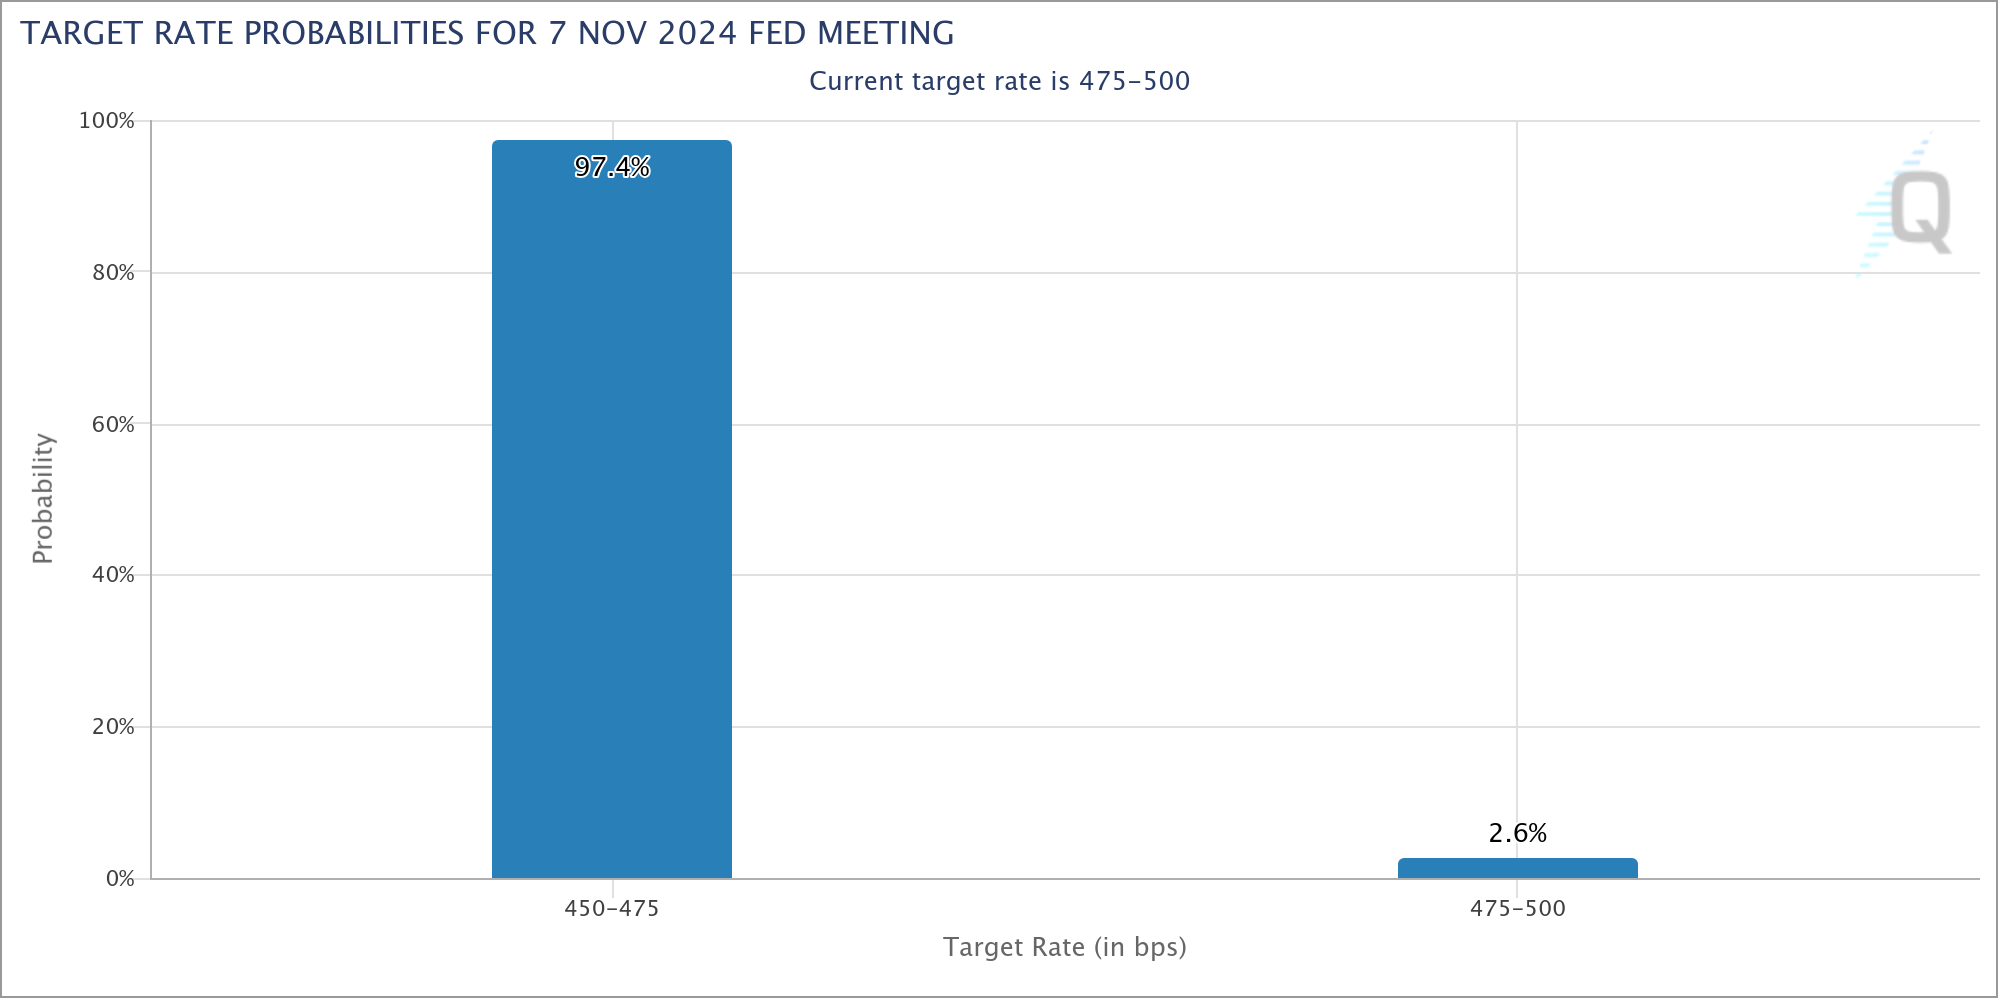
According to Fed funds futures, the market now assigns a 97.4% probability of a 25bps cut to 4.50-4.75% at the FOMC meeting on November 7. The remaining 2.6% probability is for no change in rates, rather than a 50bps cut.
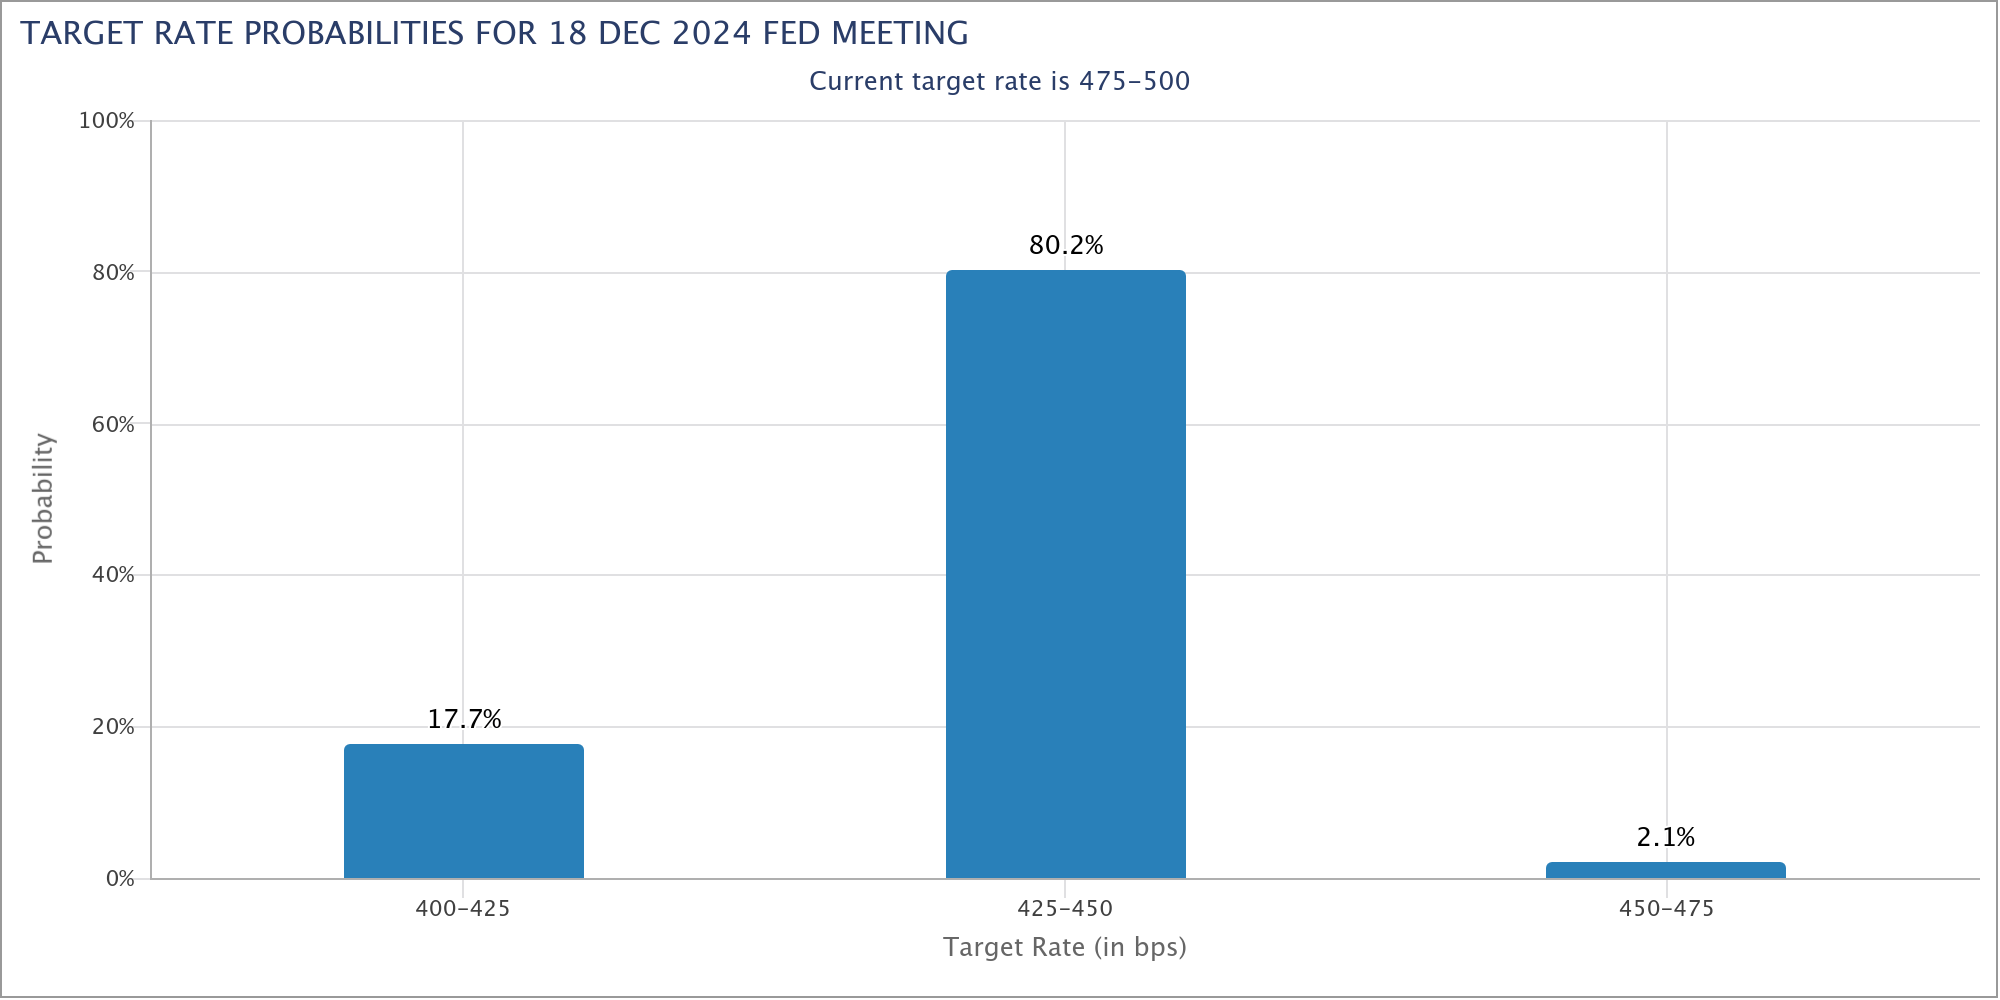
For the December meeting, futures indicate an 80.2% chance of another 25bps cut to 4.25-4.50%. This aligns the market's base case with the Fed's latest dot plot, which projected two more 25bps cuts by the end of the year.
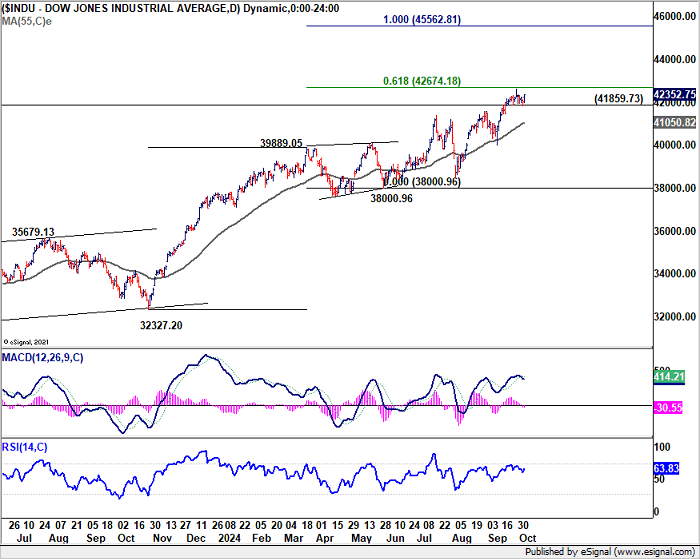
Technically, DOW is holding on to 41859.73 support and maintains near term bullishness. Decisive break of 61.8% projection of 32327.20 to 39899.05 from 38000.96 will pave the way to 100% projection at 45562.81.
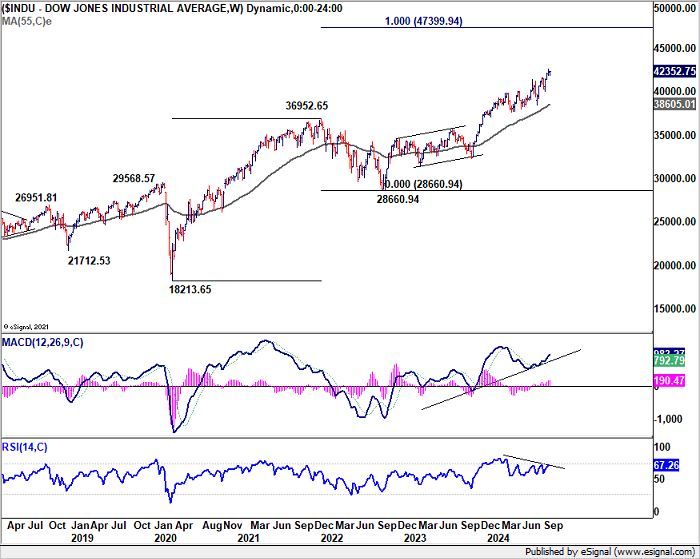
In the bigger picture, DOW is holding well above rising 55 W EMA (now at 38605.01) with W MACD trending up. Current up trend should target 100% projection of 18213.65 to 36952.65 from 28660.94 at 47399.94 in the medium term.
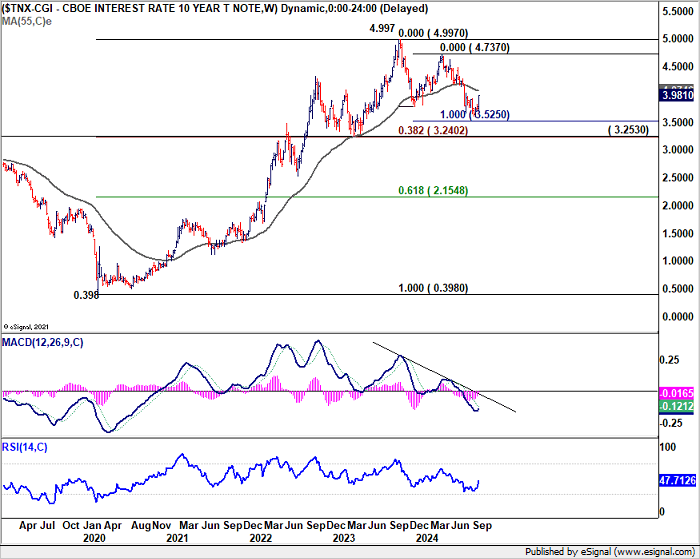
10-year yield's strong break of 55 D EMA (now at 3.879) confirms short term bottoming at 3.603. Considering bullish convergence condition in D MACD, it's also possible that whole corrective decline from 4.9978 has completed with three waves down to 3.603.
Immediate focus is now on the resistance zone between 55 W EMA (now at 4.074) and 38.2% retracement of 4.997 to 3.603 at 4.135. Decisive break there will affirm the mentioned bullish case, and target 61.8% retracement at 4.464 and above.
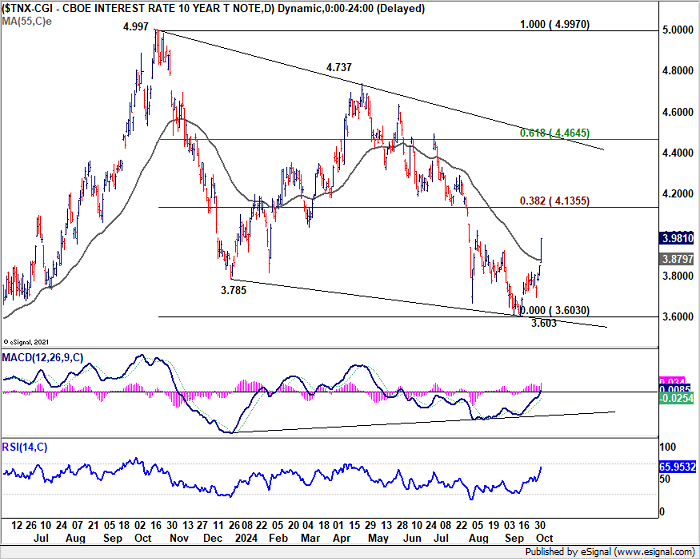
Also, from a "pure" technical point of view, the decline from 4.997 is clearly corrective, and has just missed 100% projection of 4.997 to 3.785 from 4.737 at 3.525. 10-year yield was comfortably supported above 3.253 cluster support (38.2% retracement of 0.398 to 4.997 at 3.240). That is, the up trend from 0.398 (2020 low) is not completed yet, and is probably setting itself up to resume through 4.997 high. It's unsure what the fundamental driver of that would be, perhaps resurgence of inflation due to Middle East conflicts and rising oil prices. Well, maybe. That's something we'd keep an eye on in the months ahead.
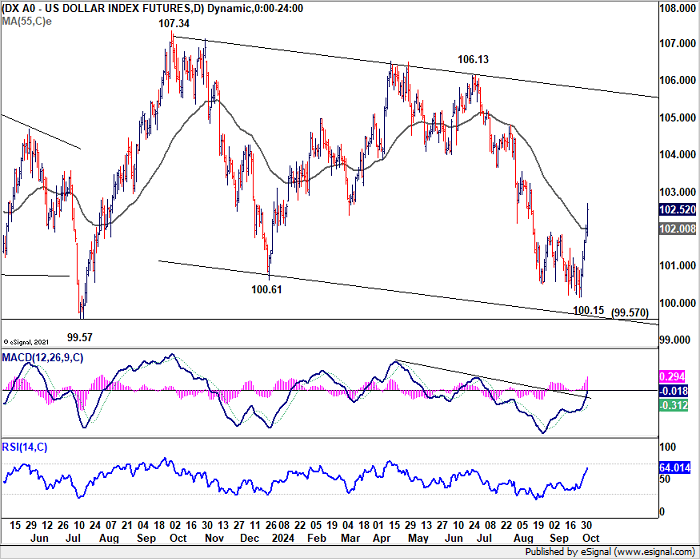
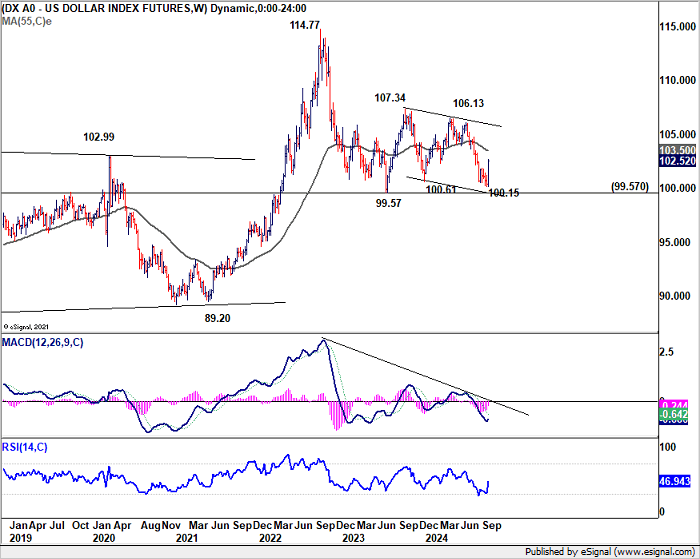
Dollar Index's strong break of 55 D EMA (now at 102.00) confirms short term bottoming at 100.15, after defending 99.57 key support (2023 low). There are various interpretations of pattern from 99.57. But for now, the base case is that rise from 100.15 is another rising leg in the sideway pattern between 99.57/107.34. Thus, sustained break of 55 W EMA (Now at 103.50) will affirm this case, and bring stronger rally back to 106.13/107.43 resistance zone.
Oil Prices Jump Amid Widening Middle East Conflict, Fears of Iranian Supply Shock Grow
Oil prices surged last week, with WTI crude jumping 9%, marking its biggest weekly gain since March 2023. This sharp rise comes amid escalating tensions in the Middle East, where the threat of a full-scale regional conflict is rapidly increasing.
Beyond its ongoing operations against Hamas in Gaza, Israel is contending with Hezbollah in Lebanon, the Houthis in Yemen, and facing increasing hostilities involving Iran, which is widely regarded as the primary supporter of these groups.
The situation has rapidly evolved, and some analysts describe it as the most severe regional conflict since the Gulf War. As the conflict widens, the potential for a major disruption in global oil supplies looms larger.
The most immediate risk is an Israeli strike on Iran’s oil infrastructure, a scenario that could send shockwaves through the global oil market. On Thursday alone, oil prices spiked by 5% after President Joe Biden suggested that the US and Israel were in discussions about such a strike. With Iran producing nearly 4 million barrels of oil per day, or roughly 4% of the world’s total supply, any disruption to its output could have a significant impact on prices.
Goldman Sachs has warned that a reduction in Iranian oil production could push prices up by USD 20 per barrel. According to their estimates, if Iran were to lose 1 million barrels of daily output, sustained over time, oil prices could experience this sharp rise by next year. This prediction assumes that OPEC+ does not step in to mitigate the impact by increasing production.
However, the rally in oil prices has been "relatively" restrained by the expectation that OPEC+ might intervene to stabilize the market. The alliance holds significant spare capacity and could choose to boost production to mitigate the impact of any supply shortfalls. This potential response is currently acting as a cap on oil's upward momentum.
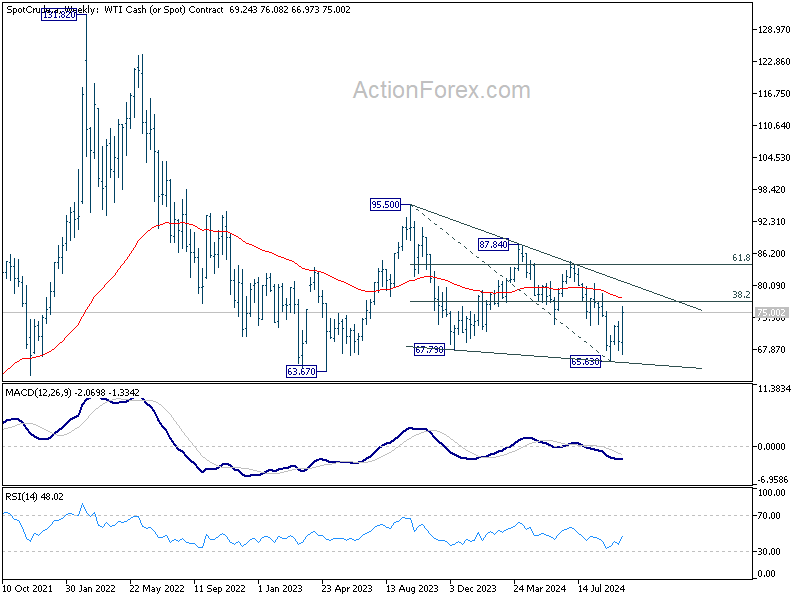
Technically, the break of 100% projection of 65.63 to 73.23 from 66.97 at 73.57 is a sign of near term upside acceleration. Rise from 65.63 short term bottom could be developing into an impulsive move.
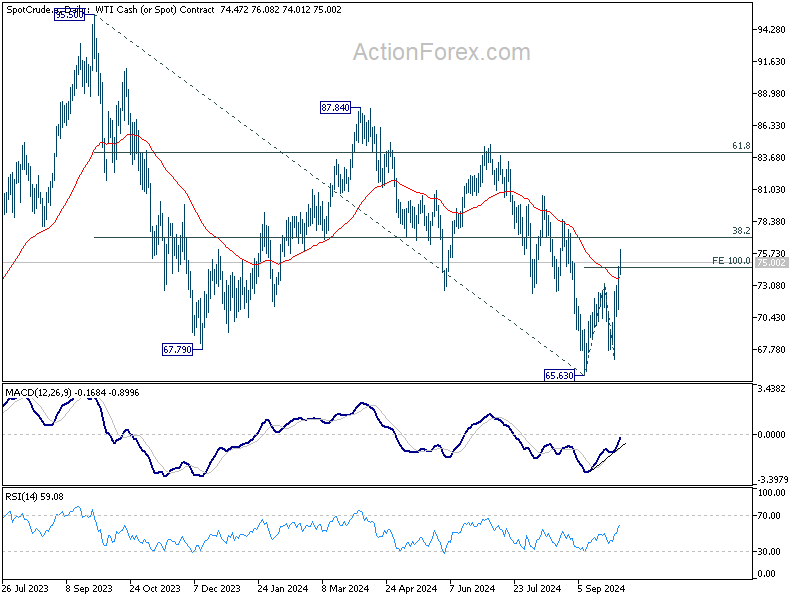
Immediate focus is now on the resistance zone between 55 W EMA (now at 77.73) and 38.2% retracement of 95.50 to 65.63 at 77.04. Decisive break there will argue that whole decline from 99.50 (2023 high) has completed with three waves down to 65.53. Further rally would then be seen to 61.8% retracement at 84.08, and possibly above.
ECB Consensus vs BoE Division; SNB's Clarity vs BoJ's Ambiguity
There are a couple of other developments to note. Firstly, the momentum for a 25bps ECB rate cut on October 17 has built up drastically in the past two weeks. Markedly souring PMI business surveys, the first below-2% inflation reading in more than three years now make it close to a done deal. The shift of the top hawk, Executive Board member Isabel Schnabel, from inflation to rising growth risks, is representative of a complete turn in the central bank, with unison among its officials.
On the other hand, BoE remains deeply divided. Governor Andrew Bailey highlighted that cost of living pressures have not been as persistent as the Bank previously feared. He noted that if positive inflation data continues, the BoE may adopt a “more activist” stance on reducing interest rates, which currently stand at 5%. But just a day later, Chief Economist Huw Pill urged “caution in” reducing monetary policy restrictions, emphasizing the need for a “gradual” approach to rate cuts. Pill warned against the risk of “cutting rates either too far or too fast.” The outcome of November's MPC meeting remains highly uncertain, and it's too earlier to have any realistic forecast before another round of inflation and growth data.
In Swiss, CPI unexpectedly slowed to just 0.8% in September, the lowest in more than three years. The downside surprise brings back the question of whether SNB will cut rates by 25bps or 50bps in December. There has been some reservations among analysts that with interest rate now at 1.00%, there is not much further down SNB could go. But the decidedly dovish new SNB Chair Martin Schlegel has cleared this question, as he “can’t rule out negative rate".
In Japan, odds of another BoJ rate hike flip-flopped with the rhetoric of new Prime Minister Shigeru Ishiba. He somehow backed off from his hawkish stance, and said Japan is not in an environment to raise interest rate further. For now, the focus would probably be first on the upcoming snap election on October 27, to see how much support Ishiba is getting from the public.
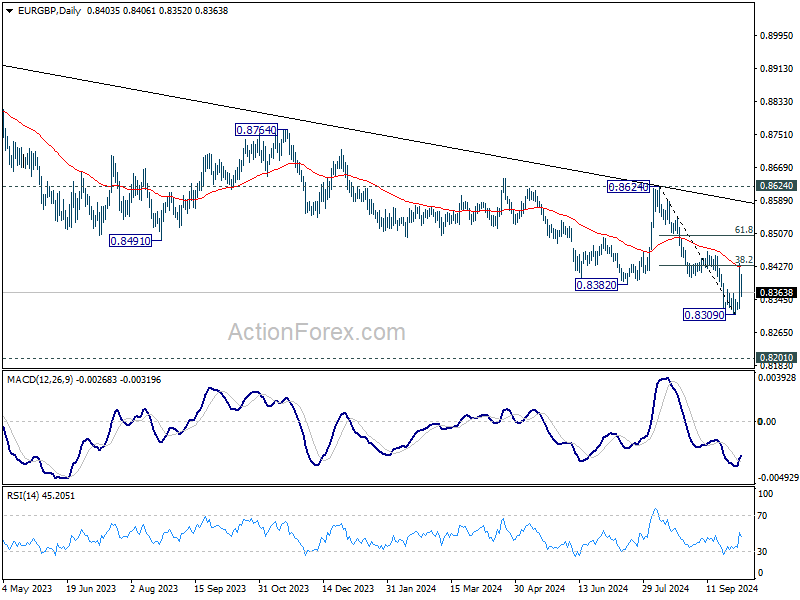
Technically, EUR/GBP had a roller-coaster ride last week with contrasting comments from two of the most influential BoE figures. But after all, with rejection by 38.2% retracement of 0.8624 to 0.8309 at 0.8429, as well as the falling 55 D EMA, near term outlook remains bearish. The larger down trend is still in favor to extend to 0.8201 key support (2022 low).
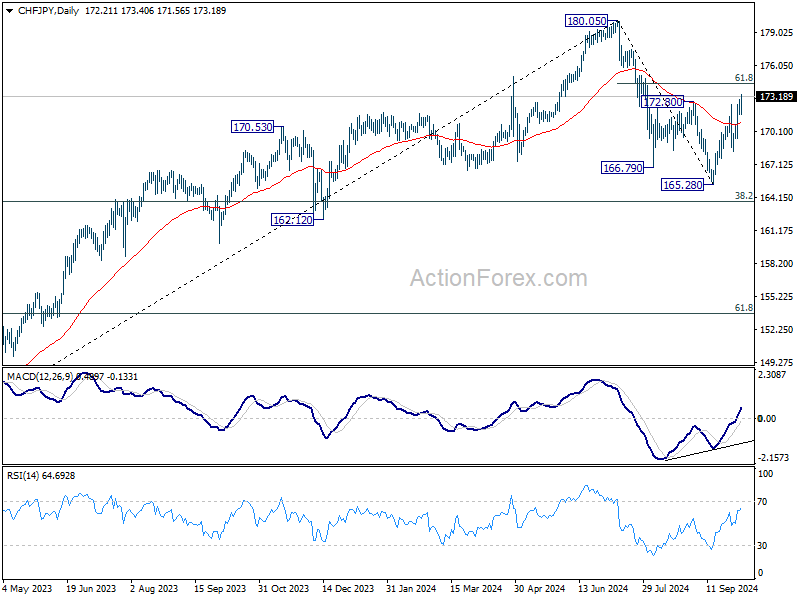
Yen's rebound faltered with the U-turn of Ishiba and ended even lower than the weak Swiss Franc. The break of 172.80 resistance indicates that whole fall from 180.05 has completed at 165.28. Rebound from there is seen as the second leg of the corrective pattern from 180.05. Further rise is expected to 61.8% retracement of 180.05 to 165.28 at 174.40. Sustained break there will target a retest on 180.05 high.
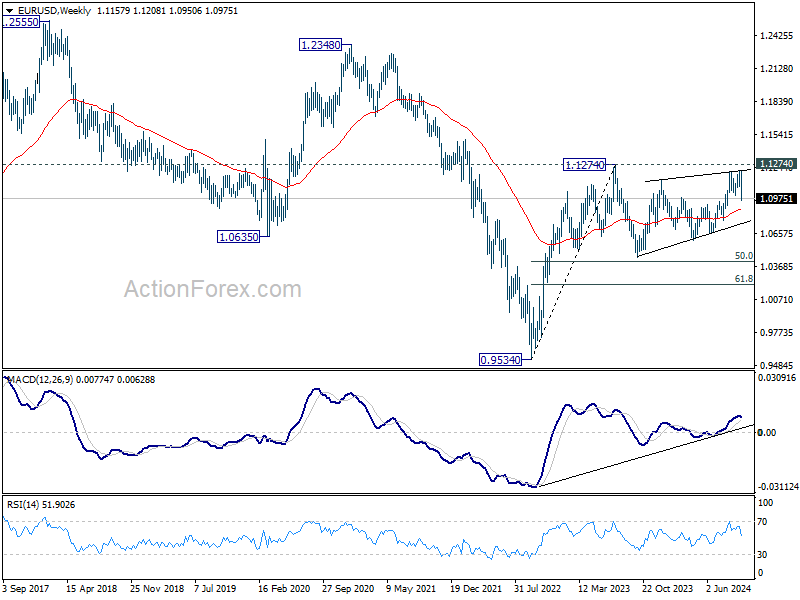
EUR/USD Weekly Outlook
EUR/USD's extended decline and strong break of 55 D EMA (now at 1.1031) last week suggest that the near term trend has reversed. Initial bias is now on the downside this week for 38.2% retracement of 1.0447 to 1.1213 at 1.0920. Sustained break there will argue that fall from 1.1213 is the third leg of the corrective pattern from 1.1274. In this case, deeper decline would be seen to 61.8% retracement at 1.0740 next. On the upside, above 1.1039 minor resistance will turn intraday bias neutral first.
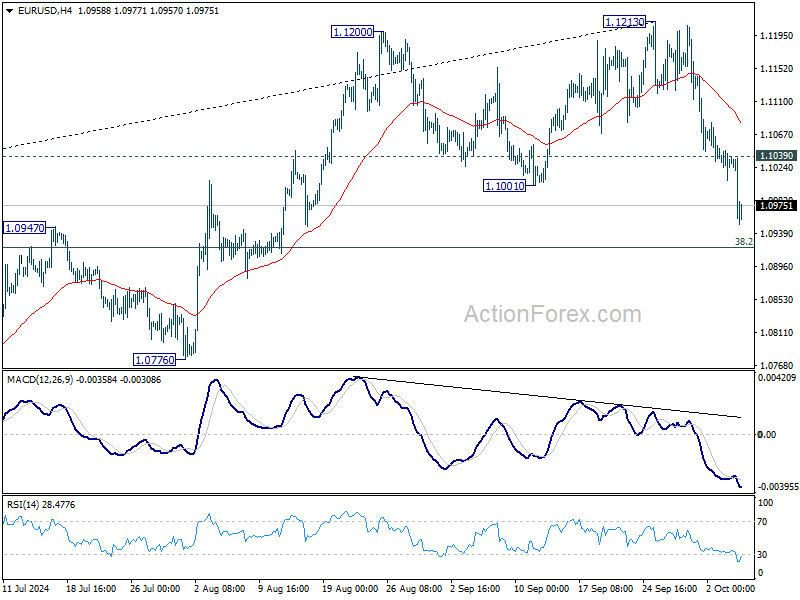
In the bigger picture, rejection by 1.1274 resistance (2023 high) suggests that corrective pattern from there (2023 high) is not completed yet. Instead, decline from 1.1213 might be another falling leg. Sustained break of 55 W EMA (now at 1.0877) will validate this case, and bring deeper fall towards 50% retracement of 0.9534 (2022 low) to 1.1274 at 1.0404.
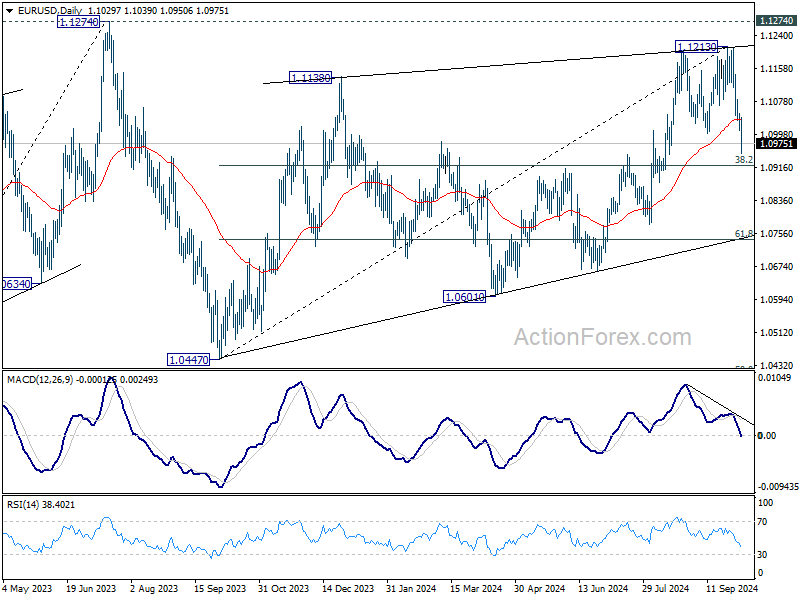
In the long term picture, a long term bottom is in place at 0.9534 (2022 low). But for now, EUR/USD is struggling to sustain above 55 M EMA (now at 1.1018). Outlook is neutral at best at this point.
EUR/USD Weekly Outlook
EUR/USD's extended decline and strong break of 55 D EMA (now at 1.1031) last week suggest that the near term trend has reversed. Initial bias is now on the downside this week for 38.2% retracement of 1.0447 to 1.1213 at 1.0920. Sustained break there will argue that fall from 1.1213 is the third leg of the corrective pattern from 1.1274. In this case, deeper decline would be seen to 61.8% retracement at 1.0740 next. On the upside, above 1.1039 minor resistance will turn intraday bias neutral first.
In the bigger picture, rejection by 1.1274 resistance (2023 high) suggests that corrective pattern from there (2023 high) is not completed yet. Instead, decline from 1.1213 might be another falling leg. Sustained break of 55 W EMA (now at 1.0877) will validate this case, and bring deeper fall towards 50% retracement of 0.9534 (2022 low) to 1.1274 at 1.0404.
In the long term picture, a long term bottom is in place at 0.9534 (2022 low). But for now, EUR/USD is struggling to sustain above 55 M EMA (now at 1.1018). Outlook is neutral at best at this point.
USD/JPY Weekly Outlook
USD/JPY's strong rebound and break of 38.2% retracement of 161.94 to 139.57 at 148.11 argued that fall from 161.94 has completed already. Rise from 139.57 is now seen as the second leg of the corrective pattern from 161.94. Initial bias stays on the upside this week and further rally should be seen to 61.8% retracement at 153.39 next. On the downside, below 145.91 minor support will turn intraday bias neutral again.
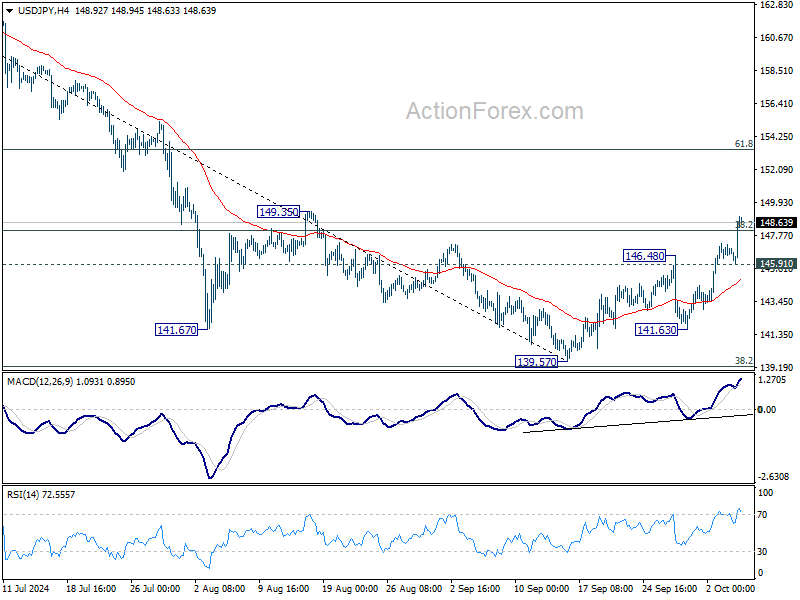
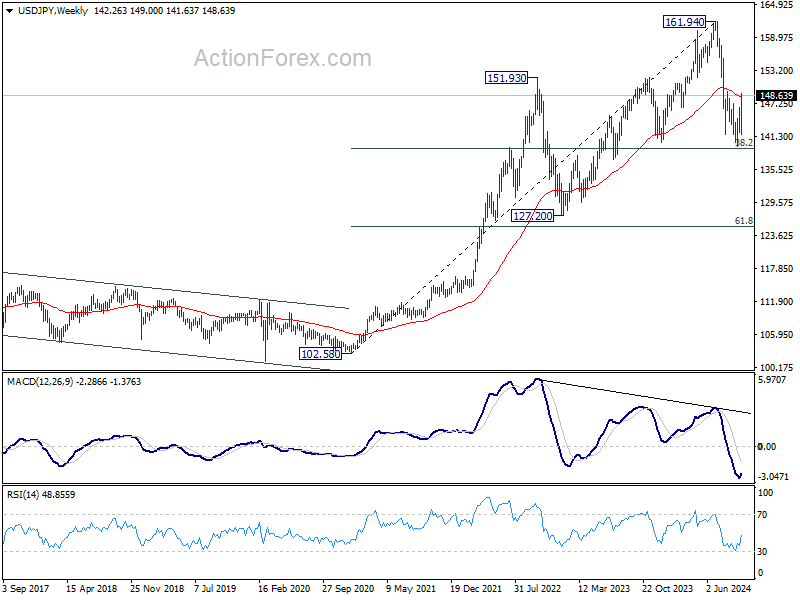
In the bigger picture, price actions from 161.94 are seen as a corrective pattern from rise form 102.58 (2021 low). The range of medium term consolidation should now be set between 38.2% retracement of 102.58 to 161.94 at 139.26 and 161.94. Nevertheless, sustained break of 139.26 would open up deeper medium term decline to 61.8% retracement at 125.25.
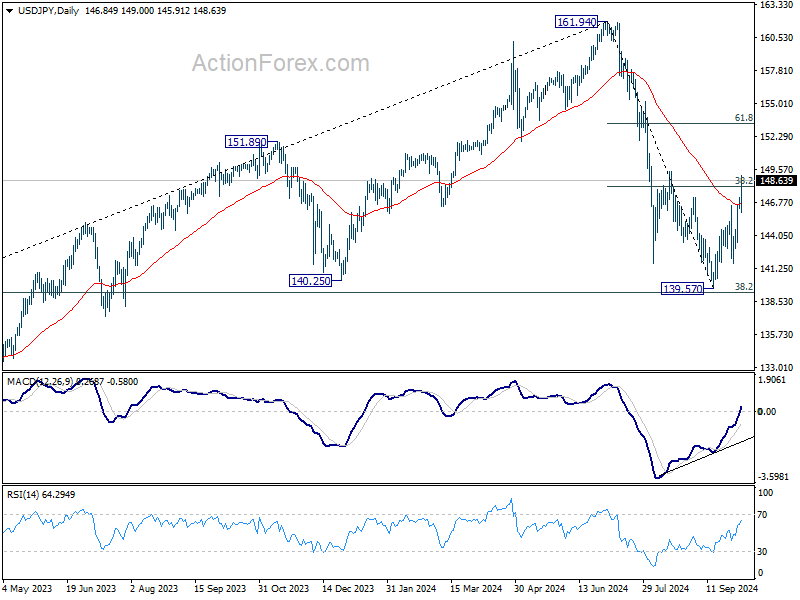
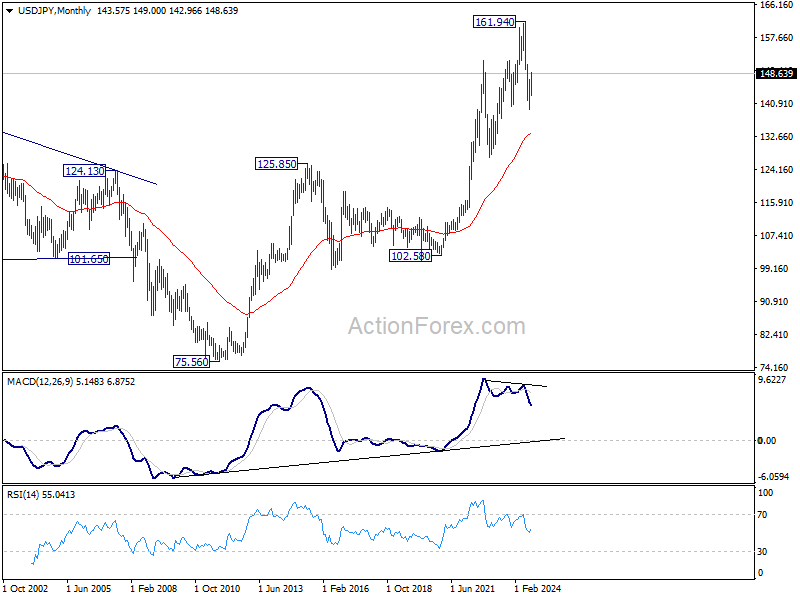
In the long term picture, it's still early to conclude that up trend from 75.56 (2011 low) has completed. However, a medium term corrective phase should have commenced, with risk of deep correction towards 55 M EMA (now at 133.73).
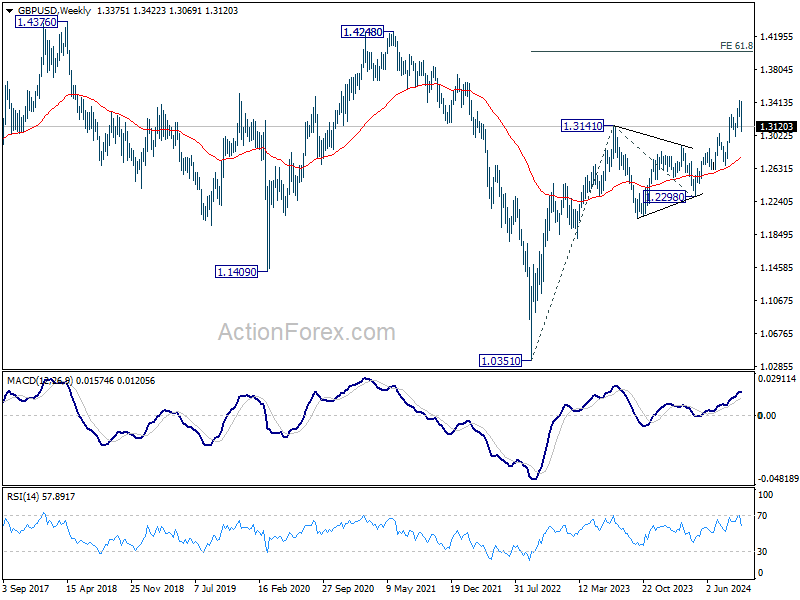
GBP/USD Weekly Outlook
GBP/USD's break of 1.3265 resistance turned support last week confirmed short term topping at 1.3433. Initial bias stays on the downside this week for 1.3000 cluster support (38.2% retracement of 1.2298 to 1.3433 at 1.2999). Strong support should be seen there to bring rebound. On the upside, above 1.3174 minor resistance will turn intraday bias neutral first.
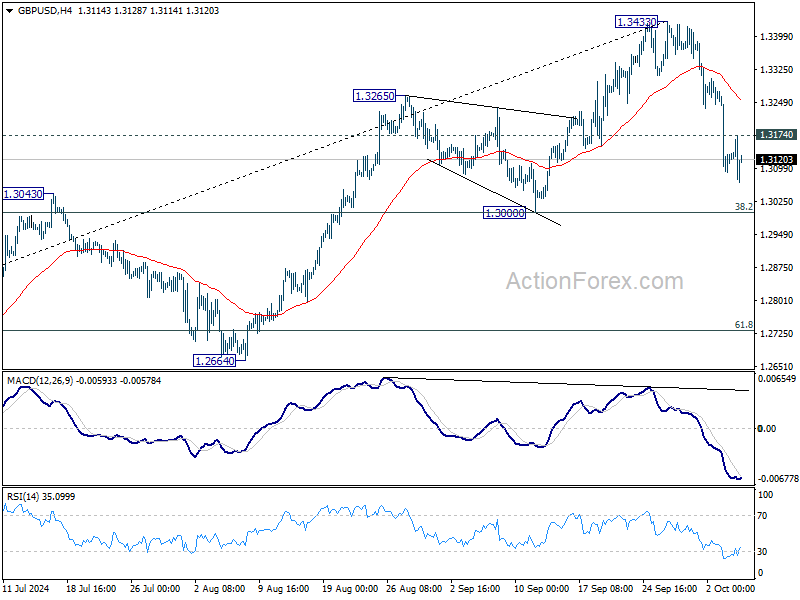
In the bigger picture, as long as 1.3000 support holds, the up trend from 1.0351 (2022 low) is still in progress. Next target is 61.8% projection of 1.0351 to 1.3141 from 1.2298 at 1.4022. However, considering mild bearish divergence condition in D MACD, decisive break of 1.3000 will argue that a medium term top is already in place, and bring deeper fall back to 1.2664 support next.
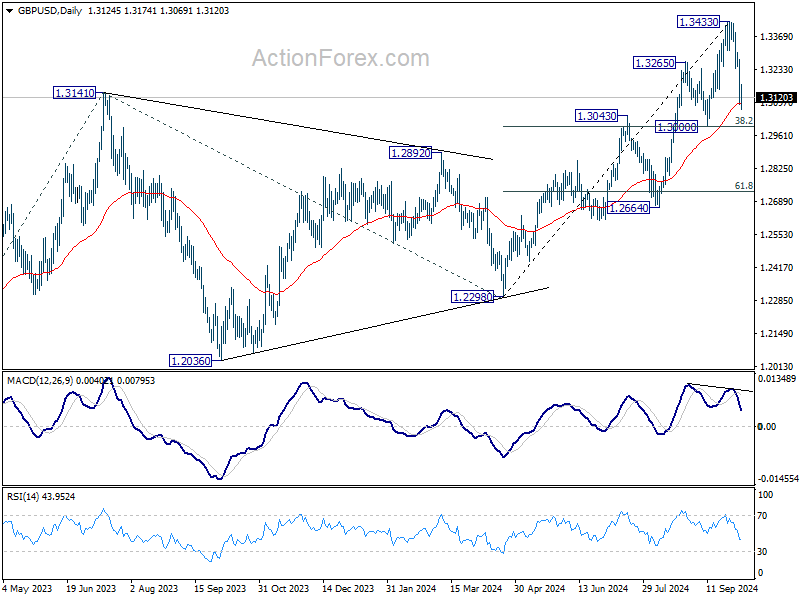
In the long term picture, as long as 1.2298 support holds, rise from 1.0351 long term bottom is expected to continue. The strong break of 55 M EMA (now at 1.2811) is a sign of bullish trend reversal. Yet, break of 1.4248 structural resistance is needed confirm. Otherwise, price actions from 1.0351 could just be part of a consolidation pattern.
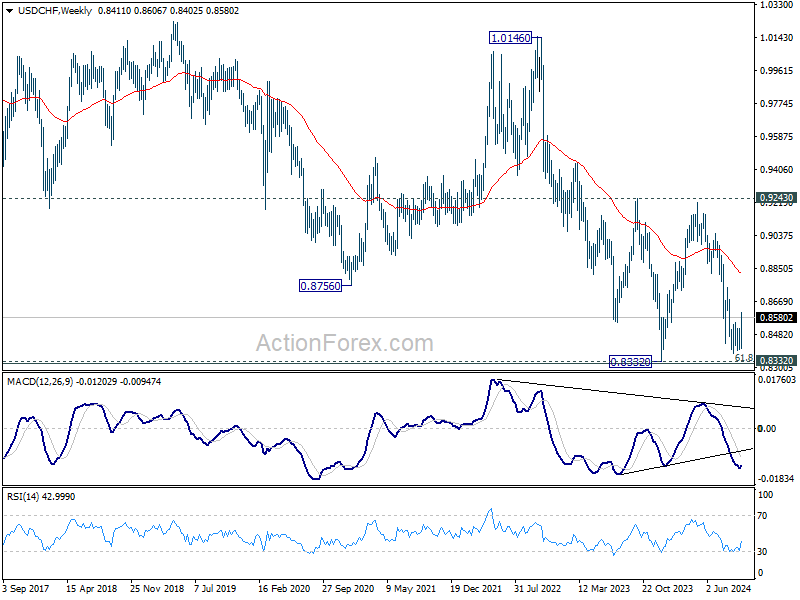
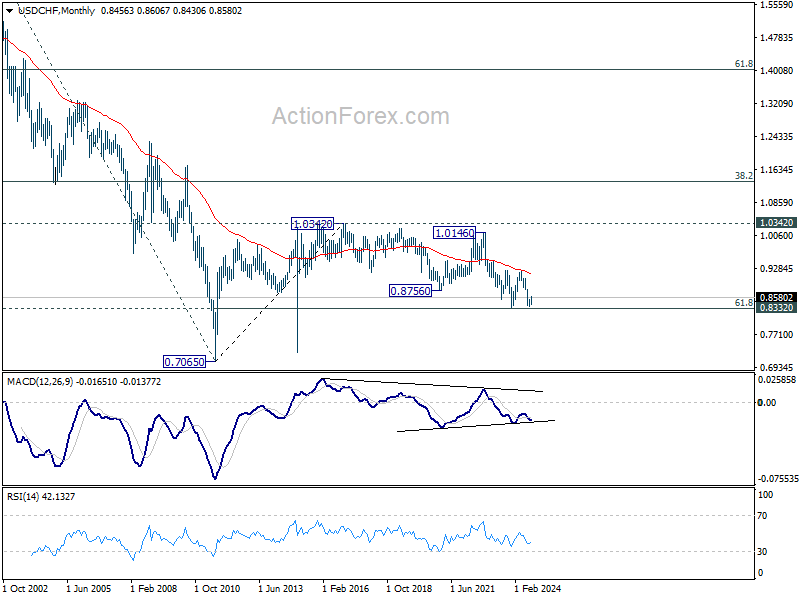
USD/CHF Weekly Outlook
USD/CHF's rebound from 0.8374 resumed last week by breaking through 0.8548 resistance last week. Initial bias stays on the upside this week for 38.2% retracement of 0.9223 to 0.8374 at 0.8698. Sustained break there will argue that fall from 0.9223 has completed after defending 0.8332 low. Next target will be 61.8% retracement at 0.8899. On the downside, below 0.8499 minor support will turn intraday bias neutral again first.
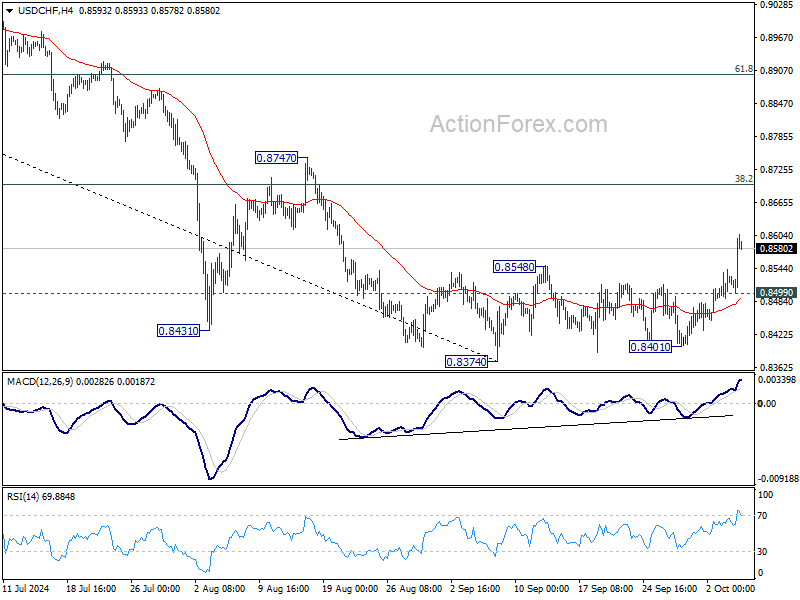
In the bigger picture, price actions from 0.8332 (2023 low) are currently seen as a medium term corrective pattern, with fall from 0.9223 as the second leg. Strong support could be seen from 0.8332 to bring rebound. Yet, overall outlook will continue to stay bearish as long as 0.9243 resistance holds. Firm break of 0.8332, however, will resume larger down trend from 1.0146 (2022 high).

In the long term picture, price action from 0.7065 (2011 low ) are seen as a corrective pattern to the multi-decade down trend from 1.8305 (2000 high). Fall from 1.0342 (2016 high) is seen as the second leg. Rejection by 55 M EMA suggest that this fall is in progress. Break of 61.8% retracement of 0.7065 to 1.0342 at 0.8317 will pave the way back to 0.7065.
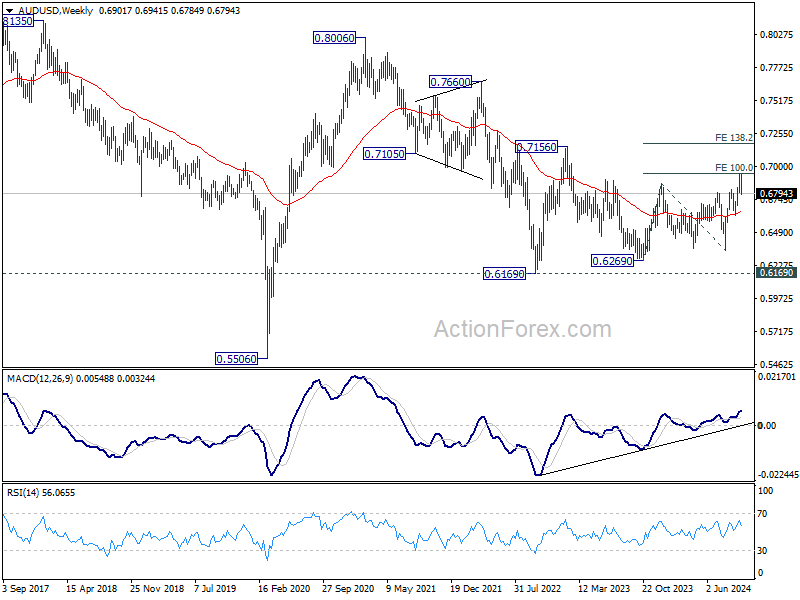
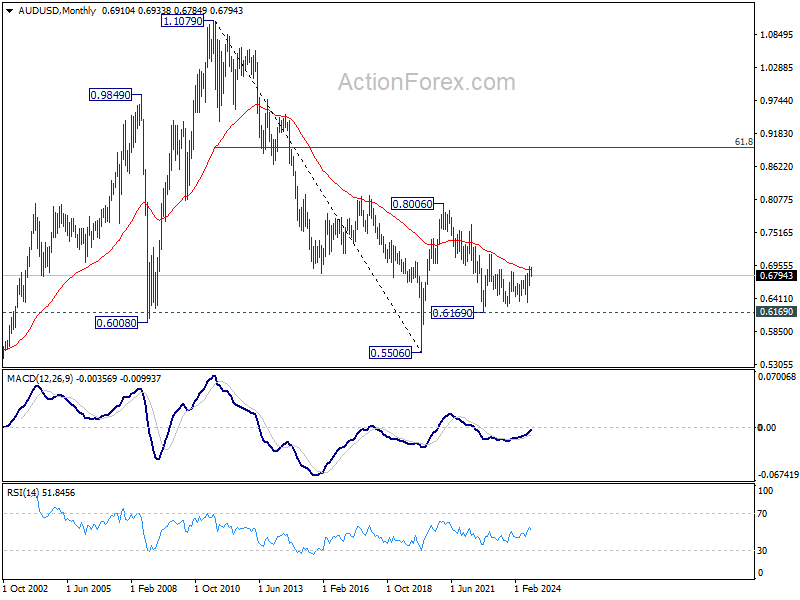
AUD/USD Weekly Report
A short term top should be formed at 0.6941 last week as AUD/USD broke through 0.6823 resistance turned support. Initial bias is now on the downside this week for 55 D EMA (now at 0.6744). Sustained break there should confirm rejection by 0.6941 fibonacci level, and bring deeper decline to 0.6621 support. On the upside, above 0.6854 minor resistance will turn intraday bias neutral first.
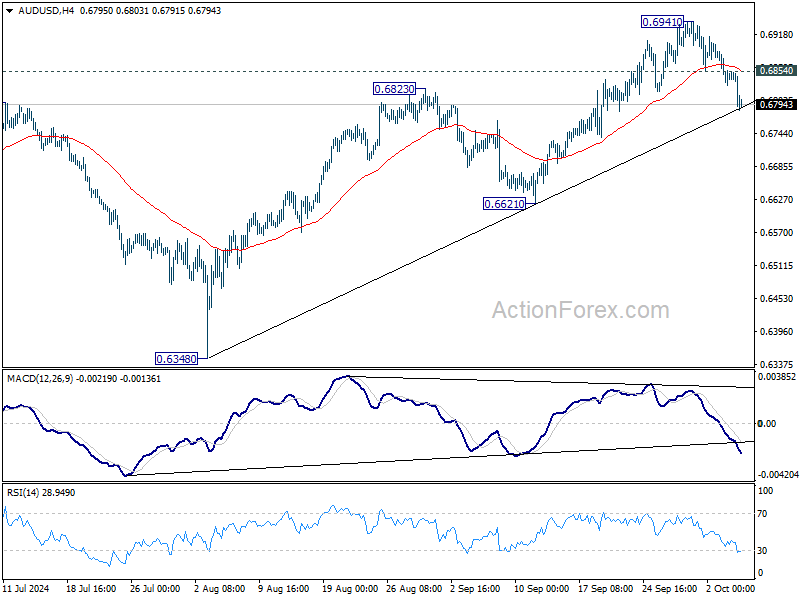
In the bigger picture, overall, price actions from 0.6169 (2022 low) are seen as a medium term corrective pattern, with rise from 0.6269 as the third leg. Firm break of 100% projection of 0.6269 to 0.6870 from 0.6340 at 0.6941 will target 138.2% projection at 0.7179. However, break of 0.6621 support will argue that rise from 0.6269 has completed and bring deeper fall back to 0.6269/6348 support zone.
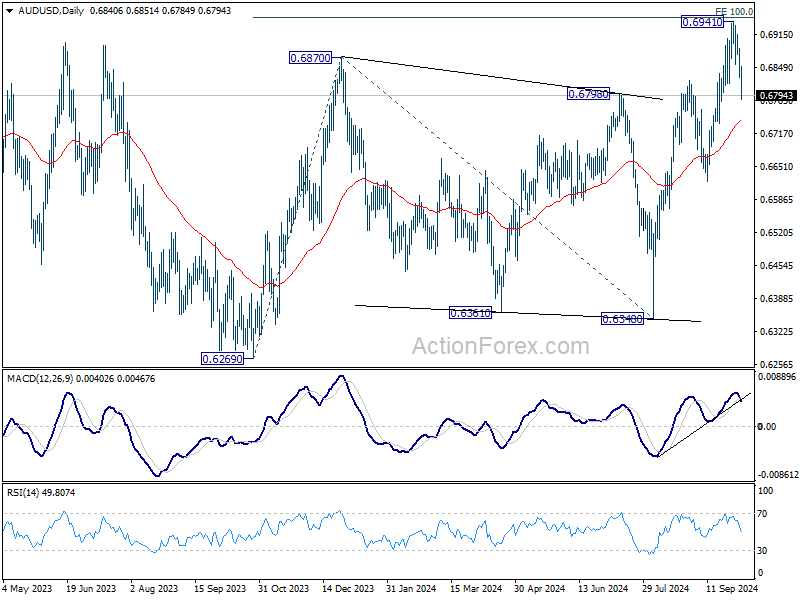
In the long term picture, the down trend from 1.1079 (2011 high) should have completed at 0.5506 (2020 low) already. It's unsure yet whether price actions from 0.5506 are developing into a corrective pattern, or trend reversal. But in either case, fall from 0.8006 is seen as the second leg of the pattern. Firm of 0.7156 resistance will argue that the third leg has already started towards 0.8006.