
Sample Category Title
USD/CAD Daily Outlook
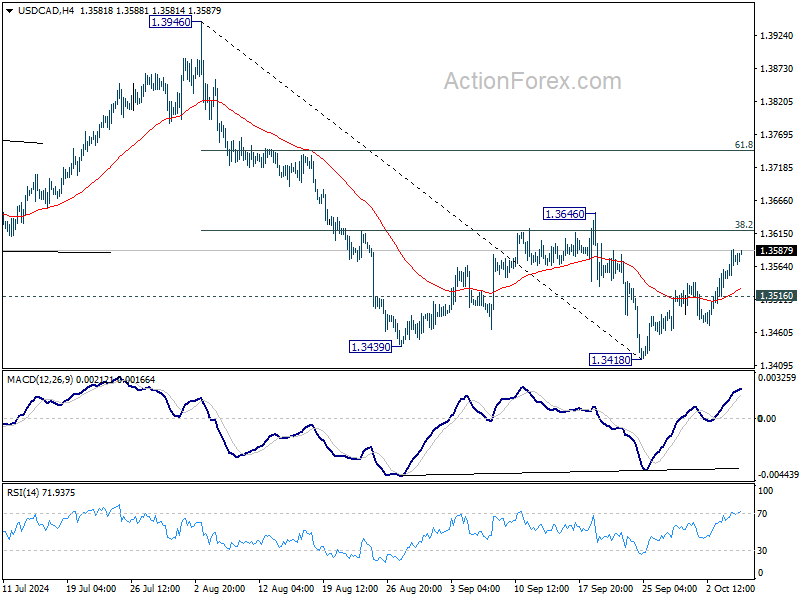
Daily Pivots: (S1) 1.3538; (P) 1.3565; (R1) 1.3602; More...
Intraday bias in USD/CAD remains mildly on the upside for the moment. Rebound from 1.3148 is in progress for 38.2% retracement of 1.3946 to 1.3418 at 1.3505. Decisive break there will target 61.8% retracement at 1.3559 next. On the downside, however, break of 1.3516 minor support will turn bias to the downside, to resume the fall from 1.3946 through 1.3418.
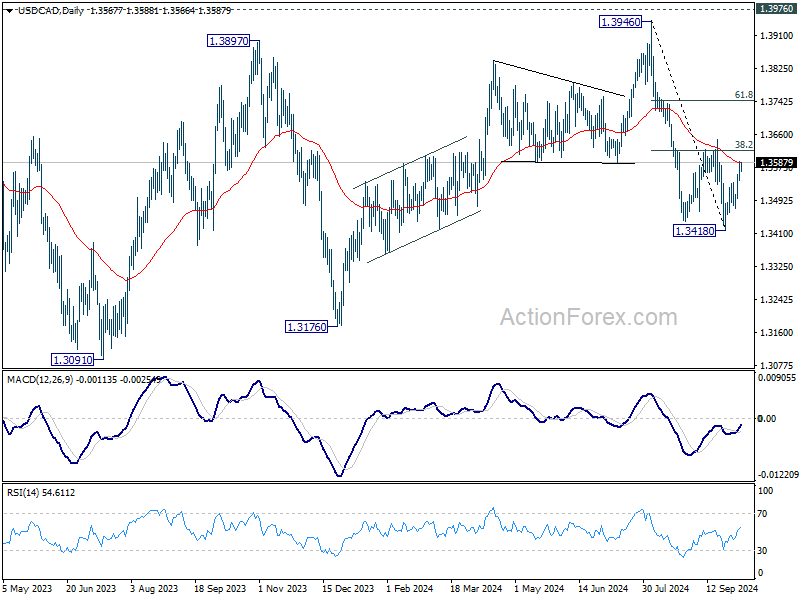
In the bigger picture, corrective pattern from 1.3976 (2022 high) is extending with another falling leg. While deeper decline could be seen, strong support should emerge above 1.2947 resistance turned support to bring rebound. Rise from 1.2005 (2021 low) is still in favor to resume at a later stage.
AUD/USD Daily Report
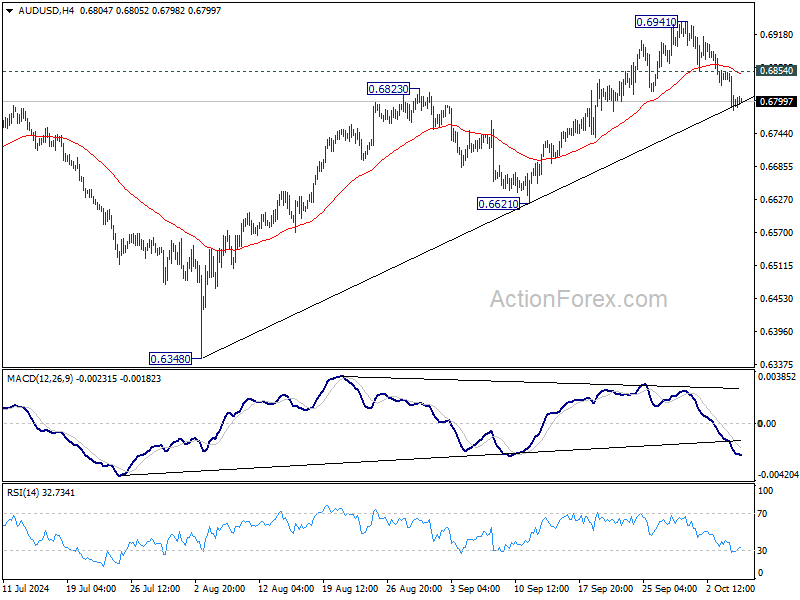
Daily Pivots: (S1) 0.6769; (P) 0.6811; (R1) 0.6835; More...
Intraday bias in AUD/USD remains on the downside for the moment. Fall from 0.6941 short term top is in progress for 55 D EMA (now at 0.6744). Sustained break there should confirm rejection by 0.6941 fibonacci level, and bring deeper decline to 0.6621 support. On the upside, above 0.6854 minor resistance will turn intraday bias neutral first.
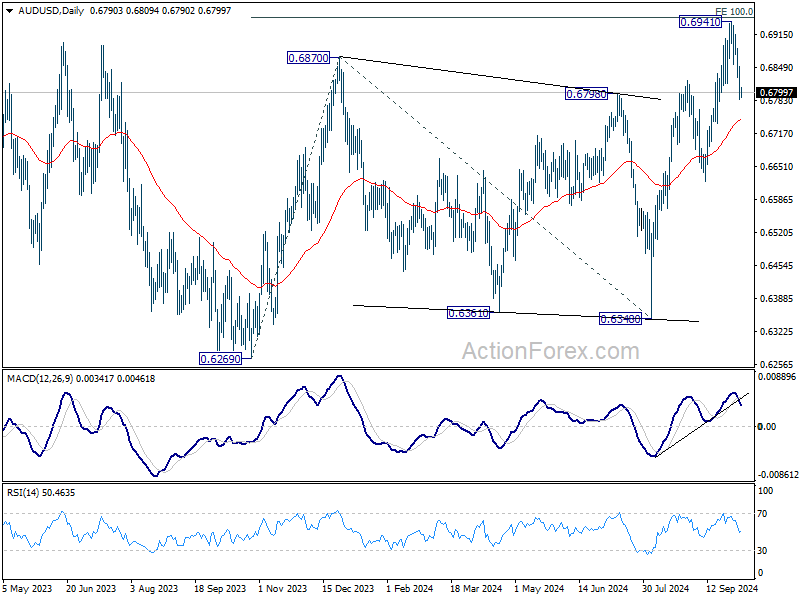
In the bigger picture, overall, price actions from 0.6169 (2022 low) are seen as a medium term corrective pattern, with rise from 0.6269 as the third leg. Firm break of 100% projection of 0.6269 to 0.6870 from 0.6340 at 0.6941 will target 138.2% projection at 0.7179. However, break of 0.6621 support will argue that rise from 0.6269 has completed and bring deeper fall back to 0.6269/6348 support zone.
EUR/USD Daily Outlook
Daily Pivots: (S1) 1.0937; (P) 1.0989; (R1) 1.1026; More....
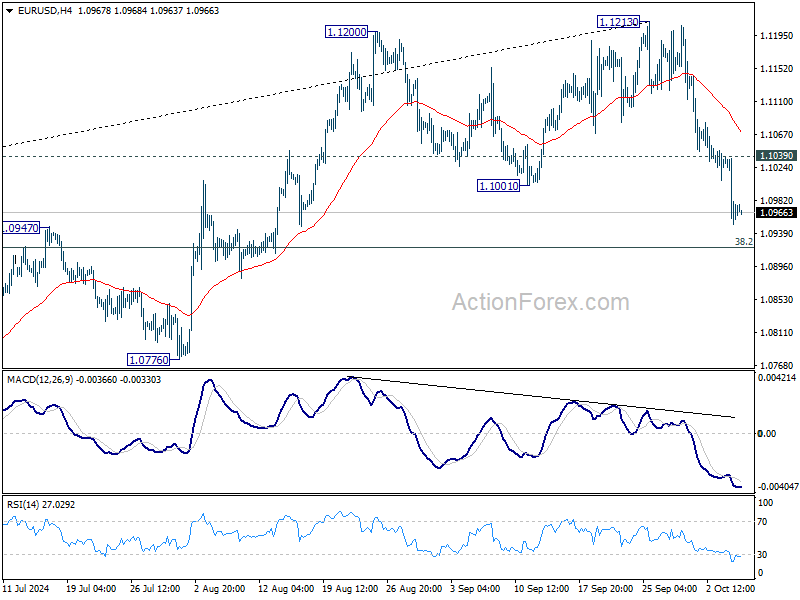
Intraday bias in EUR/USD remains on the downside for the moment. Fall from 1.1213 is in progress for 38.2% retracement of 1.0447 to 1.1213 at 1.0920. Sustained break there will argue that fall from 1.1213 is the third leg of the corrective pattern from 1.1274. In this case, deeper decline would be seen to 61.8% retracement at 1.0740 next. On the upside, above 1.1039 minor resistance will turn intraday bias neutral first.
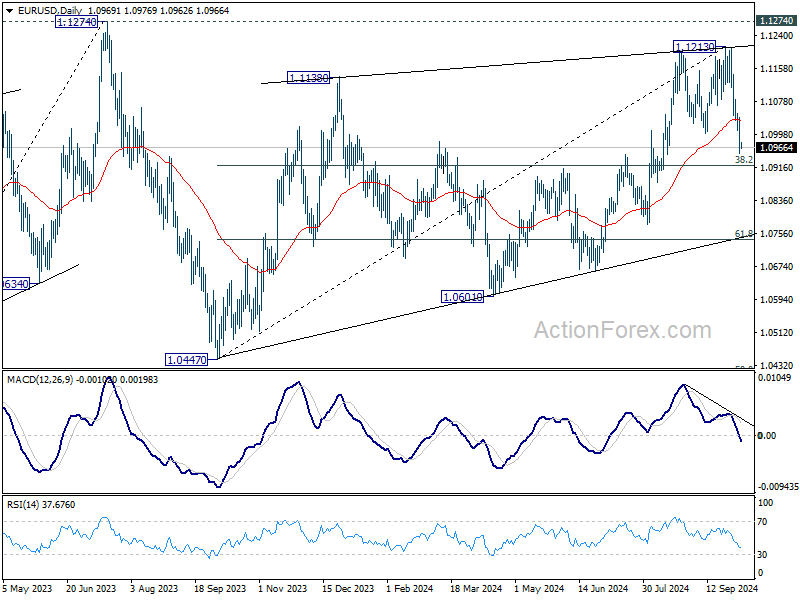
In the bigger picture, rejection by 1.1274 resistance suggests that corrective pattern from 1.1274 (2023 high) is not completed yet. Instead, decline from 1.1213 might be another falling leg. Sustained break of 55 W EMA (now at 1.0877) will validate this case, and bring deeper fall towards 1.0447 support again.
GBP/USD Daily Outlook
Daily Pivots: (S1) 1.3072; (P) 1.3123; (R1) 1.3177; More...
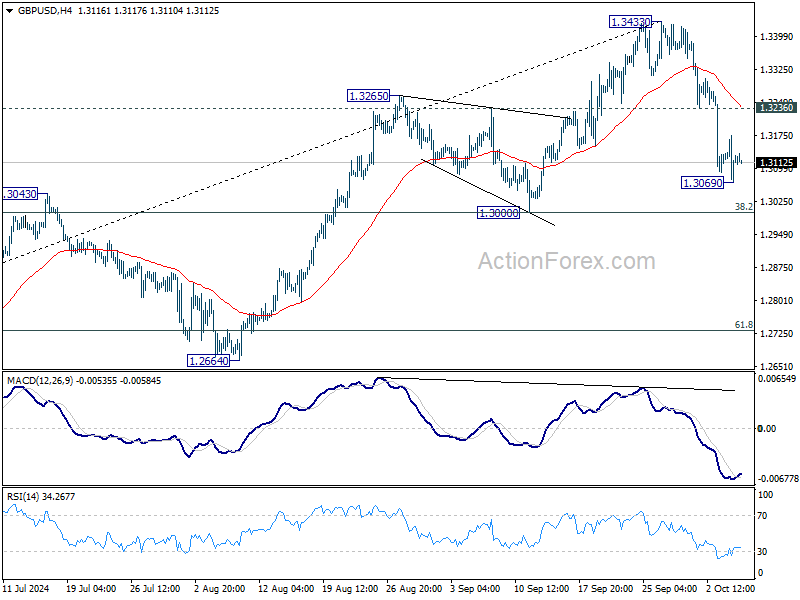
Intraday bias in GBP/USD is turned neutral first with 4H MACD crossed above signal line. Some consolidations would be seen above 1.3069 temporary low. On the downside, below 1.3069 will target 1.3000 cluster support (38.2% retracement of 1.2298 to 1.3433 at 1.2999). Strong support should be seen there to bring rebound. On the upside, break of 1.3236 resistance will argue that pullback from 1.3433 has completed, and turn bias back to the upside for retesting this high.
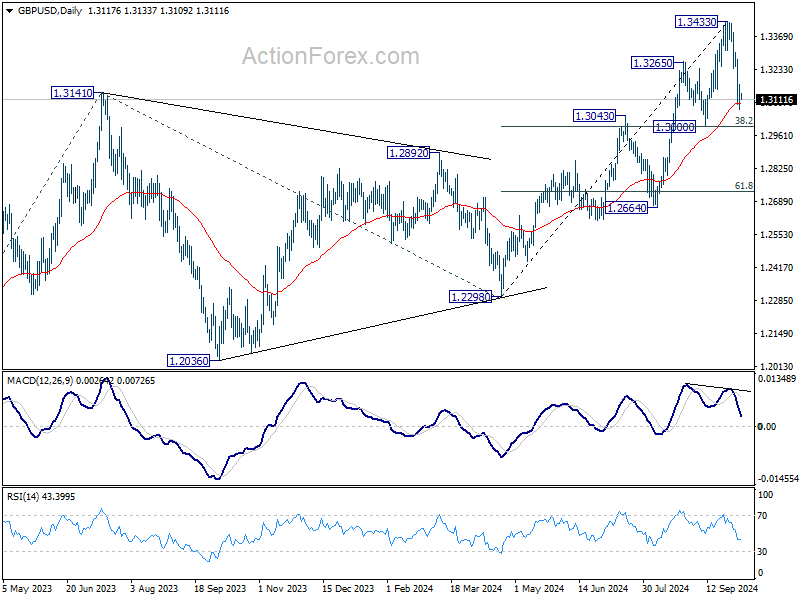
In the bigger picture, as long as 1.3000 support holds, the up trend from 1.0351 (2022 low) is still in progress. Next target is 61.8% projection of 1.0351 to 1.3141 from 1.2298 at 1.4022. However, considering mild bearish divergence condition in D MACD, decisive break of 1.3000 will argue that a medium term top is already in place, and bring deeper fall back to 1.2664 support next.
USD/CHF Daily Outlook
Daily Pivots: (S1) 0.8518; (P) 0.8563; (R1) 0.8626; More…
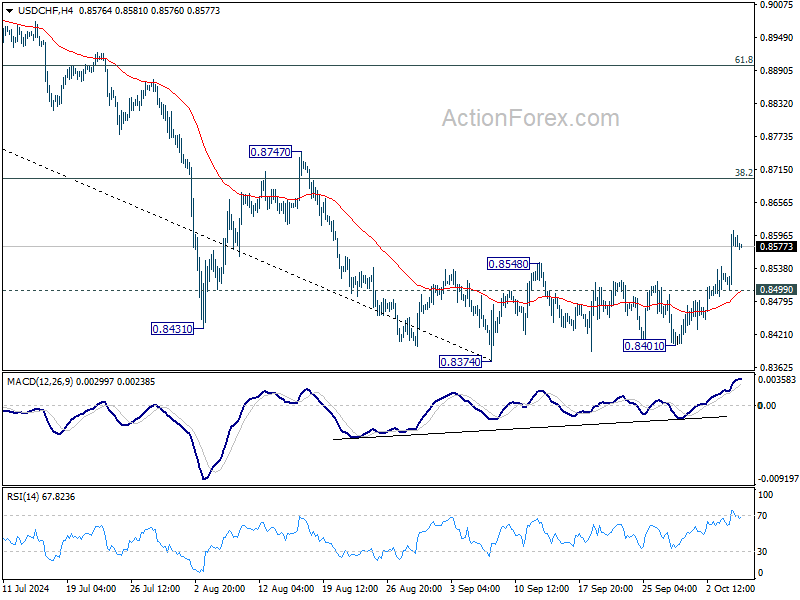
Intraday bias in USD/CHF remains on the upside at this point. Rebound from 0.8374 is in progress for 38.2% retracement of 0.9223 to 0.8374 at 0.8698. Sustained break there will argue that fall from 0.9223 has completed after defending 0.8332 low. Next target will be 61.8% retracement at 0.8899. On the downside, below 0.8499 minor support will turn intraday bias neutral again first.
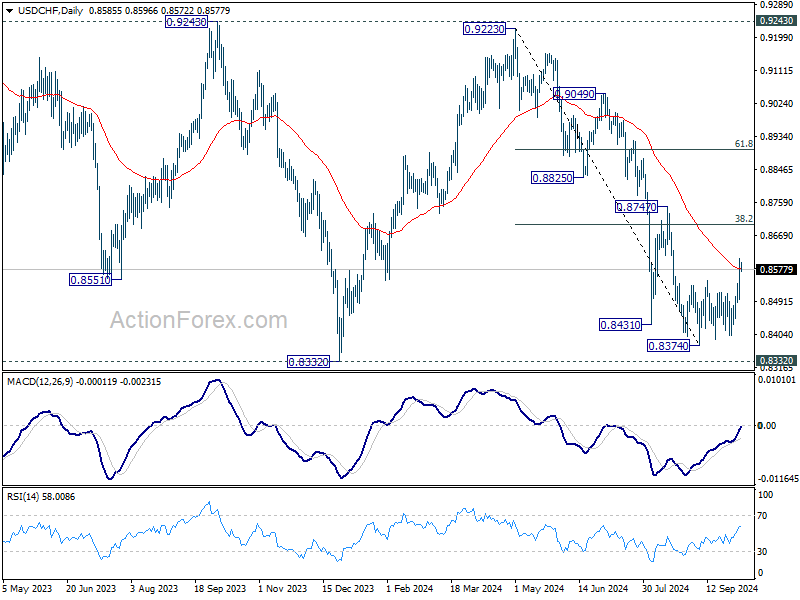
In the bigger picture, price actions from 0.8332 (2023 low) are currently seen as a medium term corrective pattern, with fall from 0.9223 as the second leg. Strong support could be seen from 0.8332 to bring rebound. Yet, overall outlook will continue to stay bearish as long as 0.9243 resistance holds. Firm break of 0.8332, however, will resume larger down trend from 1.0146 (2022 high).
USD/JPY Daily Outlook
Daily Pivots: (S1) 146.78; (P) 147.89; (R1) 149.86; More...
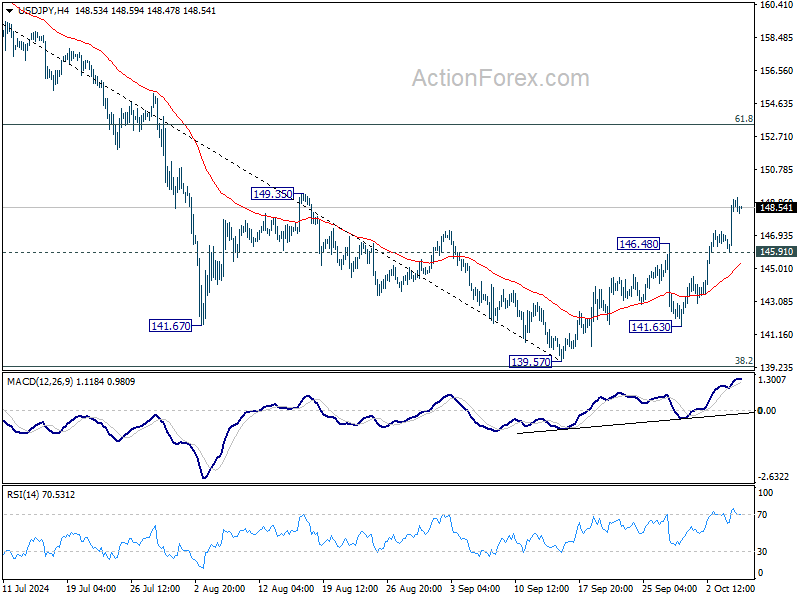
Intraday bias in USD/JPY remains on the upside for the moment. Rise from 139.57 is seen as the second leg of the corrective pattern from 161.94. Break of 149.35 resistance will target 61.8% retracement of 161.94 to 139.57 at 153.39 next. On the downside, below 145.91 minor support will turn intraday bias neutral again.
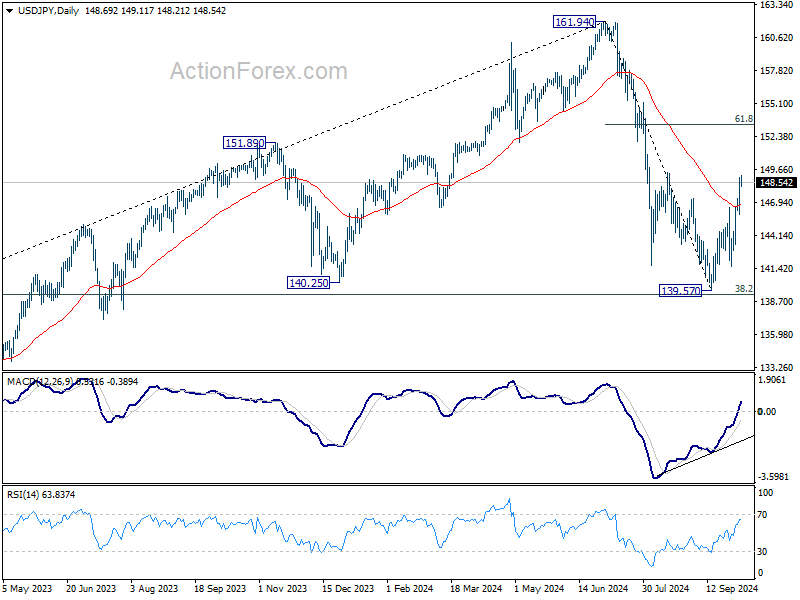
In the bigger picture, price actions from 161.94 are seen as a corrective pattern to rise from 102.58 (2021 low). The range of medium term consolidation should now be set between 38.2% retracement of 102.58 to 161.94 at 139.26 and 161.94. Nevertheless, sustained break of 139.26 would open up deeper medium term decline to 61.8% retracement at 125.25.
Japan Signals “Sense of Urgency” on Yen Depreciation as USD/JPY Hits 149
Japan’s verbal intervention re-entered the spotlight today as USD/JPY briefly surged above the 149 mark amid a quiet Asian session. Yen continues to face pressure from the strong rebound in Dollar, driven by traders abandoning bets on of a 50bps Fed rate cut in November. Additionally, rising US and European yields exacerbated Yen weakness. Japanese officials appeared to be increasingly concerned about further depreciation through the 150 psychological level.
Japan’s top currency diplomat, Atsushi Mimura, told reporters that the government is monitoring currency market movements, including speculative trading, with a "sense of urgency." This language mirrors the verbal intervention tactics of Mimura’s predecessor, Masato Kanda. Separately, newly appointed Finance Minister Katsunobu Kato added that rapid currency fluctuations could impact corporate activities and people's lives, stressing that the government will consider appropriate actions while observing the effects.
While today's market activity might remain subdued with only second-tier economic data on the agenda, traders are looking ahead to key events this week, including U.S. CPI, UK GDP, Canadian employment data, and the Reserve Bank of New Zealand’s rate decision. Fed officials are scheduled to speak today, but they are unlikely to provide any significant new information, likely reaffirming expectations for cautious Fed policy easing.
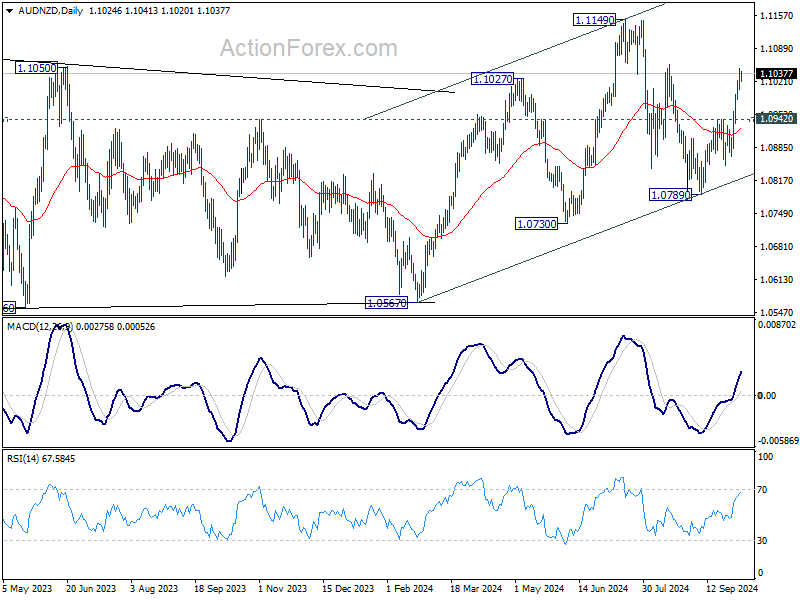
Technically, AUD/NZD's rise from 1.0789 accelerated high last week and the development suggests that pullback from 1.1149 has already completed at 1.0789. Further rally is expected as long as 1.0942 resistance turned support holds, towards 1.1149. However, strong resistance could be seen from there, at least on the first attempt, to bring pull back. While the RBNZ’s upcoming rate cut may provide fuel for the rally, breaking through 1.1149 will require more clarity on the policy paths of both the RBA and RBNZ into next year.
In Asia, at the time of writing, Nikkei is up 2.21%. Hong Kong HSI is up 1.38%. China is on the last day of holiday. Singapore Strait Times is up 0.21%. Japan 10-year JGB yield is up 0.0381 at 0.924.
ECB's Villeroy warns of undershooting inflation target
In an interview with La Repubblica, ECB Governing Council member François Villeroy de Galhau noted a shift in the "balance of risks" for Eurozone economy. He said that for the past two years, the primary concern was overshooting the ECB’s 2% inflation target. However, Villeroy emphasized that the focus is now also on the risk of "undershooting" the target due to "weak growth" and maintaining "restrictive monetary policy for too long."
Villeroy emphasized the importance of maintaining "full optionality" for this month's monetary policy meeting, stressing that a pragmatic approach—evaluating the situation "meeting by meeting"—is essential. This adds to the growing chorus within the ECB suggesting that October meeting could bring about further easing if conditions warrant it.
Looking ahead, Villeroy suggested that if inflation sustainably returns to 2% next year, and growth in Europe remains sluggish, "there won’t be any reason for our monetary policy to remain restrictive".
NZIER shadow board evenly split on size of RBNZ rate cut this week
The NZIER Shadow Board is evenly divided on whether RBNZ should lower the OCR by 25 or 50 basis points in its upcoming meeting this week.
Those advocating for a 50bps cut highlighted ongoing economic weakness and rising excess capacity, as well as easing headline inflation and inflation expectations, which they believe justify a larger reduction in rates.
Other members preferred a more cautious 25bps cut, citing persistent risks from non-tradable inflation and recommending a more measured approach.
Looking ahead, the Shadow Board agrees that RBNZ should continue with its easing cycle over the next year, with most members expecting OCR to settle between 3.5% and 4.5%.Some members urged a gradual, data-driven approach, while others argued for more rapid cuts, pointing to weak economic conditions that may require further stimulus.
RBNZ to cut 50bps; US CPI, UK GDP and Canada jobs in focus
RBNZ is expected to accelerate its monetary easing this week, with a 50bps rate cut to lower the OCR to 4.75%. After the surprise 25bps cut in August, the inflation outlook has further shifted, with expectations now indicating that price pressures will settle near 2% by Q3. With inflation under control and the economy cooling as a result of prior tightening, RBNZ is indeed facing risk of inflation undershooting its target if it doesn’t act swiftly. This has heightened the urgency to bring rates back to more neutral levels.
According to a recent Bloomberg survey, the majority of economists—13 out of 17—are predicting a 50bps cut, while the remaining 4 expect a more cautious 25bps move. Market data also supports this outlook, with swap pricing in roughly 75% chance of a 50bps reduction. The bigger question, however, is where RBNZ sees the terminal rate and how quickly it intends to get there. These insights are likely to be revealed in the November Monetary Policy Statement rather than at this week's meeting.
Globally, RBA, Fed, and ECB will release meeting minutes. RBA is expected to maintain a hawkish tone in its minutes, signaling that inflation concerns remain and that rate cuts are not yet on the horizon. ,Fed minutes are likely to confirm that the 50bps rate cut in September was a corrective measure after July’s inaction, and not a signal of a shift toward faster easing. Meanwhile, ECB’s minutes may hold less significance ahead of the October 17 meeting, given the rapid changes in economic conditions and sentiment.
On the data front, US CPI figures will be a key focus for the market. Last week’s strong US non-farm payrolls report has largely ruled out the possibility of a 50bps rate cut from Fed in November. However, any upside surprise in the inflation data could tilt expectations between a no-change scenario and a more measured 25bps cut. In the UK, GDP data will be closely monitored as BoE remains poised for another potential rate cut in November, though the decision is highly dependent on upcoming data. Canada is another focal point, as speculation grows around a possible 50bps rate cut by BoC in October. Inflation has already dropped to 2%, and any significant weakness in Canada’s employment data could push the BoC further towards a dovish stance.
Here are some highlights for the week:
- Monday: Japan leading indicators; Germany factory orders; Swiss foreign currency reserves; Eurozone Sentix investor confidence, retail sales.
- Tuesday: Australia RBA minutes, Westpac consumer sentiment, NAB business confidence; Japan average cash earnings, household spending, current account; German industrial production; France trade balance; US trade balance; Canada trade balance.
- Wednesday: RBNZ rate decision; Germany trade balance; FOMC minutes.
- Thursday: Japan PPI; ECB meeting accounts; US CPI, jobless claims.
- Friday: New Zealand BNZ manufacturing; Germany CPI final; UK GDP, production; Swiss SECO consumer climate; Canada employment, BoC business outlook survey; US PPI, U of Michigan consumer sentiment.
USD/JPY Daily Outlook
Daily Pivots: (S1) 146.78; (P) 147.89; (R1) 149.86; More...
Intraday bias in USD/JPY remains on the upside for the moment. Rise from 139.57 is seen as the second leg of the corrective pattern from 161.94. Break of 149.35 resistance will target 61.8% retracement of 161.94 to 139.57 at 153.39 next. On the downside, below 145.91 minor support will turn intraday bias neutral again.
In the bigger picture, price actions from 161.94 are seen as a corrective pattern to rise from 102.58 (2021 low). The range of medium term consolidation should now be set between 38.2% retracement of 102.58 to 161.94 at 139.26 and 161.94. Nevertheless, sustained break of 139.26 would open up deeper medium term decline to 61.8% retracement at 125.25.
NZIER shadow board evenly split on size of RBNZ rate cut this week
The NZIER Shadow Board is evenly divided on whether RBNZ should lower the OCR by 25 or 50 basis points in its upcoming meeting this week.
Those advocating for a 50bps cut highlighted ongoing economic weakness and rising excess capacity, as well as easing headline inflation and inflation expectations, which they believe justify a larger reduction in rates.
Other members preferred a more cautious 25bps cut, citing persistent risks from non-tradable inflation and recommending a more measured approach.
Looking ahead, the Shawdow Board agrees that RBNZ should continue with its easing cycle over the next year, with most members expecting OCR to settle between 3.5% and 4.5%.Some members urged a gradual, data-driven approach, while others argued for more rapid cuts, pointing to weak economic conditions that may require further stimulus.

ECB’s Villeroy warns of undershooting inflation target
In an interview with La Repubblica, ECB Governing Council member François Villeroy de Galhau noted a shift in the "balance of risks" for Eurozone economy. He said that for the past two years, the primary concern was overshooting the ECB’s 2% inflation target. However, Villeroy emphasized that the focus is now also on the risk of "undershooting" the target due to "weak growth" and maintaining "restrictive monetary policy for too long."
Villeroy emphasized the importance of maintaining "full optionality" for this month's monetary policy meeting, stressing that a pragmatic approach—evaluating the situation "meeting by meeting"—is essential. This adds to the growing chorus within the ECB suggesting that October meeting could bring about further easing if conditions warrant it.
Looking ahead, Villeroy suggested that if inflation sustainably returns to 2% next year, and growth in Europe remains sluggish, "there won’t be any reason for our monetary policy to remain restrictive".
EUR/USD Turns Red, Upsides Could Face Hurdles
Key Highlights
- EUR/USD started a fresh decline below the 1.1080 support.
- It traded below a key bullish trend line with support at 1.1145 on the 4-hour chart.
- GBP/USD declined below the 1.3150 support level.
- USD/JPY rallied above the 146.50 and 147.20 resistance levels.
EUR/USD Technical Analysis
The Euro failed to continue higher above 1.1200 and started a fresh decline against the US Dollar. EUR/USD traded below 1.1100 to enter a bearish zone.
Looking at the 4-hour chart, the pair gained bearish momentum below the 1.1150 support, the 100 simple moving average (red, 4-hour), and the 200 simple moving average (green, 4-hour). The pair traded below a key bullish trend line with support at 1.1145 on the same chart.
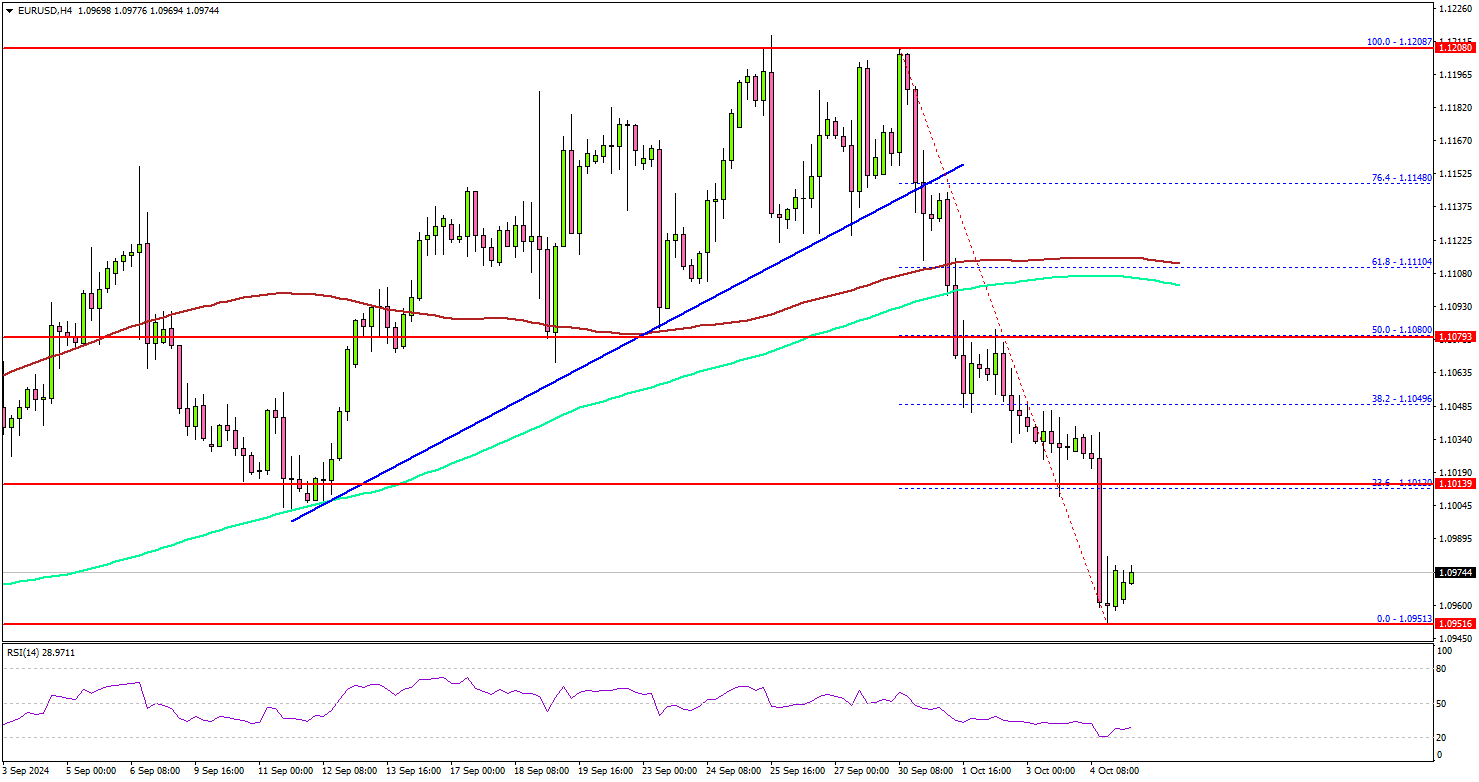
The bears even pushed the pair below 1.1020. It seems like the pair might struggle to recover. On the upside, the bears might be active near the 1.1000 level.
The first major resistance might be near the 1.1080 level. It is close to the 50% Fib retracement level of the downward move from the 1.1208 swing high to the 1.0950 zone. A close above the 1.1080 level could set the tone for another increase.
The next major resistance could be 1.1145. A clear move above the 1.1145 level might send EUR/USD toward 1.1200. Any more gains might call for a test of the 1.1250 zone.
On the downside, immediate support sits near the 1.0950 level. The next key support sits near the 1.0920. Any more losses could send the pair toward the 1.0840 support.
Looking at GBP/USD, the pair also saw bearish moves, and the bears were able to push the pair below the 1.3150 support.
Upcoming Economic Events:
- Euro Zone Retail Sales for August 2024 (MoM) - Forecast +0.2%, versus +0.1% previous.