Sample Category Title
Brent Crude Oil Prices Rise Amid Geopolitical Tensions
Brent crude oil prices climbed to 74.55 USD per barrel by Wednesday, marking a significant increase driven by escalating geopolitical tensions in the Middle East. The previous session saw prices surge by over 2% as fears grew over potential crude oil shortages due to the intensifying conflict in the region, particularly with Iran's heightened involvement.
Iran, a key member of OPEC, holds substantial influence over global oil supplies. Its assertive stance in the Middle East conflict raises concerns about disruptions in energy exports, which could tighten the global oil market and push prices higher.
Mixed market sentiments
Despite the upward pressure from geopolitical factors, the overall sentiment in the oil market remains mixed. One of the dampening factors is the weak demand from China, the world's largest oil importer. China's sluggish economic indicators have limited the potential for a sustained recovery in oil prices, as reduced industrial activity translates to lower energy consumption.
Adding to the complex market dynamics, the American Petroleum Institute (API) reported that US crude oil inventories decreased by 1.5 million barrels during the week. This decline was less than the anticipated drop of 2.1 million barrels, marking the second consecutive weekly decrease but suggesting that demand may not be as robust as expected.
Furthermore, the appreciating US dollar has not yet significantly impacted crude oil prices but could do so in the future. Typically, a stronger dollar makes oil more expensive for holders of other currencies, potentially reducing global demand and applying downward pressure on prices.
Technical analysis of Brent crude oil
On the H4 chart, Brent crude found support at 69.90 USD, forming an upward wave targeting the 75.50 USD level. After reaching this point, a correction back to 72.66 USD is possible. Subsequently, there is potential for a new bullish wave extending to 78.20 USD, which serves as a local target. The MACD indicator technically supports this scenario; its signal line is below zero but trending sharply upwards, indicating increasing bullish momentum.
On the H1 chart, Brent broke above the 72.66 USD level and reached a local target at 75.30 USD. A consolidation range is expected to form below this level. A corrective move back to 72.66 USD (retesting from above) is possible, potentially leading to a downward exit from the consolidation. Once this correction is completed, the price may resume upward towards 75.50 USD, the initial target. The Stochastic oscillator technically confirms this outlook, with its signal line below the 80 level and preparing to decline, suggesting a short-term correction before further gains.
Conclusion
The interplay of escalating geopolitical tensions and mixed economic signals continues to influence Brent crude oil prices. While concerns over supply disruptions due to Middle Eastern conflicts push prices upward, weak demand from China and inventory data from the US temper this rise. Additionally, the strengthening of the US dollar could impact global oil demand in the near future. Traders and investors should closely monitor these factors, as they will likely contribute to continued volatility in the oil market.
US ADP employment rises 143K, wage growth slows
US ADP report for September showed private employment increased by 143k, surpassing expectations of 120k. The goods-producing sector added 42k jobs, while the service-providing sectors contributed 101k new jobs.
By establishment size, small companies saw a loss of -8k jobs, while medium-sized businesses added 64k and large companies increased their workforce by 86k.
Wage growth continued to slow, with year-over-year pay gains for job-stayers easing to 4.7%. The decline was more pronounced for job-changers, whose wage growth fell from 7.3% to 6.6%.
Nela Richardson, ADP’s chief economist, noted that "stronger hiring didn't require stronger pay growth last month." She also pointed out that the premium job-changers usually enjoy over job-stayers narrowed to 1.9%, matching the low last seen in January.
ECB’s de Guindos cites weaker growth outlook, expects recovery to strengthen over time
In a speech today, ECB Vice President Luis de Guindos acknowledged that Eurozone growth was weaker than expected in Q2, leading to a downward revision in the growth outlook for the region. He added that risks to growth remain "tilted to the downside".
Despite this, de Guindos expressed optimism for the future, expecting the recovery to "strengthen over time". He cited rising real incomes and the waning impact of restrictive monetary policy as key factors that should bolster consumption and investment. Additionally, he pointed to boost in exports as global demand improves, contributing to the recovery.
BoJ’s Ueda vows extremely high vigilance amid domestic and global economic uncertainties
BoJ Governor Kazuo Ueda reaffirmed today that Japan's economy is expected to sustain a moderate recovery, which should support underlying inflation in converging toward 2% target over the coming years. However, Ueda did not repeat the usual pledge to continue raising interest rates if inflation moves in line with forecasts, signaling a shift in tone towards a more cautious approach.
Ueda highlighted the ongoing uncertainties surrounding Japan's economy and inflation, stating that "uncertainty regarding Japan's economy and prices remain high." He also pointed to external risks, noting that the outlook for overseas economies, including the US, remains unclear, while financial markets continue to show signs of instability.
Given these risks, Ueda emphasized the need for "extremely high vigilance" in assessing economic developments. For now, BoJ will maintain a cautious stance, closely scrutinizing both domestic and global factors before tightening monetary policy again.
Eurozone unemployment rate unchanged at 6.4%, EU down to 5.9%
Eurozone’s unemployment rate was unchanged at 6.4% in August, aligning with market expectations. Meanwhile, EU unemployment rate fell slightly from 6.0% to 5.9%.
The report estimates that 13.027m people in EU, including 10.925m in Eurozone, were unemployed in August. Compared with the previous month, unemployment decreased by -108k across EU and by -94k within Eurozone.
On an annual basis, the improvement was even more notable. Compared to August 2023, the number of unemployed people dropped by -142k in EU and by -233k in Eurozone.
USDJPY Outlook Remains Gloomy
- USDJPY holds below key resistance levels as October’s session starts
- Technical signals cannot warrant a bullish trend reversal
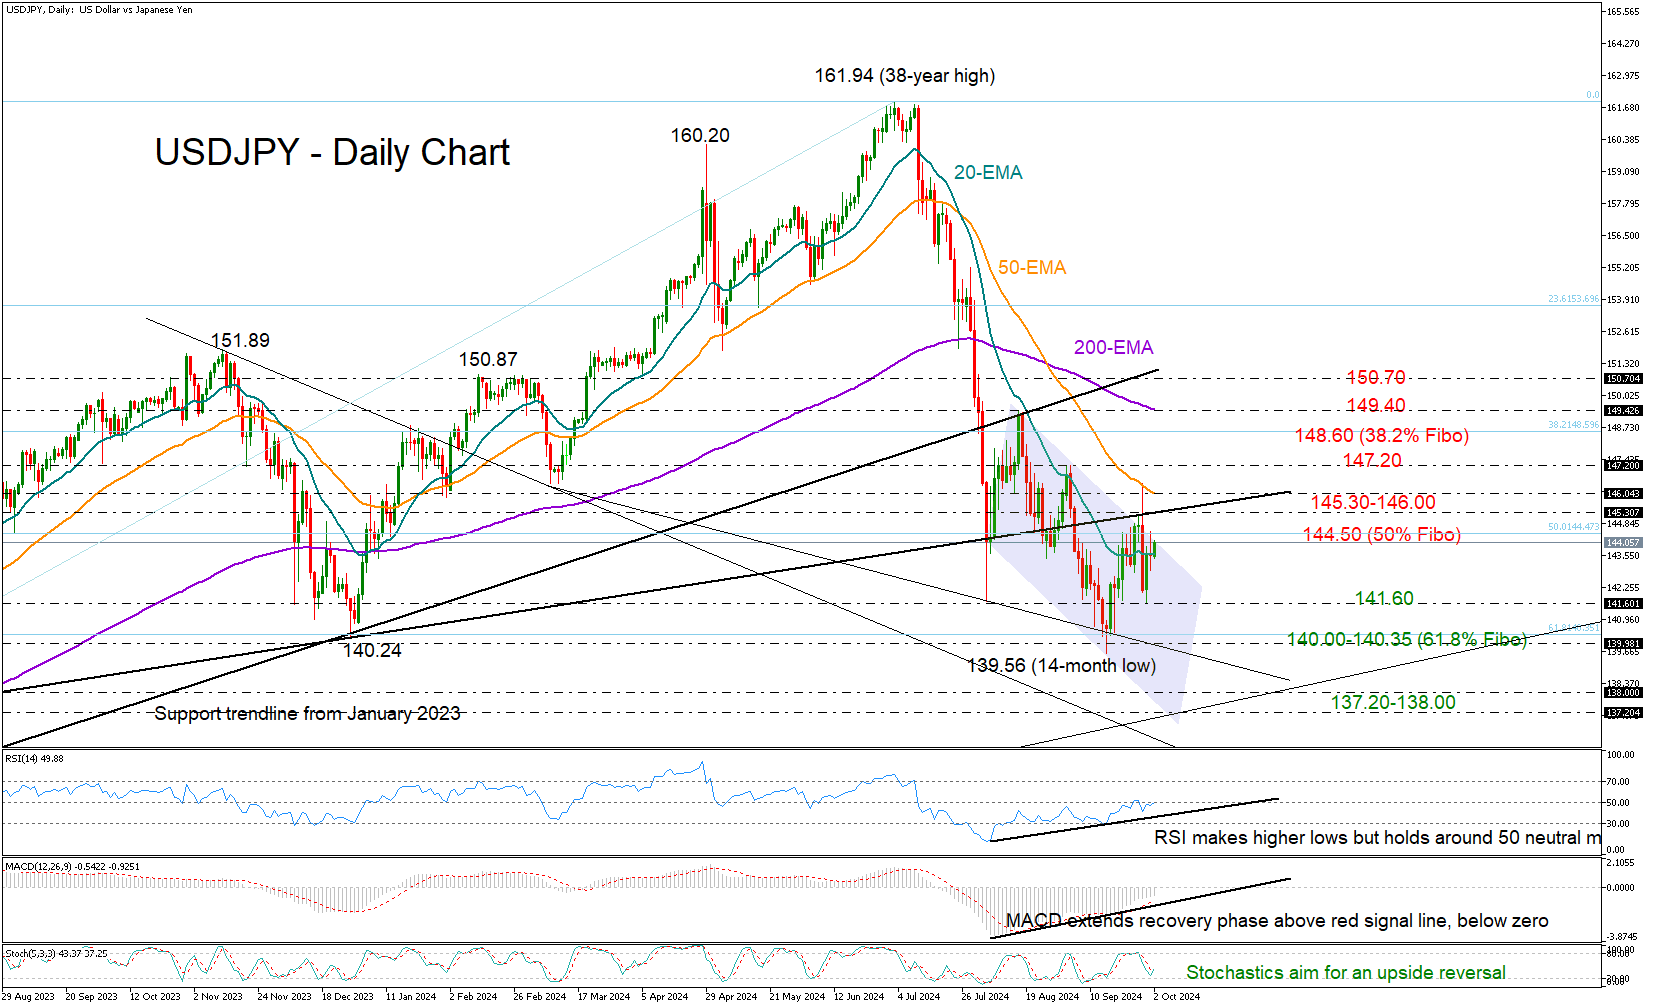
USDJPY had a lackluster beginning to October, with a neutral close around its 20-day EMA and previously a rejection near the 50% Fibonacci retracement of the 2023-2024 upleg at 144.50.
Currently, the pair is attempting to reach the 144.50 territory again, but there may be more hurdles to overcome. Another challenge could emerge somewhere between the broken support trendline at 145.30 and the 50-day EMA at 146.00, while higher, the bulls may face a wall near September’s high of 147.20. If the latter proves easy to overcome, the spotlight might next shift to the 38.2% Fibonacci mark of 148.60 and then towards the 200-day EMA at 149.40.
Should the bears take control once more and push the price below its 20-day EMA at 143.60, there is a possibility of a new downward movement towards the 141.60 floor. Breaking lower, the pair could initially seek shelter around the critical 61.8% Fibonacci area of 140.35 and the 140.00 psychological mark. A failure to bounce back may result in a significant sell-off towards the 137.20-138.00 area, which was last seen in July 2023.
While trend signals are stagnant, there is encouraging movement in technical indicators like the RSI and MACD, indicating bullish divergence. Yet, an imminent upside reversal in the price cannot be warranted as long as the RSI is still around its 50 neutral mark and the latter is hovering below zero.
Overall, the short-term outlook for USDJPY is not favorable. For the pair to resume its previous upward trajectory, it must successfully climb sustainably above 150.70. On the downside, a close below 140.00 could further worsen the bearish trend.
Changing of Guard at Swiss National Bank
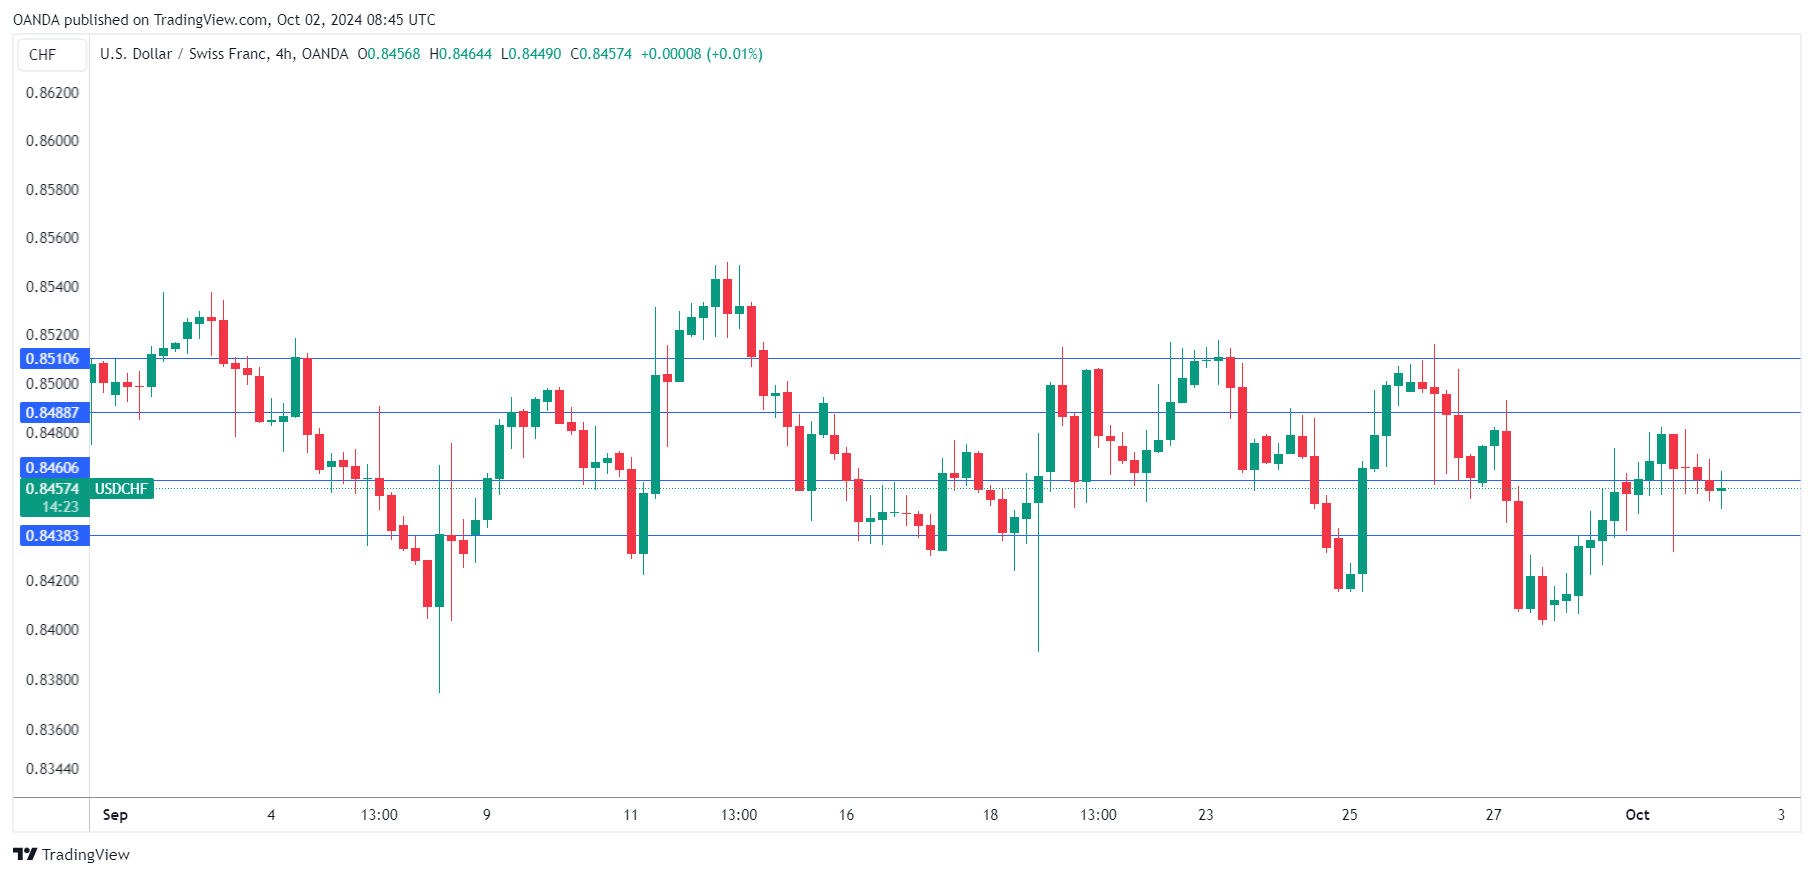
The Swiss franc is calm on Wednesday. In the European session, USD/CHF is trading at 0.8454, up 0.13% on the day.
SNB welcomes Schlegel – will he bring more of the same?
Martin Schlegel has taken over as the new president of the Swiss National Bank, replacing long-term head Thomas Jordan. Schlegel gave his first speech as president on Tuesday and investors are keen to know whether he will continue Jordan’s policies.
Under Jordan, the SNB was one of the first major central banks to raise interest rates in response to rising inflation. In the case of the SNB, that meant ensuring that inflation did not stray far from the upper level of the 0%-2% target. The SNB got the job done and the SNB has been aggressive in cutting rates as inflation has been falling. The SNB has lowered rates at three consecutive meetings since March, bringing the cash rate to 1%.
Schlegel didn’t make any waves with his first speech, which was no surprise. He said that the central bank’s “main instrument” was the policy rate and hinted at further rate cuts, saying that the downward risks to inflation were higher than the upside risks and that negative rates “can’t be excluded”.
Schlegel was vague about the SNB intervening in the currency markets, saying such a move couldn’t be excluded. The Swiss franc has soared a massive 8% since May 1 and the spike in tensions in the Middle East could push the safe-haven asset even higher. The SNB has intervened in the past when the franc has sharply appreciated in order to keep Swiss exports competitive and there is speculation that the SNB might step in if the Swissy’s appreciation continues.
On the data calendar, Switzerland will release the September inflation report on Thursday. The market estimate stands at 0%, compared to -0.1% in August. Yearly, inflation is expected to remain unchanged at 1.1%.
USD/CHF Technical
- USD/CHF is testing support at 0.8460. Below, there is support at 0.8438
- 0.8488 and 0.8510 are the next resistance lines
XBR/USD Analysis: Brent Oil Price Soars After Attack on Israel
Following Israel's military operation in Lebanon, Iran launched a missile strike on Israel on October 1. Financial markets reacted sharply as soon as the first reports of the attack emerged:
→ U.S. stock indices dropped significantly, and Bitcoin also fell, with BTC/USD nearing the psychological $60,000 mark at yesterday's low.
→ Gold surged to $2670, though supply forces have since curbed the panic buying, and XAU/USD has dropped back below $2650.
Oil prices also spiked. Unlike other financial assets, there has been no correction on the XBR/USD chart today, despite the end of the missile strike on Israel. This highlights oil's heightened sensitivity to Middle Eastern tensions.
According to today’s technical analysis of XBR/USD:
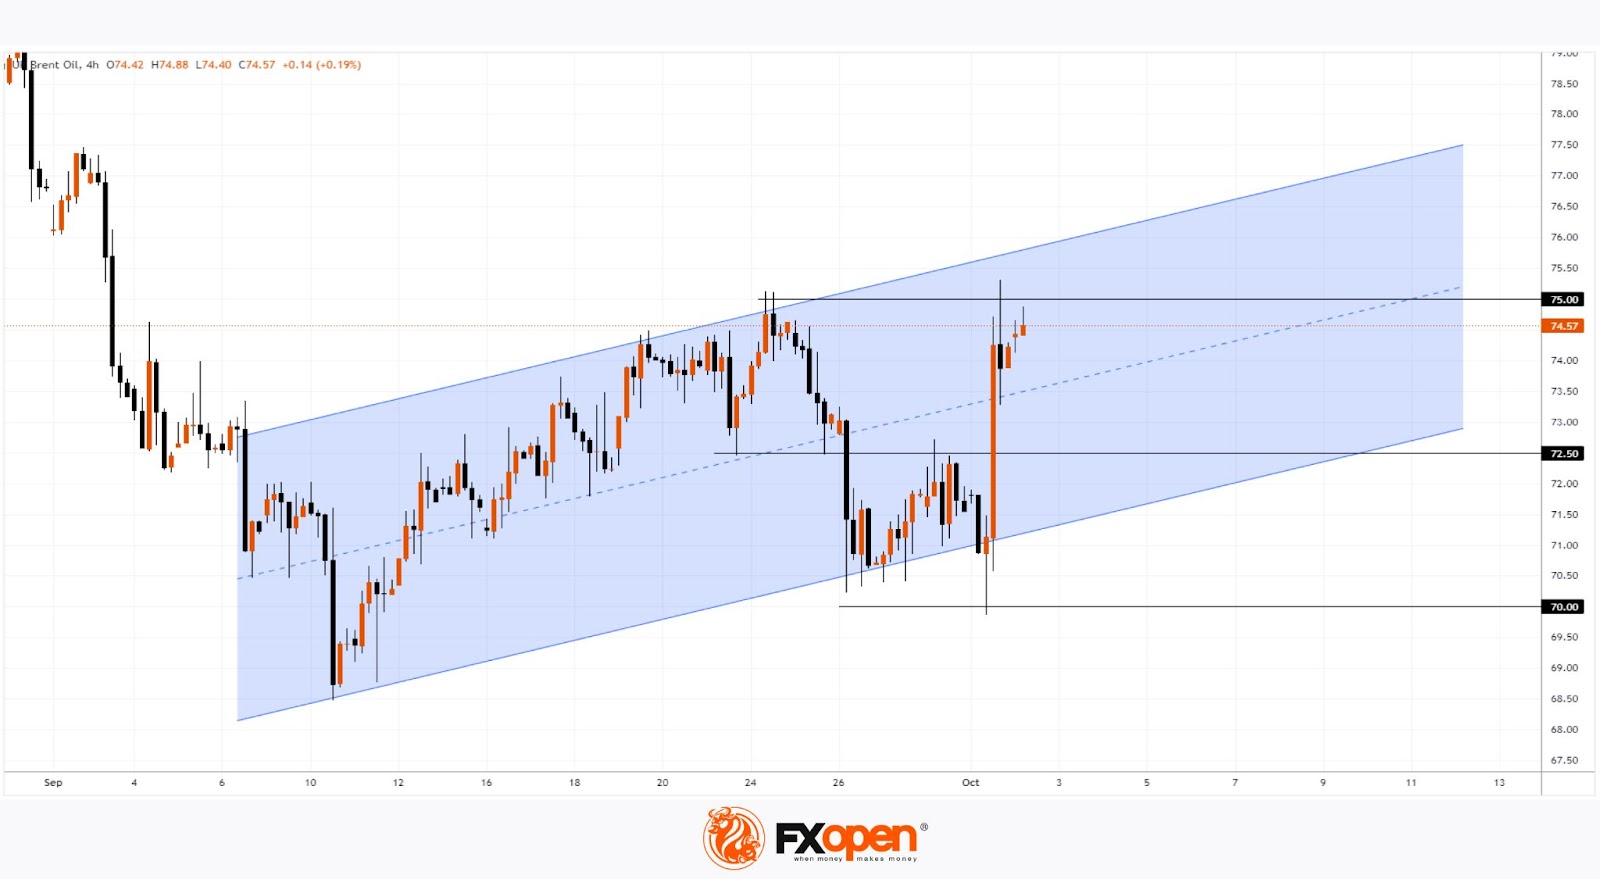
→ Brent oil price movements have formed an upward channel (shown in blue), beginning in early September. Following the news of the missile attack, the price has climbed into the upper half of the channel.
→ Interestingly, just before this surge, the price had hit a multi-week low with a false bearish breakout below the psychological $70 per barrel level.
Given Israel’s vow to retaliate for Iran's strike, it’s reasonable to assume that oil demand may remain high, potentially pushing XBR/USD towards the upper boundary of the channel, surpassing the current resistance at $75.
Brent oil could find support at the median line of the blue channel and the $72.50 level.
Start trading commodity CFDs with tight spreads. Open your trading account now or learn more about trading commodity CFDs with FXOpen.
This article represents the opinion of the Companies operating under the FXOpen brand only. It is not to be construed as an offer, solicitation, or recommendation with respect to products and services provided by the Companies operating under the FXOpen brand, nor is it to be considered financial advice.
Market Analysis: EUR/USD Trims Gains, USD/JPY Eyes Fresh Increase
EUR/USD declined from the 1.1200 resistance and corrected gains. USD/JPY is rising and might gain pace above the 144.65 resistance.
Important Takeaways for EUR/USD and USD/JPY Analysis Today
- The Euro started a fresh decline below the 1.1150 support zone.
- There is a connecting bearish trend line forming with resistance at 1.1070 on the hourly chart of EUR/USD at FXOpen.
- USD/JPY climbed higher above the 142.50 and 143.40 levels.
- There is a connecting bullish trend line forming with support at 143.45 on the hourly chart at FXOpen.
EUR/USD Technical Analysis
On the hourly chart of EUR/USD at FXOpen, the pair struggled to clear the 1.1200 resistance zone. The Euro started a fresh decline and traded below the 1.1150 support zone against the US Dollar.
The pair declined below 1.1125 and tested the 1.1100 zone. A low was formed near 1.1045 and the pair is now consolidating losses. There was a minor recovery wave above the 1.1060 level. On the upside, the pair is now facing resistance near a connecting bearish trend line at 1.1070.
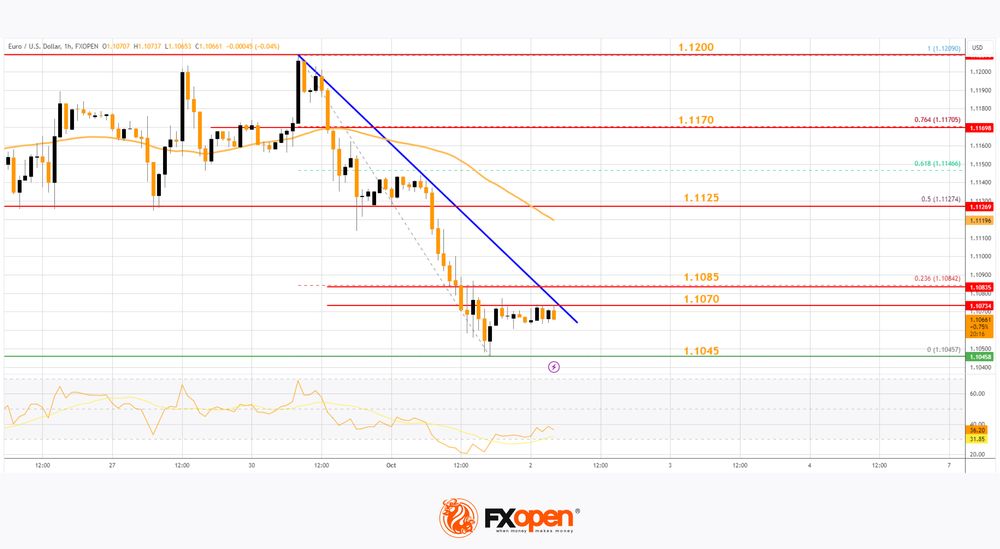
The trend line is close to the 23.6% Fib retracement level of the recent decline from the 1.1209 swing high to the 1.1045 low. The next key resistance is near the 50-hour simple moving average at 1.1125.
The main resistance is near the 76.4% Fib retracement level of the recent decline from the 1.1209 swing high to the 1.1045 low at 1.1170. A clear move above the 1.1170 level could send the pair toward the 1.1200 resistance.
An upside break above 1.1200 could set the pace for another increase. In the stated case, the pair might rise toward 1.1250.
If not, the pair might resume its decline. The first major support on the EUR/USD chart is near 1.1045. The next key support is at 1.1020. If there is a downside break below 1.1020, the pair could drop toward 1.1000. The next support is near 1.0965, below which the pair could start a major decline.
USD/JPY Technical Analysis
On the hourly chart of USD/JPY at FXOpen, the pair started a fresh upward move from the 141.65 zone. The US Dollar gained bullish momentum above 142.80 against the Japanese Yen.
It even cleared the 50-hour simple moving average and 143.00. The bulls pushed the pair above the 143.50 and it tested the 50% Fib retracement level of the downward move from the 146.49 swing high to the 141.65 low.
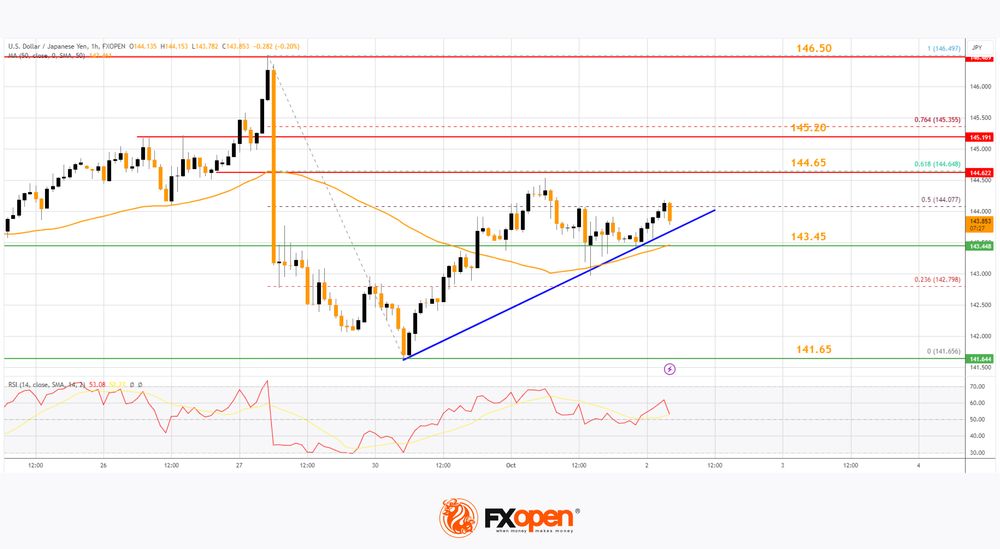
The current price action above the 143.20 level is positive. Immediate resistance on the USD/JPY chart is near 144.65 and the 61.8% Fib retracement level of the downward move from the 146.49 swing high to the 141.65 low.
The first major resistance is near 145.20. If there is a close above the 145.20 level and the RSI moves above 60, the pair could rise toward 146.50. The next major resistance is near 148.00, above which the pair could test 150.00 in the coming days.
On the downside, the first major support is near a connecting bullish trend line with support at 143.45 and the 50-hour simple moving average, below which the bears could gain strength.
The next major support is visible near the 141.65 level. If there is a close below 141.65, the pair could decline steadily. In the stated case, the pair might drop toward the 140.00 support zone. The next stop for the bears may perhaps be near the 138.00 region.
Trade over 50 forex markets 24 hours a day with FXOpen. Take advantage of low commissions, deep liquidity, and spreads from 0.0 pips. Open your FXOpen account now or learn more about trading forex with FXOpen.
This article represents the opinion of the Companies operating under the FXOpen brand only. It is not to be construed as an offer, solicitation, or recommendation with respect to products and services provided by the Companies operating under the FXOpen brand, nor is it to be considered financial advice.
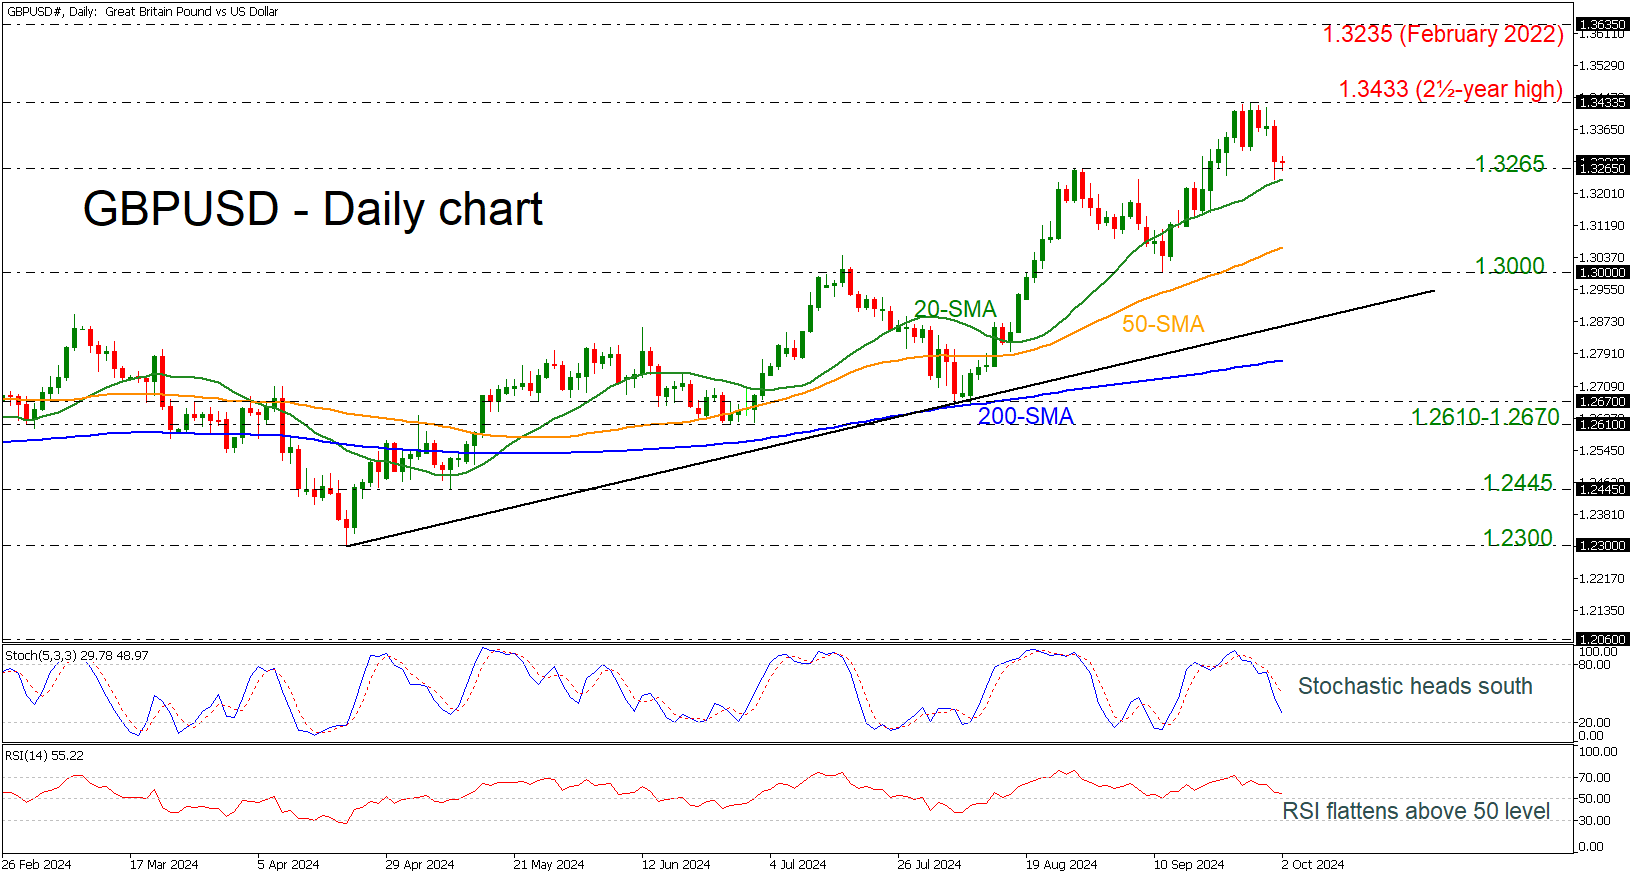
GBPUSD Slips Near Strong Support of 1.3265
- GBPUSD remains above 20-day SMA
- Stochastic and RSI reflect latest downside move.
GBPUSD is notably retreating from the two-and-a-half-year high of 1.3433, meeting the 20-day simple moving average (SMA) at 1.3235. Furthermore, the pair is still hovering above the strong support of 1.3265, but the technical oscillators mirror the latest downside move.
The stochastic oscillator is heading south from the overbought region with strong momentum, while the RSI is moving horizontally above the neutral threshold of 50.
As long as the price remains above 1.3265, it may challenge the 1.3433 resistance level before running towards the February 2022 high of 1.3635.
Otherwise, a significant drop beneath the 20-day SMA may send the market towards the 50-day SMA at 1.3060, ahead of the 1.3000 key level. Steeper losses could pave the way for a test of the medium-term ascending trend line at 1.2910.
All in all, GBPUSD has been in an upward trend since April, and only a decline beneath the 200-day SMA, which stands near 1.2770, may switch the outlook to bearish.