
Sample Category Title
USD/CHF Daily Outlook
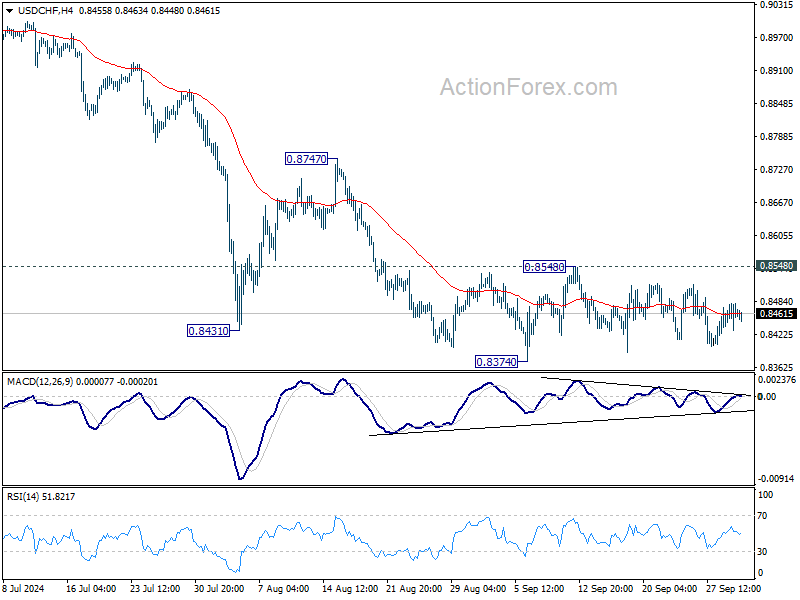
Daily Pivots: (S1) 0.8438; (P) 0.8460; (R1) 0.8488; More…
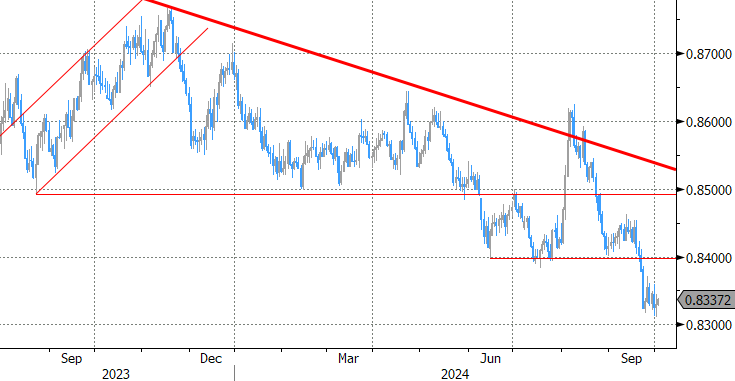
No change in USD/CHF's outlook as range trading continues and intraday bias remains neutral. On the downside, break of 0.8374 will resume the fall from 0.9223 to retest 0.8332 low. Decisive break there will indicate larger down trend resumption. Nevertheless, firm break of 0.8548 will turn bias back to the upside for stronger rebound to 0.8747 resistance instead.
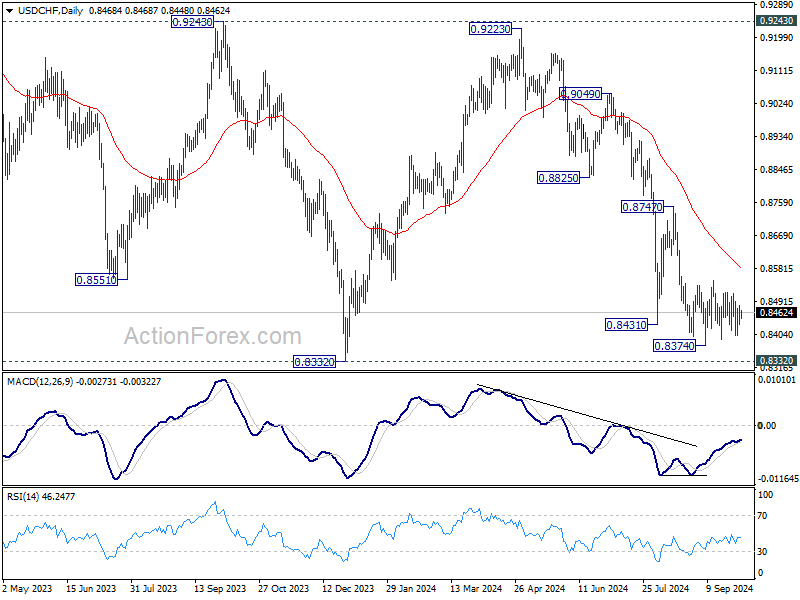
In the bigger picture, price actions from 0.8332 (2023 low) are currently seen as a medium term corrective pattern, with fall from 0.9223 as the second leg. Strong support could be seen from 0.8332 to bring rebound. Yet, overall outlook will continue to stay bearish as long as 0.9243 resistance holds. Firm break of 0.8332, however, will resume larger down trend from 1.0146 (2022 high).
AUD/USD Daily Report
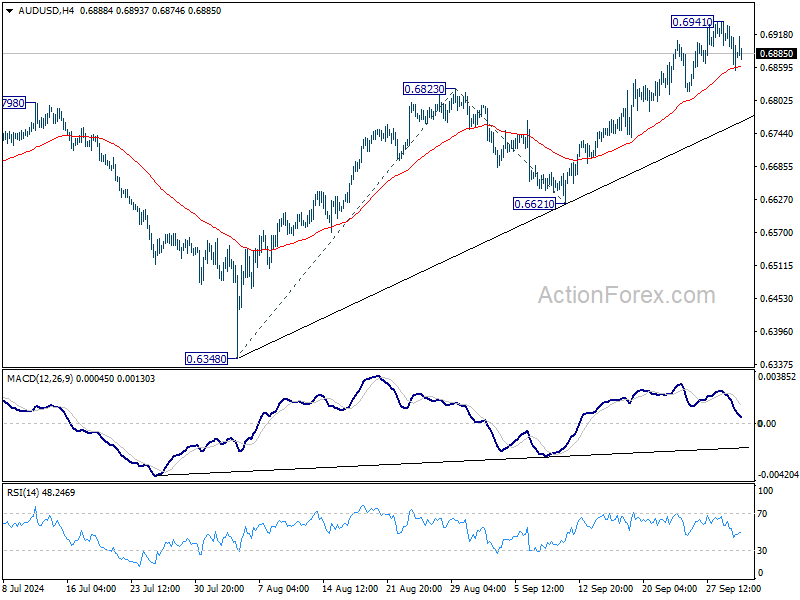
Daily Pivots: (S1) 0.6848; (P) 0.6892; (R1) 0.6926; More...
A temporary top was formed at 0.6941 with current retreat and intraday bias in AUD/USD is turned neutral first. Further rally is expected as long as 0.6823 resistance turned support holds. Above 0.6941 will resume the rally from 0.6348 to 100% projection of 0.6348 to 0.6823 from 0.6621 at 0.7096. However, firm break of 0.6823 will turn bias to the downside for deeper pullback to 0.6621 support.
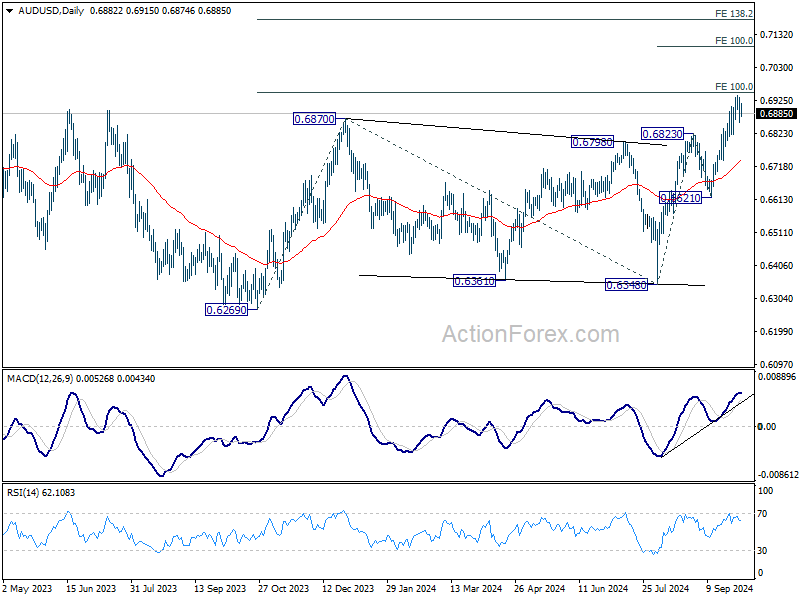
In the bigger picture, overall, price actions from 0.6169 (2022 low) are seen as a medium term corrective pattern, with rise from 0.6269 as the third leg. Firm break of 0.6870 resistance will target 100% projection of 0.6269 to 0.6870 from 0.6340 at 0.6941, and then 138.2% projection at 0.7179. This will now remain the favored case as long as 0.6621 support holds.
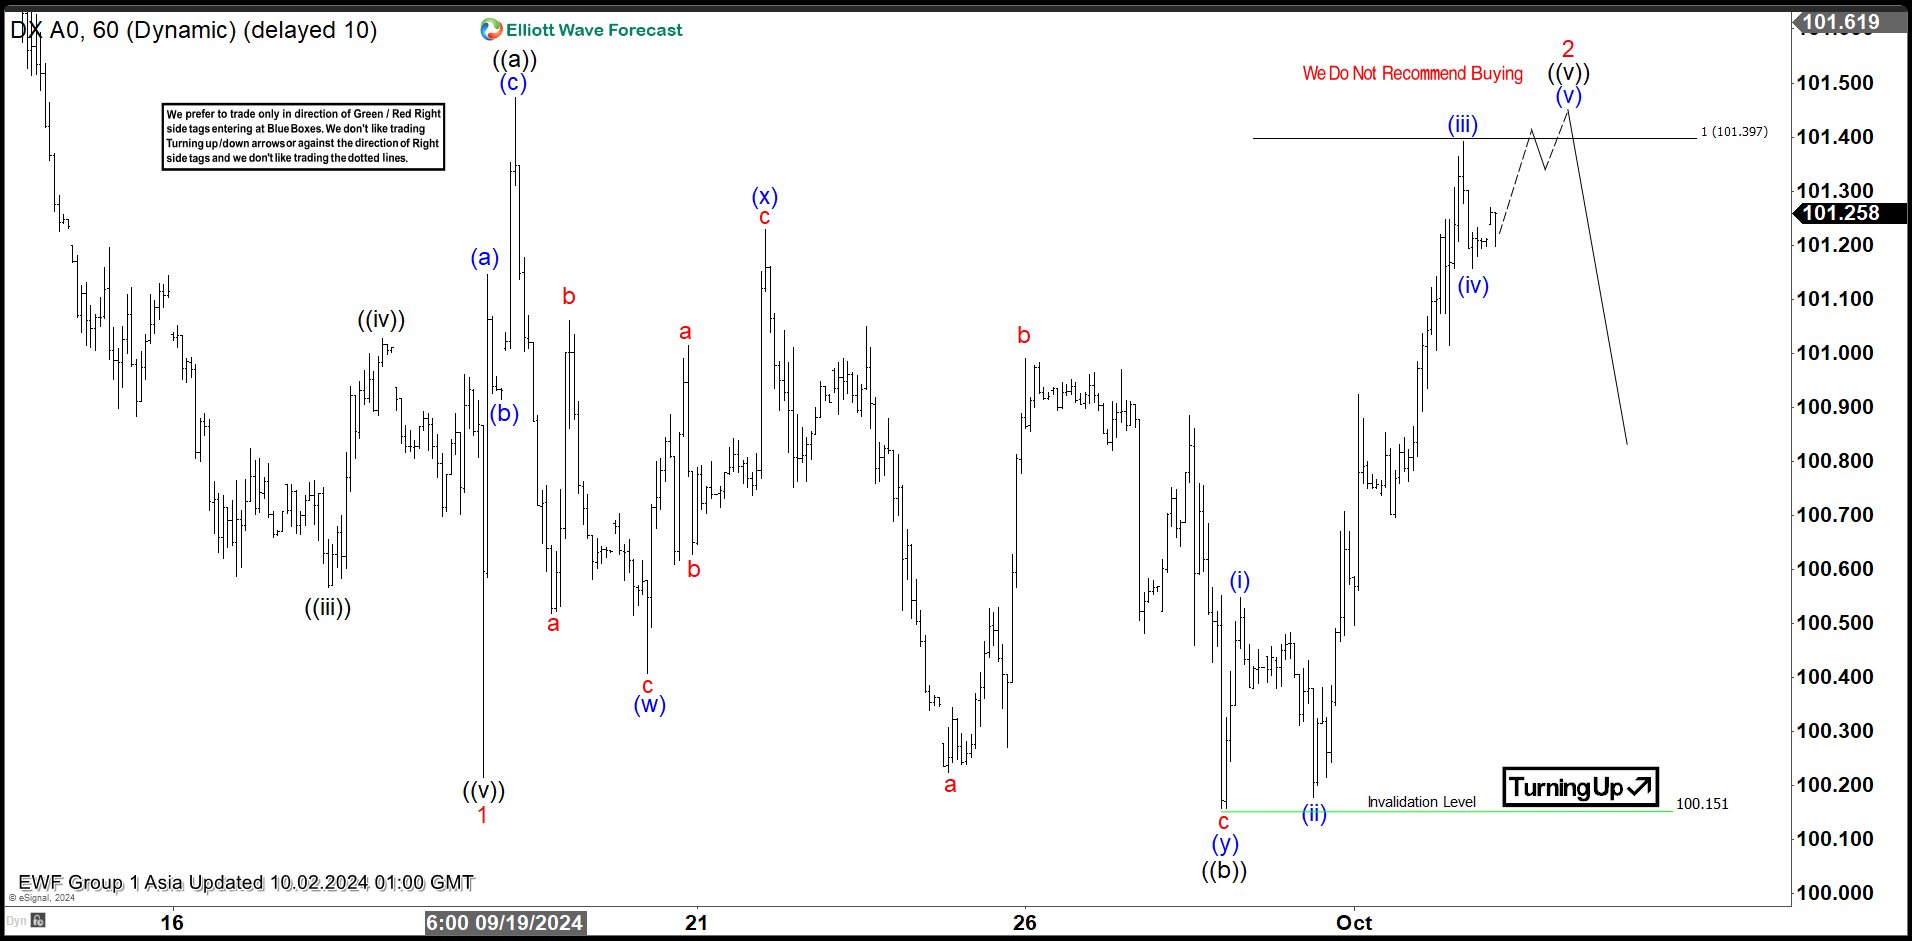
Dollar Index (DXY) Looking for a Flat Elliott Wave Correction
Short Term Elliott Wave View in Dollar Index (DXY) suggests that decline to 100.2 ended wave 1. Rally in wave 2 is in progress as an expanded flat Elliott Wave structure. Up from wave 1, wave (a) ended at 101.14 and pullback in wave (b) ended at 100.91. Wave (c) higher ended at 101.47 which completed wave ((a)) in higher degree. Wave ((b)) dips takes the form of a double three Elliott Wave structure. Down from wave ((a)), wave (w) ended at 100.4 and wave (x) ended at 101.23. Wave (y) lower ended at 100.15 which completed wave ((b)) in higher degree.
The Index has turned higher in wave ((c)). Up from wave ((b)), wave (i) ended at 100.54, and pullback in wave (ii) ended at 100.18. Wave (iii) higher ended at 101.39 and pullback in wave (iv) ended at 101.15. Expect the Index to extend higher 1 more leg in wave (v) to finish wave ((v)) of 2 in higher degree. Afterwards, expect the Index to resume lower. Possible target for wave (v) of ((v)) of 2 is 100% – 161.8% Fibonacci extension of wave ((a)). This comes at 101.4 – 102.1 area.
Dollar Index (DXY) 60 Minutes Elliott Wave Chart
DXY Elliott Wave Video
https://www.youtube.com/watch?v=LzZxXNGIfi4
We Continue to Err on the Side of Another 50 bps Fed Rate Cut
Markets
German Bunds outperformed US Treasuries yesterday. German yields closed 4.8 bps (2-yr) to 9.8 bps (30-yr) lower. The curve move was at least partly inspired by technical reasons (acceleration after losing support from August & September lows at long tenors) and by intraday deteriorating risk sentiment (around the start of US trading) as tensions in the Middle East culminated in an Iranian missile attack against Israel. European (-1%) and US stock markets (-0.5% to -1.5%) switched gains for losses. The resulting increase in oil prices (Brent from $71/b to $75/b) didn’t offer any counterweight at the long end of the curve. Earlier in European trading, ECB easing bets were unaltered by September EMU inflation which showed core CPI (2.7% Y/Y) and services CPI (4% Y/Y) remaining sticky. US yields ended 3.6 bps to 5.1 bps lower with the belly of the curve outperforming the wings. Eco data were mixed with JOLTS job openings unexpectedly increasing from 7.67mn to 8.04mn, but details of the manufacturing ISM (steady at 47.2; mired in contraction territory) painting a bleak picture. Markets especially paid attention to the latter with the pace of job shedding increasing again (43.9 from 46; 2nd worse since mid-2020), new orders still under pressure (46.1 from 44.6) and prices paid falling (48.3 from 54) for the first time this year. The figures brought the odds for the November Fed meeting again more in balance: 60/40 in favour of a 25 bps rate cut over a 50 bps move. Today’s US ADP employment report and a speech by Richmond Fed Barkin will undoubtedly create some more volatility. We fear that this week’s data, nor mid-October CPI numbers or early November US eco data will eventually completely settle the debate. We continue to err on the side of another 50 bps rate cut. Other things to watch out for today are a flurry of ECB speakers and obviously risk sentiment as Israel plans a significant retaliation to the Iran attack within days. Safe haven currencies like JPY and CHF already show some outperformance this morning with the dollar also trying to build on yesterday’s gains. The trade-weighted greenback left this year’s lows just above 100 behind this week, extending the comeback to 101.30. First resistance stands around 102. EUR/USD mirrored the move, ending the test of 1.12 resistance to currently changed hands at 1.1060. First support stands at 1.1002.
News & Views
Martin Schlegel told Bloomberg yesterday that the Swiss National Bank stands ready to intervene in currency markets if needed but added that the policy rate remains the central bank’s main instrument. The fresh SNB president said in the wake of last Thursday’s 25 bps rate cut to 1% that more reductions are likely. Swiss inflation eased to just 1.1% in August and risks are tilted to the downside. For Swiss (export) companies the currency is increasingly weighing on business. But given the limited easing room from the current policy rate levels, there’s only so much the central bank can do before turning to actual FX interventions … unless it brings rates back into sub-zero territory. Schlegel in the interview said it couldn’t be excluded. The SNB pushed the policy rate as deep as -0.75% before kicking of a tightening cycle in response to the post-pandemic inflation upswing. The Swiss franc was not at all impressed by the potential return of negative rates though. EUR/CHF ended the day lower (0.936) as geopolitical developments spurred safe haven flows.
Rating agency Moody’s raised Brazil’s sovereign rating to Ba1 from Ba2 yesterday and maintained a positive outlook. That’s just one notch below investment grade, a status it lost almost a decade ago. The upgrade reflects material credit improvements which Moody’s expect to continue, amongst others due to a more robust growth performance (now seen at 2.5% for 2024 and over the medium term) than previously expected. Moody’s hailed the growing track record of economic reforms, although the credibility of the country’s fiscal framework is still only moderate, as reflected by the relatively high cost of debt. But steady growth and compliance with the fiscal framework should help enhance institutional credibility and reduce borrowing costs markedly and more than Moody’s earlier assumed. This lead the agency to retain Brazil’s positive outlook. Fitch and S&P Global, the two other major rating agencies, upgraded Brazil to BB last year, two notches below investment grade. The Brazilian real erased earlier losses in the wake of Moody’s decision yesterday. USD/BRL closed around 5.44.
Graphs
GE 10y yield
The ECB cut policy rates by 25 bps in June and in September. Stubborn inflation (core, services) makes a follow-up move less evident in October, but very weak PMI’s and soft Lagarde comments hang in the balance. Disappointing US and unconvincing-to-outright-weak EMU activity data dragged the long end of the curve down with the 2023 low at 1.89% as key support.
US 10y yield
The Fed kicked off its easing cycle with a 50 bps move. It is headed towards a neutral stance now that inflation and employment risks are in balance. Conservative SEP unemployment forecasts risk being caught up by reality and with it the dot plot (50 bps more cuts in 2024). We hold our call for two more 50 bps cuts this year. Pressure on the front of the curve and weakening eco data keeps the long end in the defensive for now as well.
EUR/USD
EUR/USD moved above the 1.09 resistance area as the dollar lost interest rate support at stealth pace. US recession risks and bets on fast and large rate cuts trumped traditional safe haven flows into USD. An ailing euro(pean economy) only briefly offset some of the general USD weakness. EUR/USD’s dollar-driven bumped into 1.12 resistance.
EUR/GBP
The BoE delivered a hawkish cut in August. Policy restrictiveness will be further unwound gradually on a pace determined by a broad range of data. The strategy similar to the ECB’s balances out EUR/GBP in a monetary perspective. But the economic picture is increasingly diverging to the benefit of sterling. EUR/GBP succumbed to horrible European September PMI’s. Support at 0.84 broke and brings the 2022 low (0.8203) on the radar.
Risk Off Reins
First, the US east and gulf ports went on a strike on Tuesday, as expected. It will cause supply disruptions and increase the price pressures before November presidential elections. And we know from the beginning that there won’t be a quick end to the negotiations because the Biden administration is not willing to intervene in the dispute.
Then, the geopolitical tensions in the Middle East intensified after Iran has reportedly fired about 200 missiles on Israel as response to Israeli attacks on Hezbollah in Lebanon. Israel said it will retaliate. The involvement of Iran could in fact lead to a wider and a more serious conflict across the region, and threaten oil supply. This is why, the barrel of US crude gained more than 3.50% yesterday but fell short of clearing offers above the $72pb level, the major 38.2% Fibonacci retracement on July – September retreat that should distinguish between the actual bearish trend and a medium-term bullish reversal.
Looking back, it’s been almost a year since the war in Gaza began. The first months of the war pushed oil prices higher, yet the conflict had little sustainable impact beyond April, when traders started giving more weight to the slowing Chinese and world economy than the supply disruptions – considering that the world was fed enough oil from the Middle East and elsewhere to worry about the Middle East disruptions. But if Iran – which produces around 3 mio barrels per day – gets seriously involved in the conflict, we could see the price of a barrel remain under positive pressure for a prolonged period.
This being said, the geopolitical tensions have a limited impact in the medium to long run price trends, and the gains on the back of tensions should be given back with de-escalation and/or as the market gets used to the headlines and divert focus to something else.
It’s in this tense and uncertain geopolitical and macroeconomic setup that OPEC leaders will announce their latest decision this week. They are not expected to make any changes to their previous stance. The cartel will probably start loosening its production restrictions in December and the latest reports suggest that Saudi Arabia will seek a wider market share rather than higher prices moving forward. As such, in the short-run, the level to watch is $72.85pb for WTI and $78pb for Brent crude. Rallies above these levels will be tactical opportunities to benefit from the geopolitical tensions. But limited escalation or de-escalation should keep the prices below the cited levels due to the prospects of higher supply from the beginning of next year. The only thing that could sustainably reverse the trend is.. China. And the improvement there is yet to be seen.
Risk off
Mounting tensions of the Middle East sent a wave of worry across the global markets yesterday. Besides oil, safe haven assets including US treasuries, gold and the US dollar gained as well. Gold remains bid near its ATH levels, while the US 10-year yield tested the 3.70% to the downside. The dollar index jumped and the S&P500 retreated nearly 1% on the back of the risk-off investors. The VIX index spiked past 20. Technology and cryptocurrencies were the most hardly hit. There is no direct reason for that, besides the sharp decline in risk appetite, but Nasdaq 100 dropped nearly 1.50% yesterday, while Bitcoin tested the $60K support.
And economic data couldn’t cheer up the risk takers.
The data released yesterday in the US was mixed. The jolts data showed a surprise jump in job openings in August, but the ISM data suggested that the contraction in the manufacturing didn’t improve, prices shrank into the contraction territory and employment deteriorated faster than expected.
Due today, the ADP report is expected to print 124K new private job additions last month, slightly higher than the 99K printed a month earlier, but still lower than the past 12-month average. Activity on Fed funds futures currently assesses about 36% chance for a 50bp cut in FOMC’s November meeting – because Powell told investors earlier in the week that he sees two 25bp cuts for the remainder of the year rather than another jumbo cut. But any weakness in the US jobs report this week could flip that probability back in favour of a jumbo cut.
In Europe, the September update to the euro area’s CPI data suggested that inflation in Europe sank to 1.8% last month: that’s below the European Central Bank’s (ECB) 2% policy target and a strongly flashing green light for the ECB to deliver another 25bp cut in its October meeting. The EURUSD fell to 1.1045 yesterday and remains under pressure this morning. The pair has now cleared the minor 23.6% support on April to September rally, trend and momentum indicators remain comfortably negative and the RSI doesn’t warn of oversold conditions just yet. Therefore, if we don’t see a big surprise in the US jobs data, the EURUSD should continue to extend losses toward the 1.10, and to 1.0980, the major 38.2% Fibonacci retracement that should distinguish between the actual positive trend and a medium-term bearish reversal.
Tensions Escalating in Middle East
In focus today
In the US, ADP private sector employment growth will provide some early hints of what to expect from Friday's NFP release - consensus expects a modest rebound from August.
In the euro area, we receive the unemployment rate for August. Recently, we have seen the first signs of a cooling in the euro area labour market, but overall, it remains very strong.
In Poland, NBP will announce their rate decision, where we and markets expect the policy rate to stay unchanged at 5.75%.
Economic and market news
What happened overnight
Overnight, the vice-presidential debate between Republican J.D. Vance and Democrat Tim Walz took place. The candidates discussed issues like U.S. foreign policy, inflation, and abortion. The debate remained cordial, with each focusing their attacks on the opposing presidential candidate, as traditionally has been the case in vice-presidential debates. Vance criticized Vice President Kamala Harris on border security, while Walz targeted former President Donald Trump over abortion rights. Overall, the debate was fairly civil compared to last month's presidential faceoff, and did not change prediction markets much, which still show Harris having a slight edge.
What happened yesterday
In the US, Tuesday's data provided mixed signals, but overall supported our notion that the economy remains on a solid footing. The September ISM Manufacturing index was unchanged at 47.2, with weaker sub-indices for prices and employment but stronger new orders. The inventories sub-index also declined, and a combination of stronger order books and falling inventories is often a positive signal for demand. August's JOLTs job openings rebounded after ticking down in July, and past month's data was revised up slightly. Hiring continued to slow, though the number of involuntary layoffs also declined. Thus, the reading suggested that labour markets conditions are not weakening sharply.
In the euro area, as expected September HICP inflation declined to 1.8% y/y, while the core measure was stickier, dropping to 2.7% y/y from 2.8% in August. The headline decline was mainly driven by energy inflation, due to base effects and a monthly price decline in energy prices. Core inflation was driven by very low goods inflation at 0.4% y/y and high services inflation at 4.0% y/y in September. The ECB is still focused on too high services inflation, which printed 3.97% y/y in September, which remains a key upside risk for the inflation outlook. That said, the most recent momentum shows some easing signs, and all in all the September print was supportive for an October rate cut by the ECB.
In Sweden, the Riksbank Minutes for September indicated that the discussion between 25bp vs 50bp was absent for most members and no one seemed to prefer moving in 50bp steps. For a more detailed overview, please see Riksbank - September 2024 Minutes - No member arguing for a 50bp cut, 1 October.
In Middle East, tensions are far from abating. Israel commenced a ground offensive in Lebanon after two weeks of airstrikes against Hezbollah, including killing its former leader, Nasrallah. Iran retaliated by launching a missile attack on Israel, with drones and ballistic missiles. The market reaction to Iran's attack was quite limited, and oil prices even reversed some of the earlier gains (at some point up about 4% during yesterday's session). This in line with our assessment that the threshold for market reaction to a such protracted conflict is very high.
Israel and the US vowed to retaliate against Tehran, with Israeli prime minister Netanyahu warning "Iran made a big mistake tonight - and it will pay for it". In our view, the best-case scenario is something like what happened in April. Then Iran launched missiles that were completely intercepted, and Israel responded with a missile attack on Iran that also caused very limited damage.
Equities: Global equities were lower yesterday despite solid increases in Japan. The US session was beset with several sets of information that could obscure the distinction between noise and genuine drivers. However, it is worth examining the sector rotation, where energy emerged as the best-performing sector following a rise in oil prices due to escalating tensions in the Middle East. Secondly, technology was down significantly, while industrials continued to perform well. Hence, this downturn was not solely due to poor macroeconomic data, but also significantly influenced by sector-specific stories, with high-flying tech companies like Apple and Nvidia being particularly affected. This morning, Chinese stocks have risen sharply in Hong Kong, while Japanese stocks are down by 2%, highlighting the diverse and substantial factors currently affecting financial markets. In the US yesterday, the Dow closed down 0.4%, the S&P 500 fell by 0.9%, the Nasdaq declined by 1.5%, and the Russell 2000 increased by 1.5%. European futures are higher this morning while US once are lower.
FI: European yields declined from the long end yesterday with the 30y point down almost 10bp to 2.33%. The benchmark 10y German bund is now flirting with the 2% level after the 8bp rally to 2.03% yesterday. While the move can somewhat be explained with the European inflation figures released, supporting the case for an October rate cut, the bullish flattening of the curve may be explained if markets expressing concern above the service sector as well (and in turn the services growth sector). Markets are now pricing 23bp for October and another 32bp for December. Yesterday, ECB's Rehn said that the inflation slowing meant that there was more grounds to be covered in October on a potential rate cut. Tomorrow, we look forward to Schnabel speaking at 18:45 CET. We also have a string of central bank speakers today (Lane, de Guindos, Bowman etc).
FX: Iran's missile strike on Israel increased safe-haven demand, boosting the USD and pushing oil and gold prices higher. The move faded somewhat towards the end of the session as reported damages were seemingly limited. The setback to risk hurt the SEK whereas the NOK found support in rising oil prices, although we emphasize that rising oil prices need not be interpreted as a buy signal for the NOK. Yesterday we went short AUD/USD as we see the soft landing scenario being priced to perfection and subject to two-sided US growth risks.
USD/CAD Daily Outlook
Daily Pivots: (S1) 1.3467; (P) 1.3504; (R1) 1.3526; More...
USD/CAD's recovery lost momentum after breaching 55 4H EMA (now at 1.3514). But intraday bias stays neutral first, as more consolidations could be seen above 1.3418. Nevertheless, outlook will remain bearish as long as 1.3646 resistance holds. Firm break of 1.3416 will resume the fall from 1.3946 to 61.8% projection of 1.3946 to 1.3439 from 1.3646 at 1.3333.
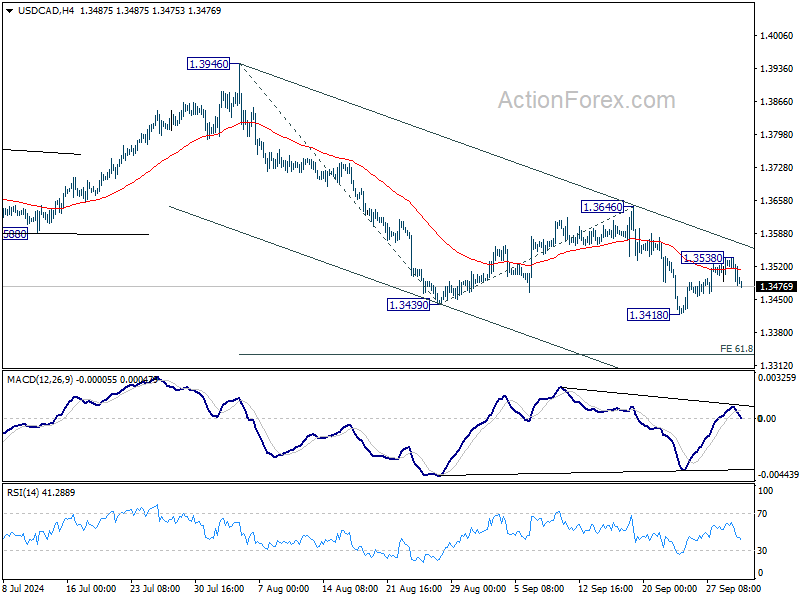
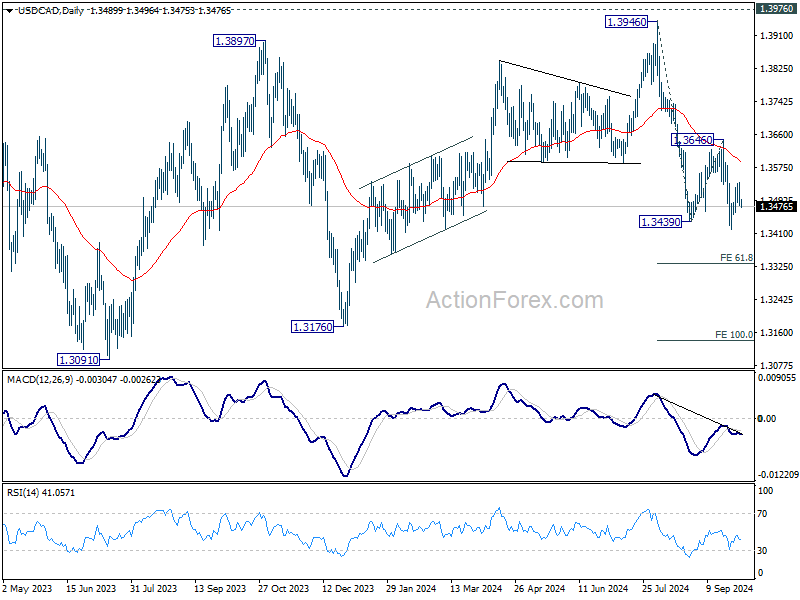
In the bigger picture, corrective pattern from 1.3976 (2022 high) is extending with another falling leg. While deeper decline could be seen, strong support should emerge above 1.2947 resistance turned support to bring rebound. Rise from 1.2005 (2021 low) is still in favor to resume at a later stage.
Diverging Global Markets as US Caution Rises, HK Surges, and Oil Prices Jump
Global markets are showing mixed performance as sentiment diverges across regions. In the US, stocks closed lower with traders displaying increased caution. ISM manufacturing report indicated continuation of the prolonged recession in the sector, though without any sharp deterioration. Attention is now focused on upcoming key economic data, including tomorrow's ISM services report and Friday’s non-farm payrolls, both of which will help shape market sentiment. Meanwhile, the escalating tensions in the Middle East are also being closely monitored for their impact on oil prices, global supply chains, and inflationary pressures.
In contrast, Hong Kong's market continues to rally strongly, trading up over 5% in its morning session. The city’s benchmark index has surged nearly 20% since China unexpectedly introduced a significant stimulus package last week, adding more than USD 770B in market valuation to local stocks. However, this investor optimism hasn't spread evenly across the region. While China remains on holiday, Japan's Nikkei index is trading lower, reflecting a more subdued regional outlook.
In the currency markets, Canadian Dollar has rebounded notably, fueled by the rise in oil prices as Middle East tensions intensify. Loonie is now the strongest performer for the week, overtaking Aussie, which has also been supported by the ongoing strength in Hong Kong's stock market. Dollar is in third place, as traders await further direction from upcoming economic data releases.
On the other side, Yen remains the weakest performer, struggling to find momentum for a rebound. Euro follows as the second weakest currency, with more ECB officials suggesting the possibility of another 25bps rate cut this month. Swiss Franc is the third weakest, following comments from the new SNB chair indicating further rate cuts is on the horizon.
Kiwi is lagging behind other commodity-linked currencies, positioned in the middle of the pack, as economists increasingly call for a 50 bps rate cut by RBNZ next week. Sterling is trading mixed, with little notable news coming out of the UK to influence its movement.
Technically, Hong Kong HSI broke through 100% projection of 14794.16 to 19706.12 from 16964.27 at 21876.24 today with strong upside acceleration. A weekly close above this level would set the stage for further rally to 161.8% projection 24911.83. While trades appears to be reluctant to take profit at this stage, 25k handle would be very tempting, and thus a near term top could be formed there, to the the rally into a consolidation phase.
In Asia, at the time of writing, Nikkei is down -1.65%. Hong Kong HSI is up 5.99%. China is on holiday. Singapore Strait Times is up 0.34%. Japan 10-year JGB yield is down -0.0162 at 0.836. Overnight, DOW fell -0.41%. S&P 500 fell -0.93%. NASDAQ fell -1.53%. 10-year yield fell -0.59 to 3.743.
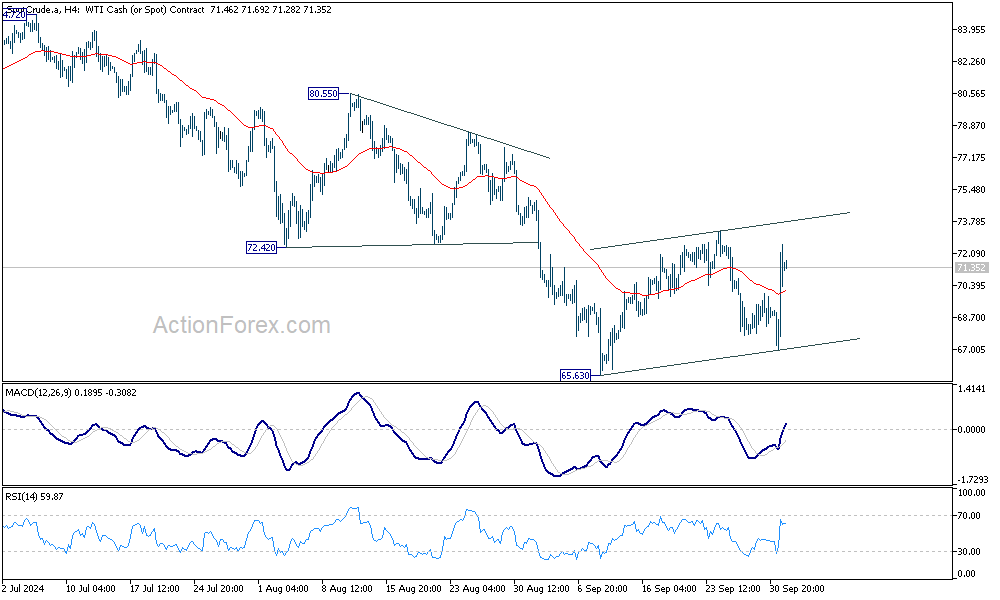
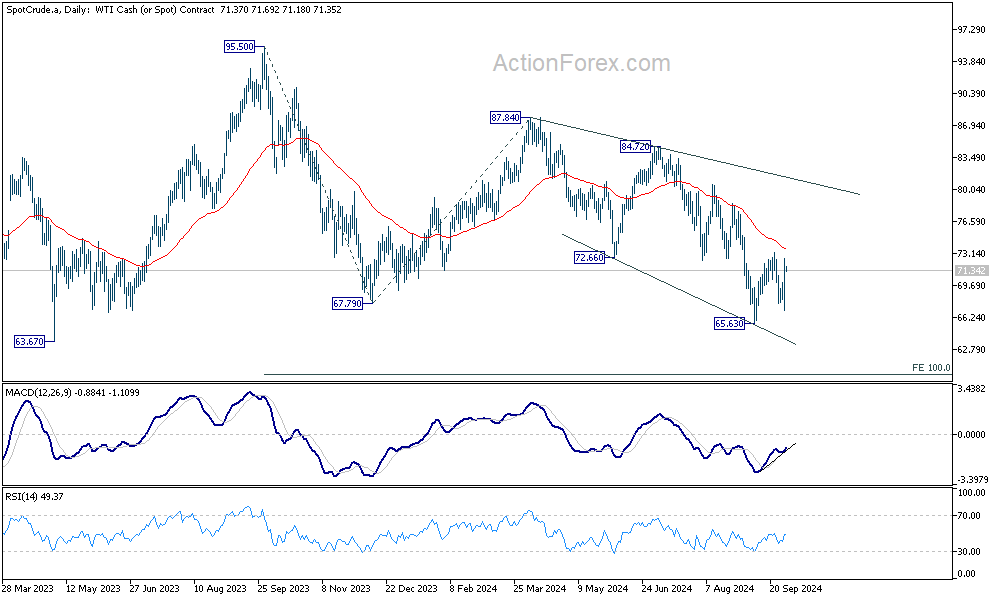
WTI surges on Middle East Conflict, but viewed as corrective move
Oil prices surged overnight, with WTI crude breaking back above 70 as tensions in the Middle East escalated. Iran launched a retaliatory strike on Israel in response to the recent killing of Hezbollah leader Hassan Nasrallah and an Iranian commander in Lebanon. This has fueled concerns that Israeli retaliation could target Iran's oil infrastructure, posing a significant risk to global oil supplies.
As Israel shifts its focus from Gaza to Lebanon and Iran, the conflict is entering a phase with greater implications for energy markets. The prospect of disruptions in one of the world's most critical oil-producing regions has led to heightened market anxiety, with fears of further price increases if the conflict intensifies.
Technically, despite the rebound, WTI is seen as extending the near term consolidations pattern from 65.53 only. While further rise cannot be ruled out, outlook will stay bearish as long as 55 D EMA (now at 73.72) holds. Larger down trend is still expected to extend through 65.53 to 63.67 (2023 low) at a later stage. Tentatively, the medium term target is 100% projection of 95.50 to 67.79 from 87.84 at 60.13.
However, sustained break of 55 D EMA will argue that a medium bottom was already from, and stronger rebound would be seen back towards 80 psychological level.
SNB's Schlegel: Prepared for more rate cuts as inflation downside risks outweigh upside
At an event overnight, new SNB Chair Martin Schlegel indicated that the central bank is prepared to continue easing monetary policy if necessary to maintain medium-term price stability, and the central bank "can't rule out negative rates either."
Schlegel emphasized that SNB sees "downward risks to Swiss inflation as bigger than upward risks," suggesting that deflationary pressures are a significant concern for the Swiss economy.
He also acknowledged the challenges posed by the strong Swiss franc for exporters. However, he pointed out that the primary issue facing Swiss companies is "weak foreign demand," rather than currency strength alone.
Markets are currently pricing in an 85% probability that SNB will lower rates further by 25bps to 0.75% at its December meeting.
ECB's Kazaks: Recent data clearly points towards Oct rate cut
ECB Governing Council member Martins Kazaks indicated that recent data "clearly point in the direction of a cut" in interest rates at the upcoming October meeting. Kazaks highlighted the increasing risks to the Eurozone economy, noting that the balance between stubborn inflation, particularly in services, and weak growth is tilting toward the latter.
He emphasized that even after another 25bps cut, which would bring the deposit rate to 3.25%, the rate would still "restricts economic activity" and curb inflation in the services sector.
Kazaks expressed concern over the “worrying” state of the economy, especially the potential for a sudden weakening of the job market. "If corporates start to shed labor, this snowball may start rolling," he cautioned, warning of the risks of a tipping point that could exacerbate economic decline.
Looking ahead
Eurozone unemployment rate is the only feature in European session. Later in the day, US will release ADP employment.
USD/CAD Daily Outlook
Daily Pivots: (S1) 1.3467; (P) 1.3504; (R1) 1.3526; More...
USD/CAD's recovery lost momentum after breaching 55 4H EMA (now at 1.3514). But intraday bias stays neutral first, as more consolidations could be seen above 1.3418. Nevertheless, outlook will remain bearish as long as 1.3646 resistance holds. Firm break of 1.3416 will resume the fall from 1.3946 to 61.8% projection of 1.3946 to 1.3439 from 1.3646 at 1.3333.
In the bigger picture, corrective pattern from 1.3976 (2022 high) is extending with another falling leg. While deeper decline could be seen, strong support should emerge above 1.2947 resistance turned support to bring rebound. Rise from 1.2005 (2021 low) is still in favor to resume at a later stage.
Economic Indicators Update
| GMT | CCY | EVENTS | ACT | F/C | PP | REV |
|---|---|---|---|---|---|---|
| 23:50 | JPY | Monetary Base Y/Y Sep | -0.10% | 0.80% | 0.60% | |
| 05:00 | JPY | Consumer Confidence Sep | 37.1 | 36.7 | ||
| 09:00 | EUR | Eurozone Unemployment Rate Aug | 6.40% | 6.40% | ||
| 12:15 | USD | ADP Employment Change Sep | 120K | 99K | ||
| 14:30 | USD | Crude Oil Inventories | -1.5M | -4.5M |
AUD/USD Struggles With Gains, Faces A Downturn
Key Highlights
- AUD/USD faced resistance near 0.6940 and started a downside correction.
- A key bullish trend line is forming with support at 0.6880 on the 4-hour chart.
- Gold could rise again and trade toward the $2,700 level.
- Bitcoin trimmed gains and traded below the $64,000 level.
AUD/USD Technical Analysis
The Aussie Dollar climbed higher toward 0.7000 against the US Dollar. AUD/USD failed to continue higher and started a correction phase.
Looking at the 4-hour chart, the pair traded as high as 0.6941 and recently corrected lower. There was a move below the 0.6920 level, but the pair remained well above the 100 simple moving average (red, 4-hour) and the 200 simple moving average (green, 4-hour).
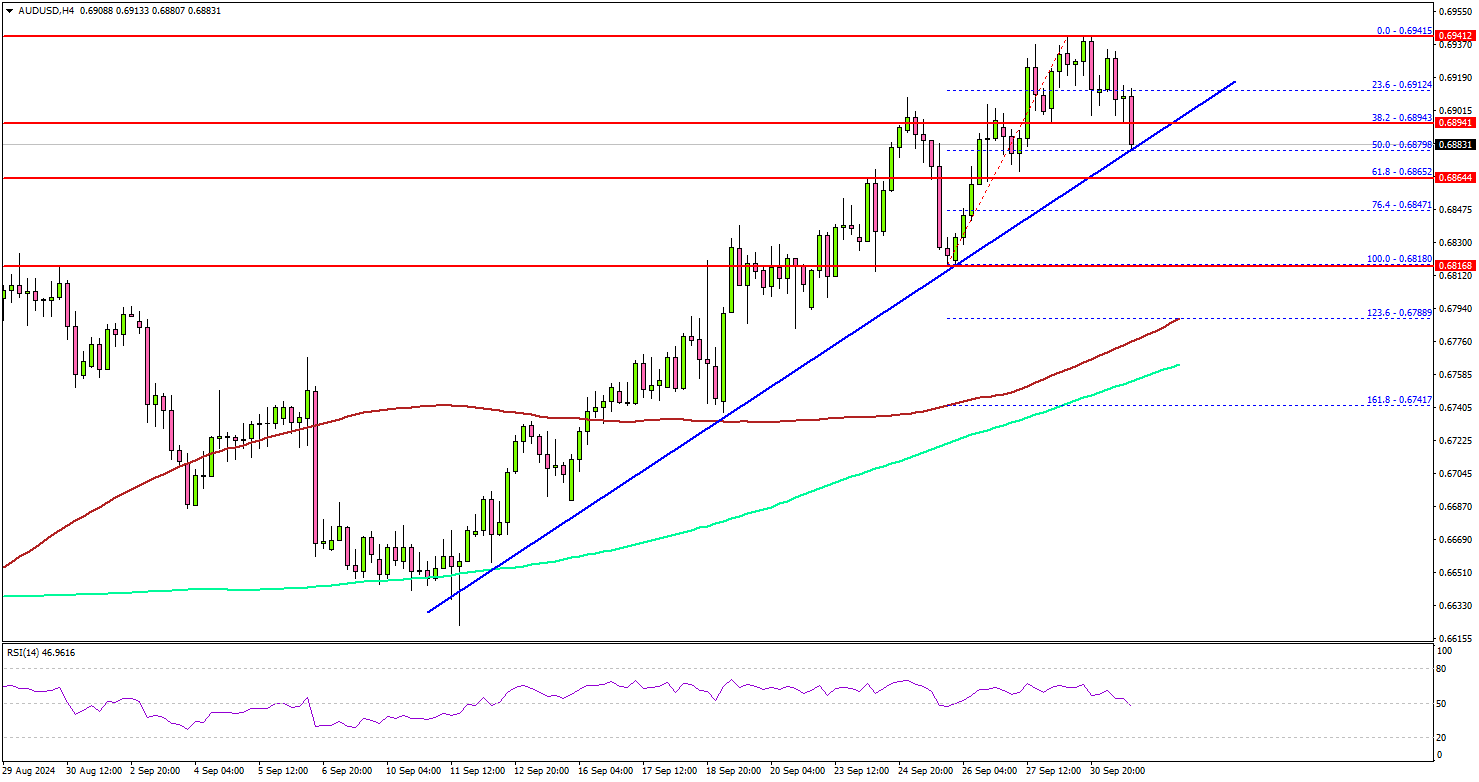
On the downside, immediate support sits near the 0.6880 level. There is also a key bullish trend line forming with support at 0.6880 on the same chart, below which the pair might test 0.6865. The next key support sits near the 0.6800 level and the 100 simple moving average (red, 4-hour).
Any more losses could send the pair toward the 0.6750 support zone. On the upside, the bears are active near the 0.6920 level. A close above the 0.6920 level could set the tone for another increase.
The next major resistance could be 0.6940. A clear move above the 0.6940 level might send AUD/USD toward 0.7000. Any more gains might call for a test of the 0.7045 zone.
Looking at Gold, the bulls are now aiming for another increase and might aim for a move toward the $2,700 level.
Upcoming Economic Events:
- US ADP Employment Change for Sep 2024 - Forecast 120K, versus 99K previous.
WTI surges on Middle East Conflict, but viewed as corrective move
Oil prices surged overnight, with WTI crude breaking back above 70 as tensions in the Middle East escalated. Iran launched a retaliatory strike on Israel in response to the recent killing of Hezbollah leader Hassan Nasrallah and an Iranian commander in Lebanon. This has fueled concerns that Israeli retaliation could target Iran's oil infrastructure, posing a significant risk to global oil supplies.
As Israel shifts its focus from Gaza to Lebanon and Iran, the conflict is entering a phase with greater implications for energy markets. The prospect of disruptions in one of the world's most critical oil-producing regions has led to heightened market anxiety, with fears of further price increases if the conflict intensifies.
Technically, despite the rebound, WTI is seen as extending the near term consolidations pattern from 65.53 only. While further rise cannot be ruled out, outlook will stay bearish as long as 55 D EMA (now at 73.72) holds. Larger down trend is still expected to extend through 65.53 to 63.67 (2023 low) at a later stage. Tentatively, the medium term target is 100% projection of 95.50 to 67.79 from 87.84 at 60.13.
However, sustained break of 55 D EMA will argue that a medium bottom was already from, and stronger rebound would be seen back towards 80 psychological level.