Sample Category Title
EUR/USD Update – Euro Vulnerable on Rate Cut Bets and Safe Haven Flows
- The Euro’s appeal has diminished due to expectations of ECB rate cuts, fueled by softer economic data and dovish policymaker comments.
- The US Dollar is gaining strength amid Middle East tensions, potentially attracting safe-haven flows.
- EUR/USD has formed a double top pattern at 1.1200 and is facing immediate support at 1.1000.
The Euro has lost some of its appeal over the past two weeks as softer data has increased the likelihood of an October rate cut. ECB Policymakers have struck a dovish tone as well with German Economy Minister Robert Habeck stating rate cuts are coming too slowly for his liking.
This should come as no surprise to anyone who has been following developments around the German economy over the last 12 months. Europe’s most industrialized economy which is usually a driver of growth is struggling.
Yesterday’s inflation data from the EU has ramped up rate cut expectations which means Minister Habeck may soon get his wish. This was followed by a UBS warning today that the ECB may have to drop rates to the 1-1.5% range if growth does not improve in the coming quarters. As many analysts have suggested, the ECB may pivot its focus to growth now that inflation appears out of the way.
Markets are now pricing in around six consecutive rate cuts from the ECB starting in October. A 25 bps cut in October is now priced at around 93% which is a stark increase from where we were a month ago.
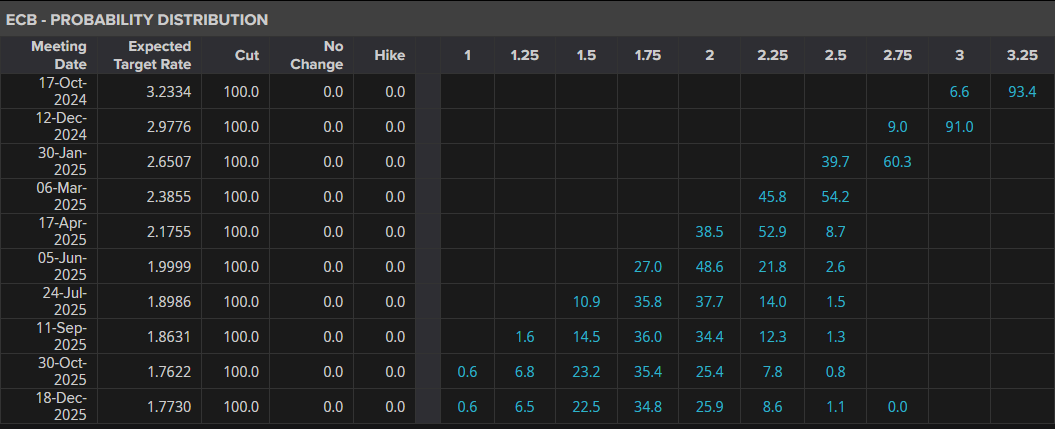
Source: LSEG
This could not come at a worse time for the Euro as the DXY has begun a recovery and may also benefit from some safe haven flows. The increasing tension in the Middle East could reignite some safe haven appeal in the US Dollar and thus weigh further on EUR/USD.
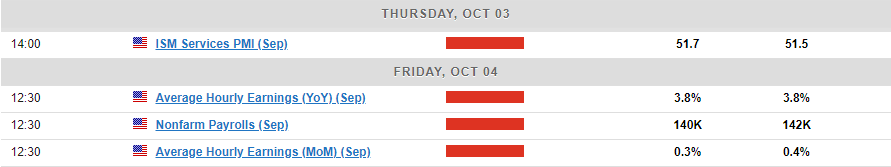
There is of course still some data ahead this week with the NFP report on Friday likely to lead to some volatility as well. Markets have shifted their focus in the US to the Labor market and thus the importance of Friday’s release. If the US unemployment rate remains steady I could see EUR/USD revisiting the 1.1000 handle and possibly lower.
Technical Analysis
EUR/USD has been on a steady move lower since forming a double top pattern at the key 1.1200 handle. The move has been swift and this leaves the door open for a potential retracement before the next leg to the downside.
Immediate support is at the 1.1000 psychological level with a break below opening up a retest of 1.0950. The 100-day MA rests at 1.09260 and would be the next hurdle to pay attention to.
Conversely, a bullish move from here first needs to gain acceptance back above the 1.1100 handle before the recent highs and double at 1.1200 become an area of focus.
The NFP report on Friday could be a catalyst for a significant move in either direction while further escalation in the Middle East could increase the US Dollars’ haven appeal and push EUR/USD below the 1.1000 handle.
EUR/USD Daily Chart, October 2, 2024
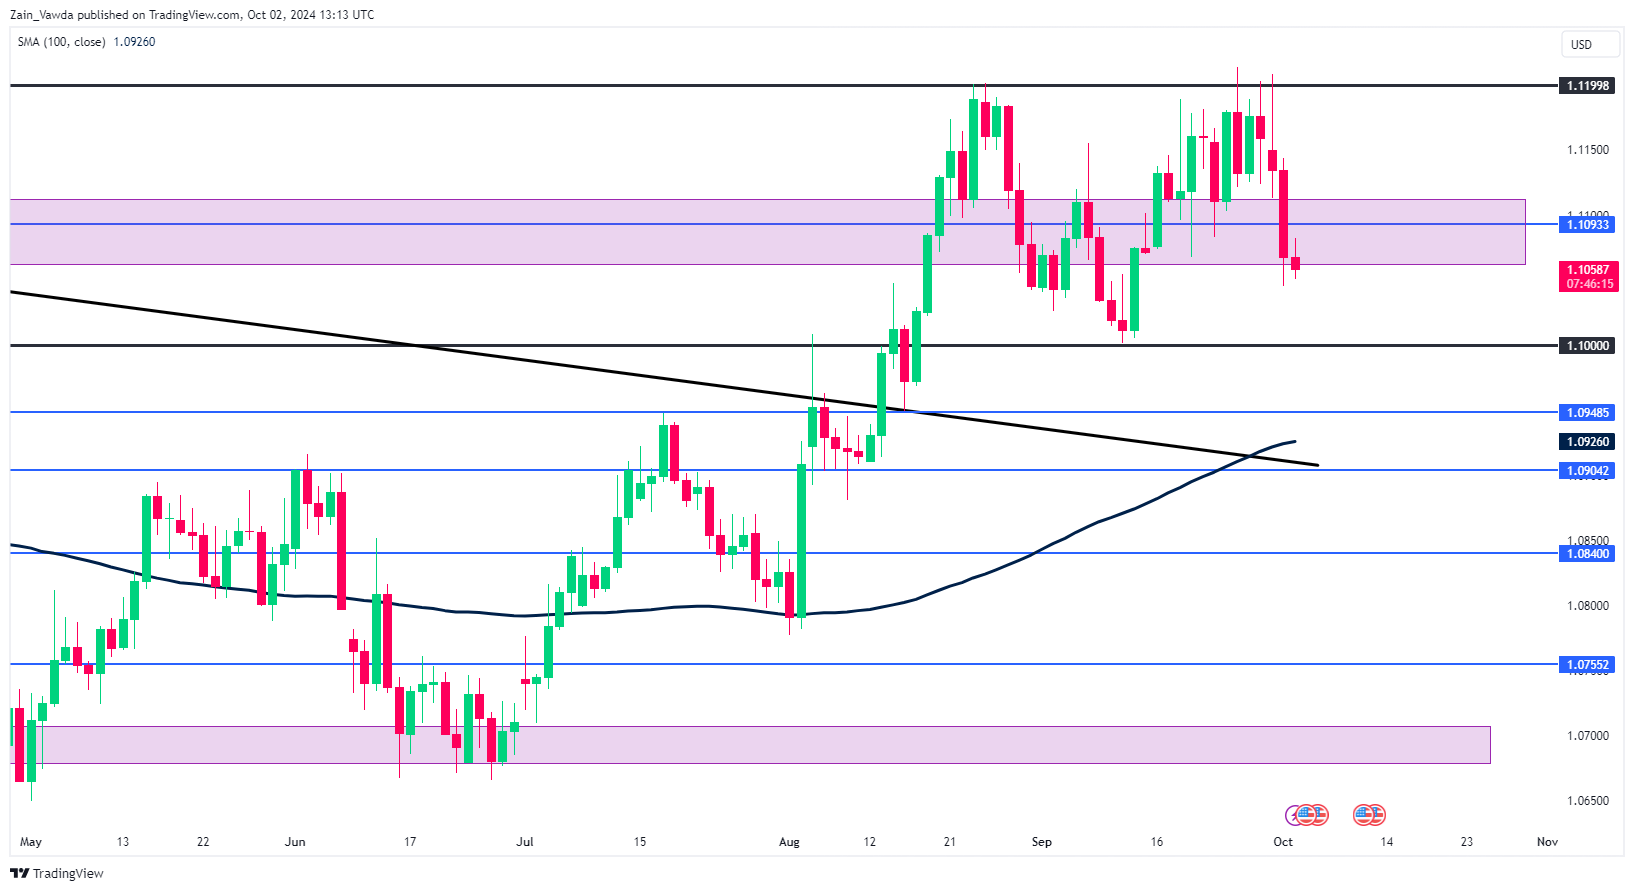
Source: TradingView.com
Support
- 1.1000
- 1.0950
- 1.0900
Resistance
- 1.1100
- 1.1200
- 1.1300
Sunset Market Commentary
Markets
Oil markets show some of the biggest swings today. Brent rose as much as 3.5% before paring gains to 2.7% currently in response to Iran’s missile attack on Israel yesterday. Israeli PM Netanyahu vowed to retaliate and singled out Iran’s oil infrastructure as potential target. As the tit-for-tat strategy intensifies and geopolitical tensions flare up so do fears for a supply disruption. The black gold is currently trading north of $75, compared to $70 less than two days ago. Oil prices are boosting the likes of the Norwegian krone on currency markets. The NOK outperforms G10 peers with EUR/NOK easing to 11.66. First support in the pair approaches around 11.6. On the other side of the FX spectrum is the Japanese yen. JPY slips more than 1%, hurling USD/JPY back above 145. Japan’s freshly appointed prime minister Shigeru Ishiba sat down with Bank of Japan governor Ueda today. Ishiba said in the wake of that meeting that he doesn’t “think that the environment is ready for an additional rate hike”. Whatever little was still priced in for October is now all but gone. Not much happens in between both extremes. EUR/USD is holding a tight sideways 1.105/1.108 range. Some minor dollar strength kicked in after ADP jobs data. The September report topped estimates, coming in at 143k vs 125k expected, following the 103k in August. ADP said “job creation showed a widespread rebound after a five-month slowdown. Only one sector, information, lost jobs. Manufacturing added jobs for the first time since April.” Year-over-year pay gains eased slightly last month, to 4.7%. The small beat is enough to push DXY a tad higher towards 101.47. US Treasuries extended previous losses. The 2-yr yield even printed a small gap following the release of what is usually considered a second tier data point, suggesting perhaps the front end gets a bit crowded with Fed easing bets. Net daily changes vary between 4.5 (2-yr) and 8.2 bps (30-yr). German Bund yields follow closely with gains ranging from +3.5 (2-yr) to +7.5 bps (10-yr). Yesterday’s break of the 10-yr below the August low doesn’t get confirmed today and the failed test of the 2-yr below 2% now triggers some return action higher, even as Latvian governing council member of the ECB Kazaks today greenlighted market expectations for an October cut. The usually hawkish policymaker said “recent data clearly point in the direction of a cut”, adding that “the direction for rates also after October [December] is going to be down”. Both are fully discounted.
News & Views
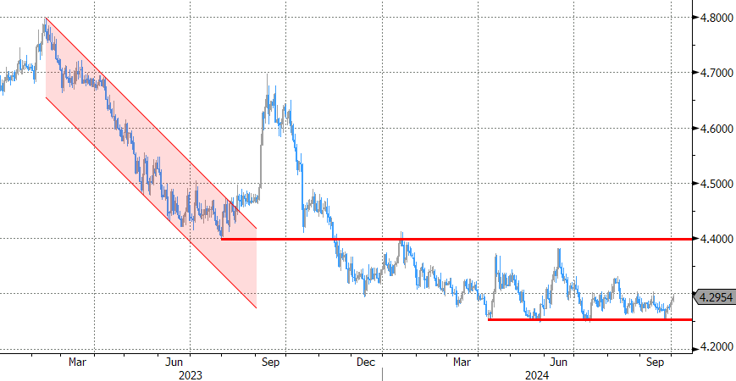
The Hungarian government debt management agency, AKK, updated this year’s funding plan after the government on Monday reported government deficit and debt levels. AKK won’t change its finance plan because it has a sufficient cash buffer to deal with a higher government cash-flow deficit. That’s mainly because of higher than expected HUF institutional bond (96% of HUF 2481bn target) and T-bill issuance in the first three quarters of the years. By the end of September 2024, 77% of the 2024 annual funding plan (HUF 717bn vs HUF 9277bn target) was met. The average term-to-maturity of central government debt was 5.9y at the end of September, a slight decline from 6y at the end of June but still above the 5.5y benchmark target. Contrary to previous plans, and with particular regard to the 30% FX debt share benchmark, there will be neither an FX issuance in the Chinese market, nor a private placement in 2024, which could result in a lower FX debt ratio at the end of the year. The forint suffers in toughening risk climate with EUR/HUF heading to the key resistance and psychological level of 400.
The BoE’s Financial Policy Committee in its quarterly assessment concludes that risks to UK financial stability are broadly unchanged since the June report. Significant financial market and global vulnerabilities remain. The spike in volatility across global markets early August was short-lived. However, the extent of the moves, in response to relatively limited economic news, illustrates the potential for vulnerabilities. Due to a quick rebound thereafter, valuations of equities in particular are seen as having returned to stretched levels. Markets remain susceptible to a sharp correction, which could affect the cost and availability of credit. With respect to the domestic market, there have been further signs of easing in UK credit conditions, reflecting improvements to the macroeconomic outlook. UK household and corporate borrowers remain resilient to the higher interest rate environment although some highly leveraged firms remain under pressure. The UK banking system is seen as being in a strong position to support households and businesses, even if economic and financial conditions were substantially worse than expected.
Graphs
EUR/PLN nears recent highs as the zloty awaits NBP governor Glapinski’s presser following another status quo decision
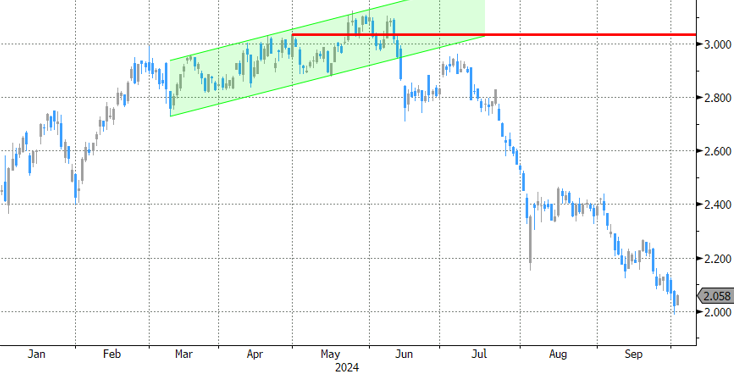
German 2-yr yield’s test of the 2% barrier failed, triggering some return action higher in a broader core bond decline today
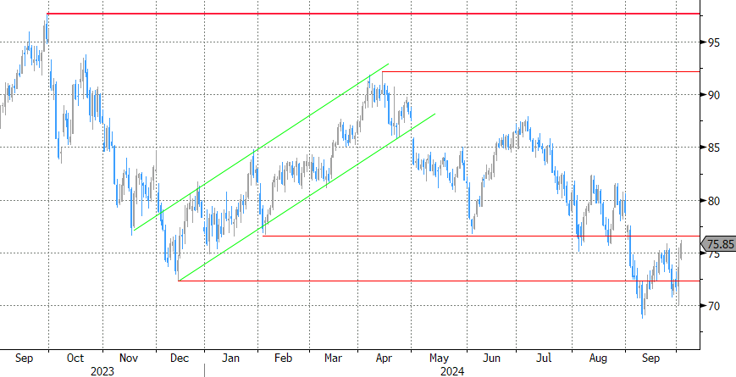
Brent ($/b) extends recent rally as rising geopolitical tensions poses risks for supply
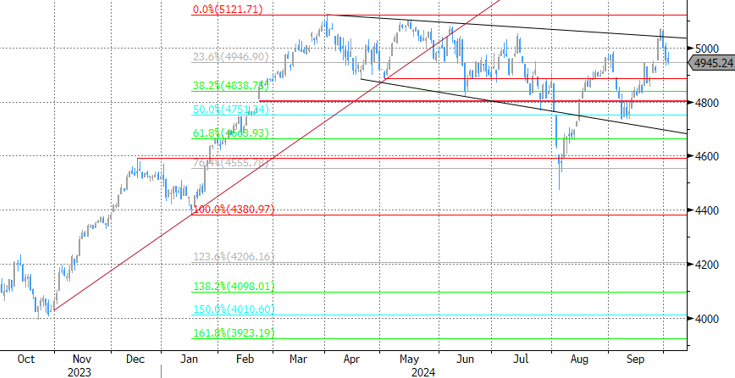
EuroStoxx 50’s topside test failed, edging back below the 5k barrier
EUR/USD Mid-Day Outlook
Daily Pivots: (S1) 1.1028; (P) 1.1086; (R1) 1.1127; More....
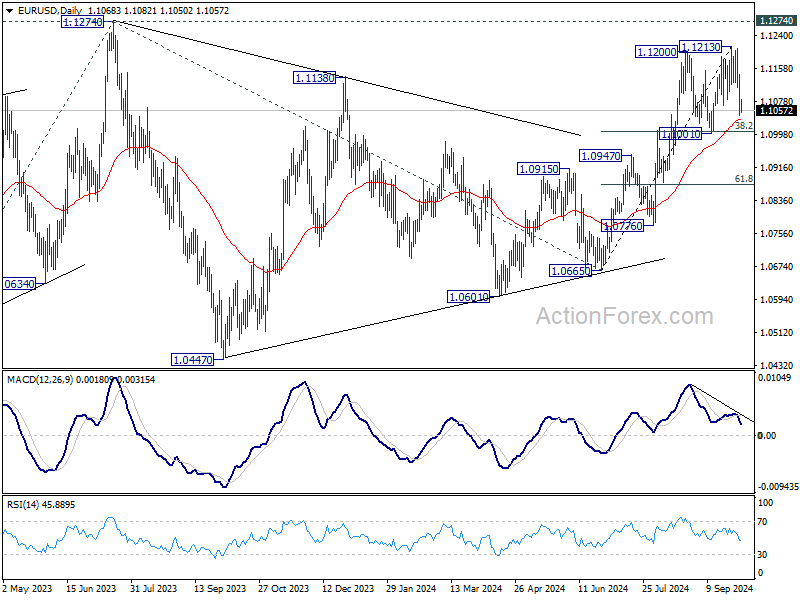
No change in EUR/USD's outlook and intraday bias stays neutral for consolidations below 1.1213 short term top. Further rally is still expected 1.1001 cluster support holds (38.2% retracement of 1.0665 to 1.1213 at 1.1004). Break of 1.1213 will target 1.1274 high. However, decisive break of 1.1001/4 will confirm near term bearish reversal.
In the bigger picture, corrective pattern from 1.1274 should have completed at 1.0665 already. Decisive break of 1.1274 (2023 high) will confirm resumption of whole up trend from 0.9534 (2022 low). Next target will be 61.8% projection of 0.9534 to 1.1274 from 1.0665 at 1.1740. This will now be the favored case as long as 1.1001 support holds.
GBP/USD Mid-Day Outlook
Daily Pivots: (S1) 1.3218; (P) 1.3304; (R1) 1.3370; More...
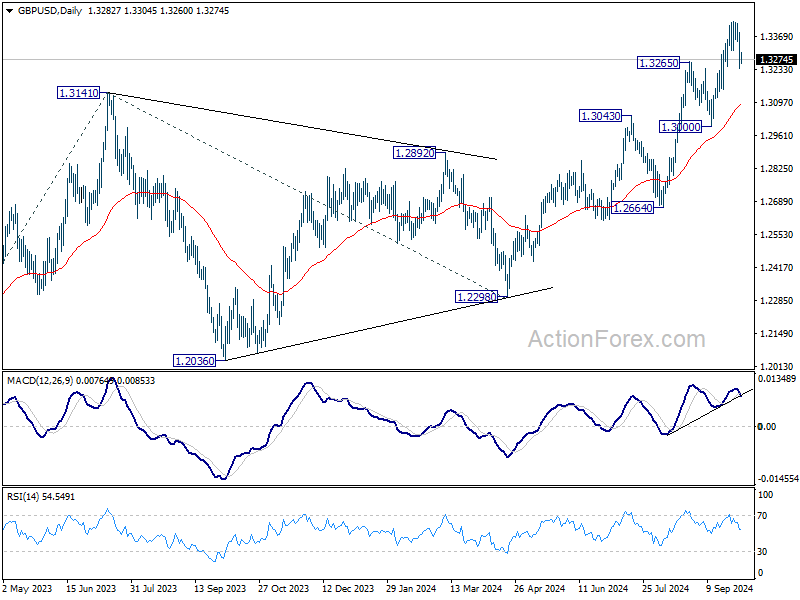
Outlook in GBP/USD remains unchanged and intraday bias stays neutral at this point. Another rally is still in favor as long as 1.3265 resistance turned support holds. Above 1.3433 will resume the rise from 1.2298. However, firm break of 1.3265 will confirm short term topping, and turn bias back to the downside for 1.3000 support instead.
In the bigger picture, up trend from 1.0351 (2022 low) is in progress. Next target is 61.8% projection of 1.0351 to 1.3141 from 1.2298 at 1.4022. For now, outlook will stay bullish as long as 1.3000 support holds, even in case of deep pullback.
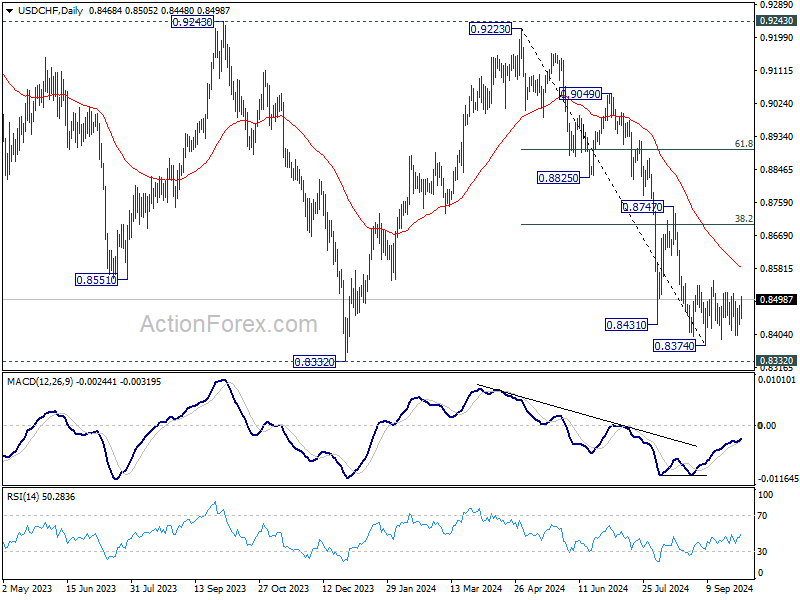
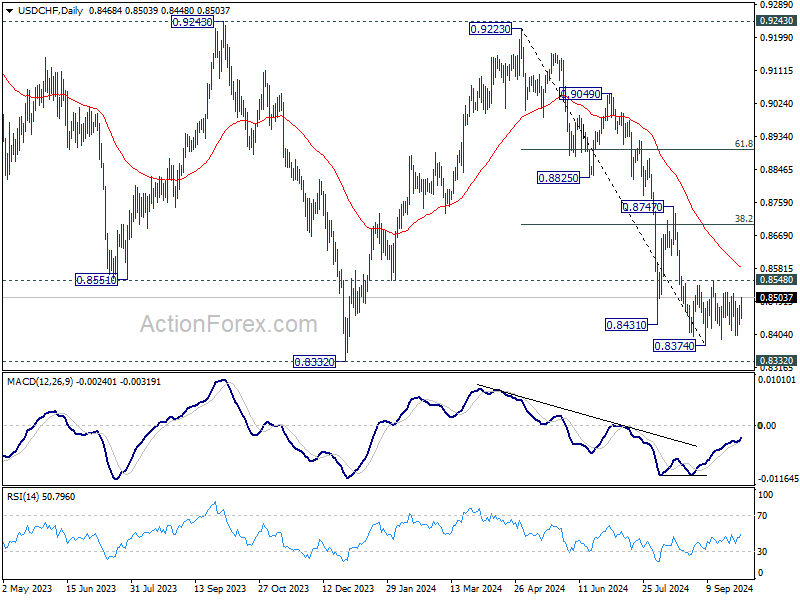
USD/CHF Mid-Day Outlook
Daily Pivots: (S1) 0.8438; (P) 0.8460; (R1) 0.8488; More…
USD/CHF is still bounded in range trading and intraday bias stays neutral for the moment. On the downside, break of 0.8374 will resume the fall from 0.9223 to retest 0.8332 low. Decisive break there will indicate larger down trend resumption. Nevertheless, firm break of 0.8548 will argue that it's correcting whole fall from 0.9223. Intraday bias will be back on the upside for 38.2% retracement of 0.9223 to 0.8374 at 0.8698 at least.
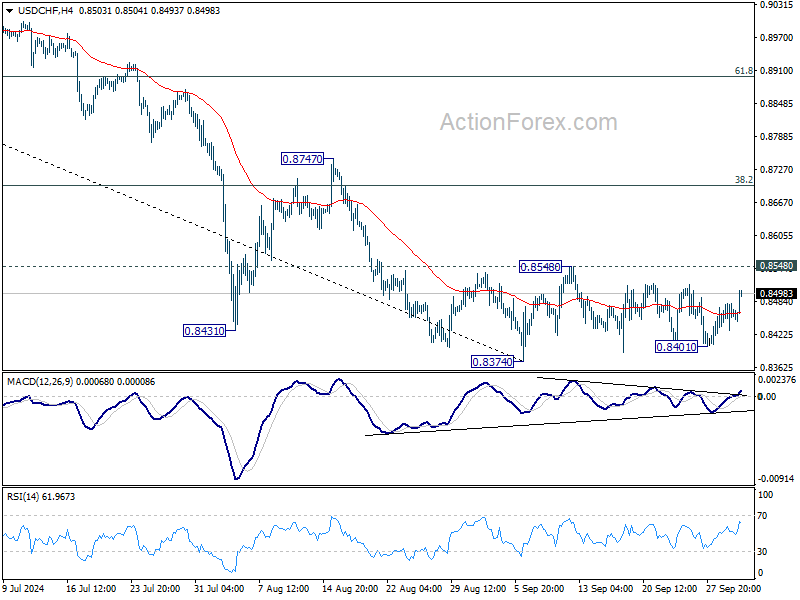
In the bigger picture, price actions from 0.8332 (2023 low) are currently seen as a medium term corrective pattern, with fall from 0.9223 as the second leg. Strong support could be seen from 0.8332 to bring rebound. Yet, overall outlook will continue to stay bearish as long as 0.9243 resistance holds. Firm break of 0.8332, however, will resume larger down trend from 1.0146 (2022 high).
USD/JPY Mid-Day Outlook
Daily Pivots: (S1) 142.85; (P) 143.69; (R1) 144.41; More...
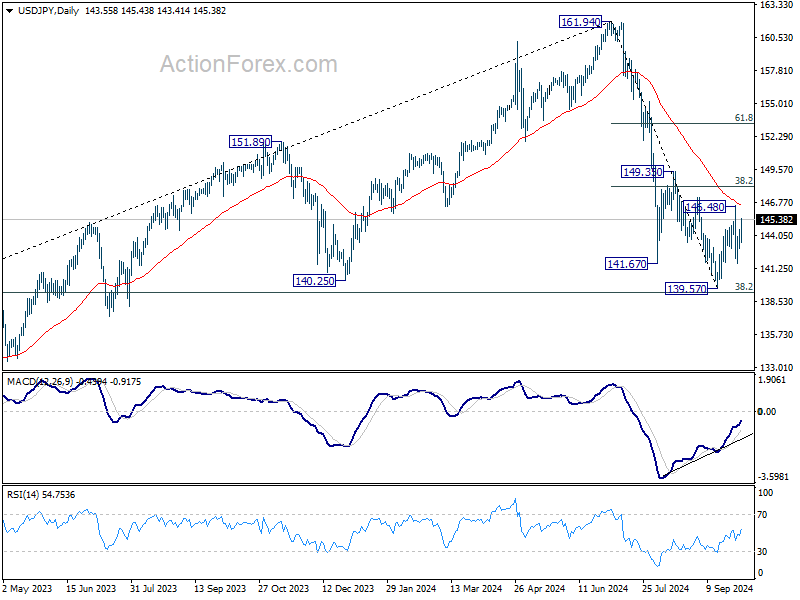
USD/JPY rebounded strongly today and focus is now on 146.48 resistance. Firm break there will resume the rebound from 139.57 to 38.2% retracement of 161.94 to 139.57 at 148.11. On the downside, below 141.63 will turn bias to the downside for 139.57 support. But in this case, strong support could be seen again from 139.26 fibonacci level to bring rebound.
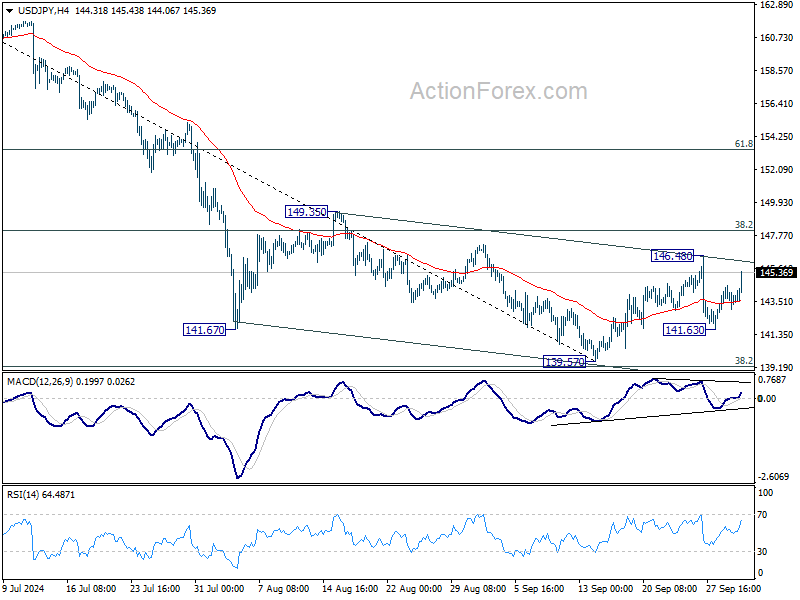
In the bigger picture, fall from 161.94 medium term top is seen as correcting whole up trend from 102.58 (2021 low). Strong support could be seen from 38.2% retracement of 102.58 to 161.94 at 139.26 to contain downside, at least on first attempt. But in any case, risk will stay on the downside as long as 149.35 resistance holds. Sustained break of 139.26 would open up deeper medium term decline to 61.8% retracement at 125.25.
Yen Weakens as Ishiba Softens Rate Hike Stance, US Yields Rise
Japanese Yen weakened notably in early US session, reacting to rising US Treasury yields, which were boosted by stronger-than-expected US ADP job data. Adding to Yen’s decline, Japan’s new Prime Minister, Shigeru Ishiba, who was initially perceived as a monetary hawk, has softened his stance on interest rate hikes. After meeting with BoJ Governor Kazuo Ueda, Ishiba said he does not believe it is the right time for the BoJ to raise rates further, dampening expectations of another rate hike in December.
Reinforcing this dovish tone, Japan's newly appointed Economy Minister, Ryosei Akazawa, emphasized in a press conference that Japan's "top priority" is to ensure a "complete exit from deflation." Akazawa further clarified that Ishiba’s previous comments on monetary Japanese Yen weakened notably in early US session, reacting to rising US Treasury yields, which were boosted by stronger-than-expected US ADP job data. Adding to Yen’s decline, Japan’s new Prime Minister, Shigeru Ishiba, who was initially perceived as a monetary hawk, has softened his stance on interest rate hikes. After meeting with BoJ Governor Kazuo Ueda, Ishiba said he does not believe it is the right time for the BoJ to raise rates further, dampening expectations of another rate hike in December.policy normalization were contingent on several "conditions," signaling that any rate hikes would depend on broader economic circumstances.
Elsewhere, Dollar has strengthened against both Yen and Swiss Franc but is struggling to extend its recovery against other major currencies. Traders are adopting a cautious stance, waiting for developments in the Middle East and key US economic reports, including ISM Services PMI and non-farm payrolls data, which could impact sentiment and influence Fed's policy outlook.
In terms of performance today, Australian Dollar is leading the market, followed by New Zealand Dollar and Canadian Dollar. Yen is the worst performer, followed by Swiss Franc and Dollar, while Euro and British Pound are trading in middle positions.
Techinically, USD/CHF is worth a watch in the next 24 hours given then Swiss CPI data will be released tomorrow. Break of 0.8548 resistance will suggest that rebound from 0.8374 is at least correcting the whole decline from 0.9223. In this case, further rally should be seen to 38.2% retracement of 0.9223 to 0.8374 at 0.8698 at least.
In Europe, at the time of writing, FTSE is up 0.11%. DAX is down -0.58%. CAC is down -0.08%. UK 10-year yield is up 0.099at 4.043. Germany 10-year yield is up 0.065 at 2.106. Earlier in Asia, Nikkei fell -2.18%. Hong Kong HSI rose 6.20%. China was on holiday. Singapore Strait Times rose 0.10%. Japan 10-year JGB yield fell -0.0331 to 0.820.
US ADP employment rises 143K, wage growth slows
US ADP report for September showed private employment increased by 143k, surpassing expectations of 120k. The goods-producing sector added 42k jobs, while the service-providing sectors contributed 101k new jobs.
By establishment size, small companies saw a loss of -8k jobs, while medium-sized businesses added 64k and large companies increased their workforce by 86k.
Wage growth continued to slow, with year-over-year pay gains for job-stayers easing to 4.7%. The decline was more pronounced for job-changers, whose wage growth fell from 7.3% to 6.6%.
Nela Richardson, ADP’s chief economist, noted that "stronger hiring didn't require stronger pay growth last month." She also pointed out that the premium job-changers usually enjoy over job-stayers narrowed to 1.9%, matching the low last seen in January.
ECB's de Guindos cites weaker growth outlook, expects recovery to strengthen over time
In a speech today, ECB Vice President Luis de Guindos acknowledged that Eurozone growth was weaker than expected in Q2, leading to a downward revision in the growth outlook for the region. He added that risks to growth remain "tilted to the downside".
Despite this, de Guindos expressed optimism for the future, expecting the recovery to "strengthen over time". He cited rising real incomes and the waning impact of restrictive monetary policy as key factors that should bolster consumption and investment. Additionally, he pointed to boost in exports as global demand improves, contributing to the recovery.
Eurozone unemployment rate unchanged at 6.4%, EU down to 5.9%
Eurozone’s unemployment rate was unchanged at 6.4% in August, aligning with market expectations. Meanwhile, EU unemployment rate fell slightly from 6.0% to 5.9%.
The report estimates that 13.027m people in EU, including 10.925m in Eurozone, were unemployed in August. Compared with the previous month, unemployment decreased by -108k across EU and by -94k within Eurozone.
On an annual basis, the improvement was even more notable. Compared to August 2023, the number of unemployed people dropped by -142k in EU and by -233k in Eurozone.
BoJ’s Ueda vows extremely high vigilance amid domestic and global economic uncertainties
BoJ Governor Kazuo Ueda reaffirmed today that Japan's economy is expected to sustain a moderate recovery, which should support underlying inflation in converging toward 2% target over the coming years. However, Ueda did not repeat the usual pledge to continue raising interest rates if inflation moves in line with forecasts, signaling a shift in tone towards a more cautious approach.
Ueda highlighted the ongoing uncertainties surrounding Japan's economy and inflation, stating that "uncertainty regarding Japan's economy and prices remain high." He also pointed to external risks, noting that the outlook for overseas economies, including the US, remains unclear, while financial markets continue to show signs of instability.
Given these risks, Ueda emphasized the need for "extremely high vigilance" in assessing economic developments. For now, BoJ will maintain a cautious stance, closely scrutinizing both domestic and global factors before tightening monetary policy again.
USD/JPY Mid-Day Outlook
Daily Pivots: (S1) 142.85; (P) 143.69; (R1) 144.41; More...
USD/JPY rebounded strongly today and focus is now on 146.48 resistance. Firm break there will resume the rebound from 139.57 to 38.2% retracement of 161.94 to 139.57 at 148.11. On the downside, below 141.63 will turn bias to the downside for 139.57 support. But in this case, strong support could be seen again from 139.26 fibonacci level to bring rebound.
In the bigger picture, fall from 161.94 medium term top is seen as correcting whole up trend from 102.58 (2021 low). Strong support could be seen from 38.2% retracement of 102.58 to 161.94 at 139.26 to contain downside, at least on first attempt. But in any case, risk will stay on the downside as long as 149.35 resistance holds. Sustained break of 139.26 would open up deeper medium term decline to 61.8% retracement at 125.25.
Analysis of GBP/CAD: Price Falls Below 1.800 Level
In the first nine months of 2024, the GBP/CAD exchange rate rose by over 7%, surpassing the significant 1.800 level.
The last time GBP/CAD remained consistently above this level was back in 2016, but it later dropped below. Since then, bulls have made two attempts to push the price above 1.800: in 2018 and again in 2020 (during the coronavirus panic) – both of which failed.
A third attempt occurred when GBP/CAD climbed above 1.800 in September 2024, but yesterday’s large bearish candles (marked with an arrow) suggest that this attempt to stay above 1.800 may also fail.
Yesterday’s decline in GBP/CAD was driven by a combination of factors, including:
→ A rise in oil prices, which strengthens the Canadian dollar as Canada is a major exporter of oil;
→ A slowdown in manufacturing activity in the UK during September, as reported by Reuters.
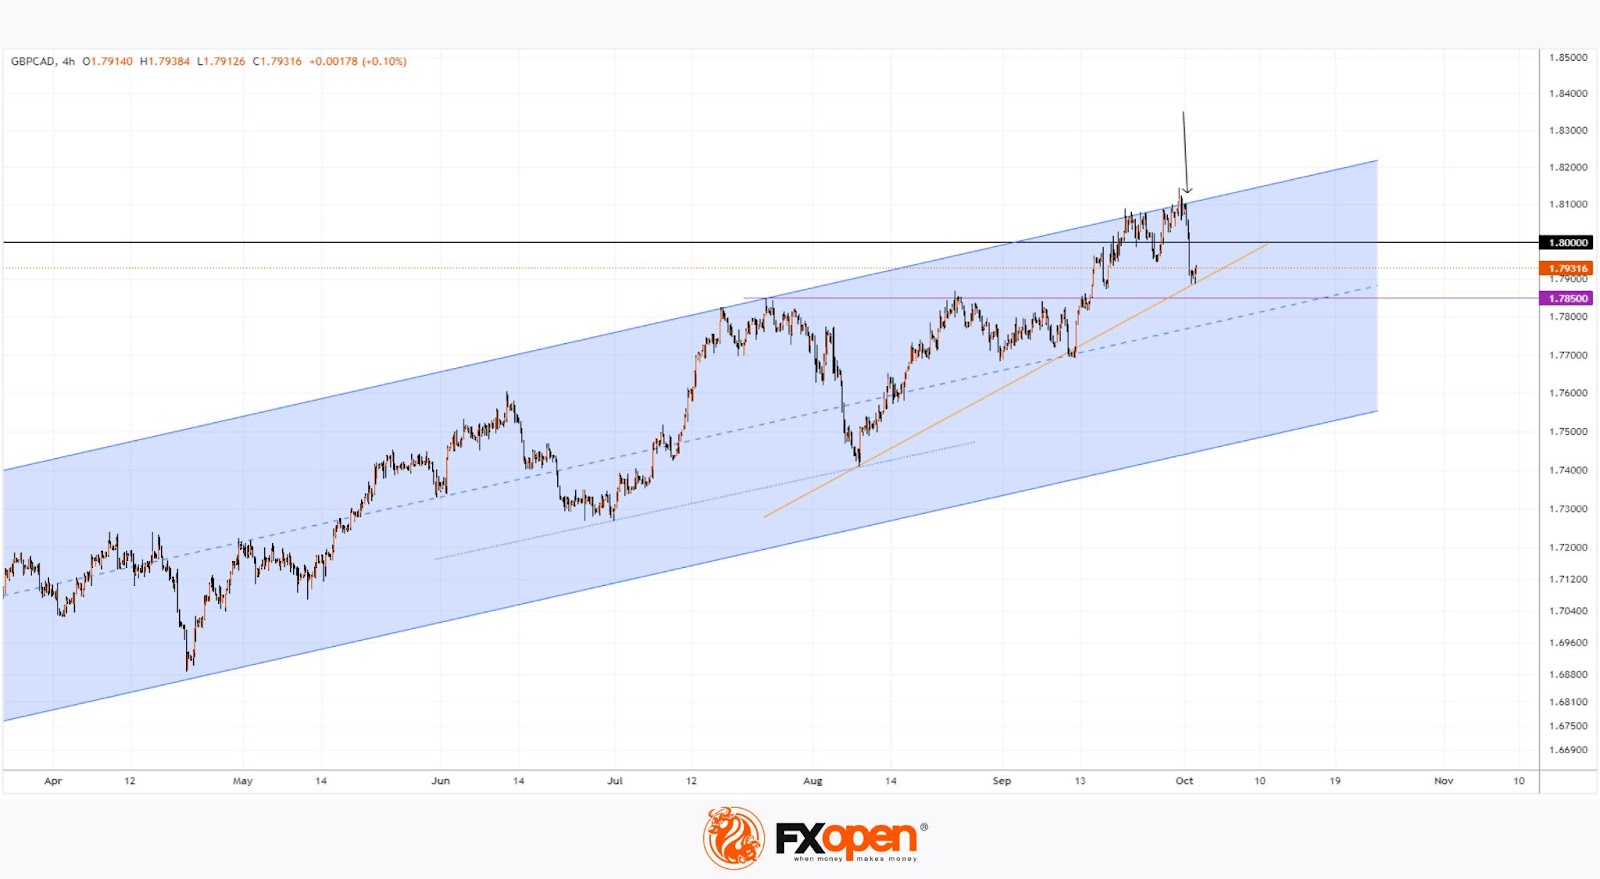
Technical analysis of the GBP/CAD chart shows the price is moving within an ascending channel (marked in blue), which has remained relevant since the start of 2024.
Support levels for the price could be
→ The 1.78500 level (which acted as resistance from mid-July before being broken in September);
→ The median line of the ascending channel;
→ The orange trendline.
However, it is possible that these support levels may not be strong enough to ensure that GBP/CAD can consistently hold above the 1.800 level, which has historically acted as key resistance.
Trade over 50 forex markets 24 hours a day with FXOpen. Take advantage of low commissions, deep liquidity, and spreads from 0.0 pips. Open your FXOpen account now or learn more about trading forex with FXOpen.
This article represents the opinion of the Companies operating under the FXOpen brand only. It is not to be construed as an offer, solicitation, or recommendation with respect to products and services provided by the Companies operating under the FXOpen brand, nor is it to be considered financial advice.
Japanese Yen Slides as Political Drama Continues
The yen is sharply lower on Wednesday. In the European session, the USD/JPY is trading at 144.82 at the time of writing, up 0.89%.
New finance minister makes markets uneasy
In Japan, the dust is yet to settle on the political drama. On Tuesday, the new Prime Minister, Shigeru Ishiba, appointed Katsunobu Kato as finance minister. Kato is a supporter of “Abenomics” which advocates monetary easing. This could complicate the BoJ’s plans to tighten policy and the yen has responded with sharp losses today.
Ishiba is on record for supporting a tighter policy but may have chosen Kato to ease concerns that Ishiba will make a significant shift in monetary policy with a snap election on October 27. The election will be followed by the next BoJ meeting on October 31, with the BoJ expected to maintain its policy settings.
Japan and US manufacturing PMIs continue to contract
Manufacturing continues to sputter in both the US and Japan. The Japanese manufacturing PMI eased to a revised 49.7 in September, down from 49.8 in August and above the market estimate of 49.6. This was the third straight month of contraction in factory activity, with a strong decrease in export orders. Business confidence dropped to its lowest since December 2022, as manufacturers don’t see a light at the end of the tunnel for the troubled manufacturing sector.
In the US, the ISM manufacturing PMI was unchanged in September at 47.2, below the market estimate of 47.5. The contraction in manufacturing has extended for six straight months. New orders decreased in September, demand remains weak and manufacturers face uncertainty over the Federal Reserve’s monetary policy and the upcoming US election.
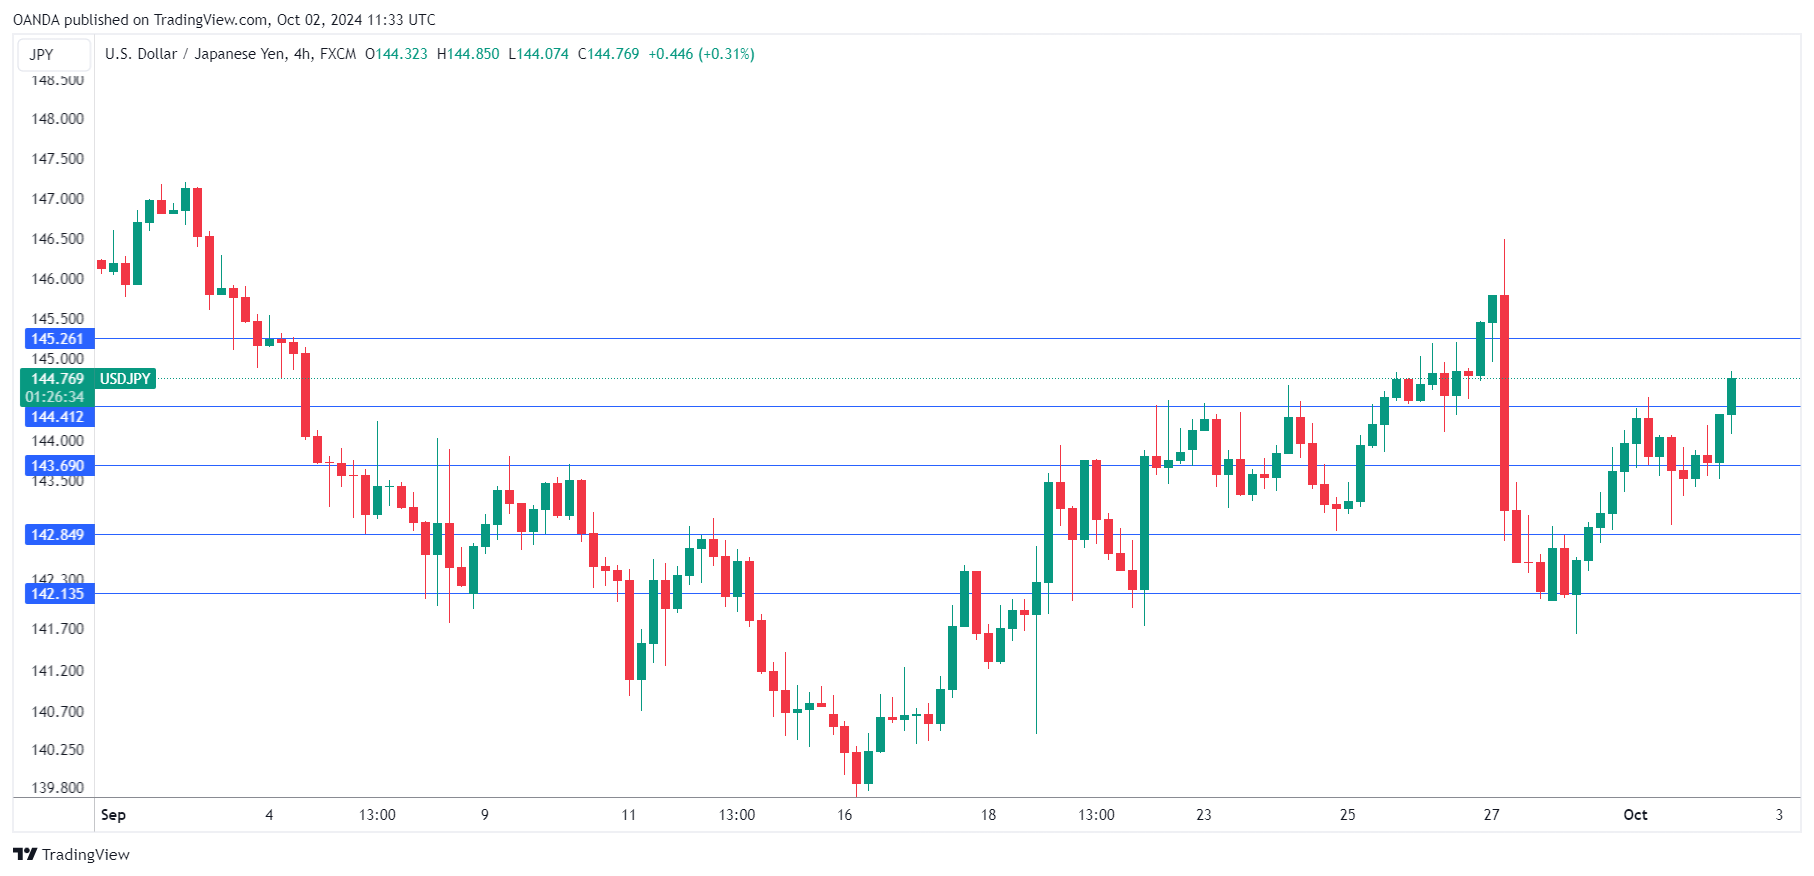
USD/JPY Technical
- USD/JPY has pushed above resistance at 143.69 and 144.41. Above, there is resistance at 145.25
- There is support at 142.85 and 142.13
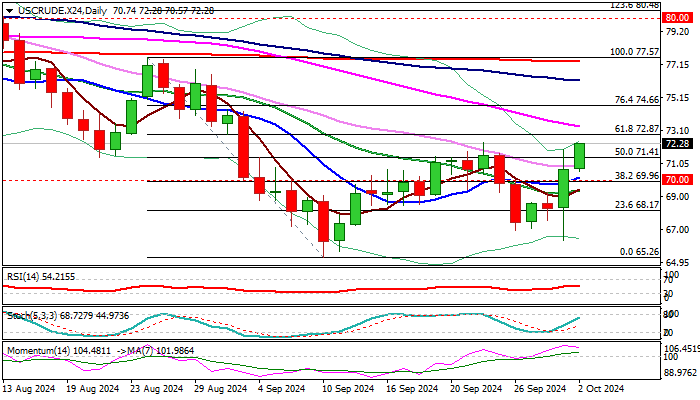
WTI Oil Outlook: Crude Prices Extend Gains on Escalation of the Middle East Crisis
Oil price extends strong rise into second consecutive day, advancing 1.6% during European session on Wednesday, following 3.45% advance on Tuesday (the biggest daily gain since Aug 12).
Growing fears that further escalation of the war in the Middle East could disrupt crude supply from the region, lifted oil prices significantly during past two sessions.
The latest rally improved the structure on daily chart, as the price rose above 50% retracement of $77.57/$65.26 bear-leg and psychological $70 level, underpinned by strong positive momentum and 10/20DMA’s in bullish configuration.
Bulls pressure pivotal resistance at $72.38 (Sep 24 lower top), break of which to generate fresh bullish signal on completion of bullish failure swing pattern on daily chart and soften strong bearish structure on weekly chart (multiple MA Death crosses / strong negative momentum).
Broken daily Kijun-sen ($71.08) should ideally contain dips and maintain bullish bias.
Caution on breach of $70 level (reinforced by 10DMA), which reverted to solid support and marks a breakpoint.
Fundamentals, however, are likely to play a key role in coming days, with further conflict escalation to provide fresh boost to oil price and open way for stronger upside acceleration.
Res: 72.38; 72.87; 73.37; 74.27.
Sup: 71.41; 70.88; 70.00; 69.26.