Sample Category Title
Dollar Advances with ISM Services Data Looming, Swiss CPI on Watch
Dollar is gaining some traction, emerging as the strongest currency of the week so far. Several factors are underpinning this momentum. First, Fed Chair Jerome Powell has reaffirmed the expectation of two additional rate cuts this year, adhering to the script established in the latest dot plot. This stance has tempered market speculation about another aggressive 50bps cut at the upcoming November meeting.
Second, a chorus of ECB officials is aligning with market expectations for a 25bps rate cut this month. Notably, even a top hawkish member have shifted her tone to express increased concern over economic growth. This collective dovishness adds downward pressure on Euro. Third, Japan's new Prime Minister has softened his previously hawkish stance on monetary policy. In a significant turnaround, he has indicated support for BoJ be cautious regarding any additional rate hikes. This shift has weighed heavily on Yen, making it the weakest performer among major currencies this week.
For now, fed fund futures are still seeing 36% chance of a 50bps Fed cut on November 7, and 64% chance of 25bps. The most critical data would be tomorrow's non-farm payrolls, but a slight miss in headline job growth might not be able to alter Fed officials' minds. Today's ISM services will carry some weight too, and Fed would hope that services activities are not deteriorating too much.
Elsewhere, Swiss CPI data due today will also be important. New SNB Chair Martin Schlegel has warned earlier in the week that downside risks to inflation is "definitely" higher than upside risks. He even emphasized that SNB won't rule out negative interest rate should deflation risk materializes. Swiss CPI is expected to be unchanged at 1.1% in September and any downside surprise would add to the case of another 25bps rate cut in December.
Overall in the currency markets, Loonie is the second strongest for the week at this point, following Dollar, as underpinned by rebound in oil prices. Aussie is currently the third best, but started to lose momentum as the boost from China's stimulus measures is fading. On the other hand, Yen is the worst performer for the week, followed by Kiwi, and then Swiss Franc. Euro and Sterling are positioned in the middle.
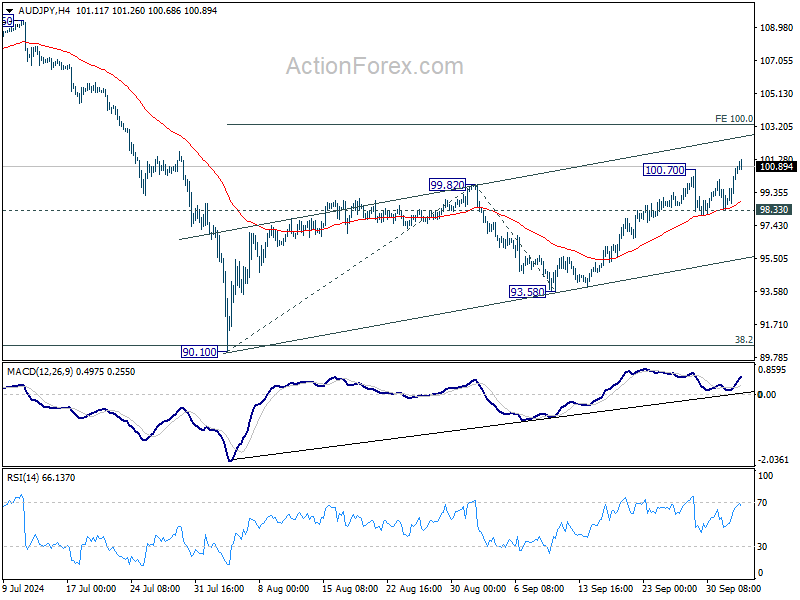
Technically, AUD/JPY's near term rally resumed by breaking through 100.70 temporary top. Further rise is now expected as long as 98.33 support holds, towards 100% projection of 90.10 to 99.82 from 93.58 at 103.30. However, as the rebound from 90.10 is seen as the second leg of the medium term consolidation pattern from 109.36, AUD/JPY should start to lose momentum above 103.30. Strong resistance should emerge below 109.36 high to bring near term reversal.
In Asia, at the time of writing, Nikkei is up 2.24%. Hong Kong HSI is down -4.14%. China is still on holiday. Singapore Strait Times is down -0.10%. Japan 10-year JGB yield is up 0.014 at 0.834. Overnight, DOW rose 0.09%. S&P 500 rose 0.01%. NASDAQ rose 0.08%. 10-year yield rose 0.042 to 3.785.
BoJ's Noguchi urges patience before Japan's inflation mindset shifts
BoJ Board Member Asahi Noguchi, a known dovish, emphasized in a speech today that Japanese society still needs "considerable time" to go before fully adopting a mindset aligned with the central bank's 2% inflation target. Noguchi highlighted the importance of BoJ maintaining its accommodative monetary policy until this shift in mindset occurs.
With inflation surpassing the 2% target for over two years and nominal wages rising, Japanese firms are increasingly willing to pass on higher costs through price hikes. However, Noguchi highlighted that real consumption remains weak, as households continue to expect low price growth—a mindset shaped by Japan's prolonged deflationary period.
Japan's PMI services finalized at 53.1, composite at 52.0
Japan’s services sector continued its expansion in September, although growth eased slightly. The final Services PMI was recorded at 53.1, down from 53.7 in August, marking a sustained rise in business activity for all but one of the past 25 months. Composite PMI, which includes both services and manufacturing, stood at 52.0, down from 52.9 in August, remaining above the 50-neutral threshold for the third consecutive month.
Usamah Bhatti, economist at S&P Global Market Intelligence, highlighted that the service sector’s strong performance carried into the end of Q3. The average reading for Q3 (53.5) was largely in line with Q1’s average of 53.4, signaling "sustained growth" in the service economy.
However, the manufacturing sector continued to struggle, weighing on overall private sector performance. While service sector remains a pillar of growth, aggregate new business growth slowed in September, and backlogs of work fell for the fifth consecutive month. The outlook for the wider private sector will depend on how the service economy responds to downside risks, including a stagnating economy.
Fed's Barkin flags risk of inflation getting stuck
In the remarks overnight, Richmond Fed President Thomas Barkin expressed that he's still "more concern about inflation" than the labor market. He added due to solid demand and renewed labor market tightness, there are challenges in completing the "last mile" of of the inflation fight.
While Barkin dismissed the notion of a "big resurgence" in inflation, he acknowledged the "very real risk" of inflation "getting stuck".
He stated that he would be optimistic if, by Q1, inflation continued to show signs of stabilization, which would allow Fed to consider moving back to a "neutral" policy stance.
However, Barkin made it clear that "normalization comes when you're convinced that inflation hits 2%." He remains "open-minded" on how quickly rates could fall, leaving room for flexibility depending on future inflation data.
ECB’s hawk Schnabel turns attention from inflation to rising growth risks
ECB Executive Board member Isabel Schnabel, widely known for her hawkish stance, has shifted her tone, adding to growing signals from other officials that the central bank is preparing for a 25bps rate cut this month.
Schnabel acknowledged in a speech overnight the "headwinds to growth," pointing to weakening labor demand and progress in disinflation. She noted that a "sustainable fall of inflation back to our 2% target in a timely manner is becoming more likely," despite persistent inflation in services and strong wage growth.
Schnabel also highlighted that while the peak impact of monetary tightening is likely behind us and real incomes are rising, the recovery remains fragile. “Growth remains shallow,” she said, with the recovery repeatedly falling short of expectations over the past 18 months.
In separate remarks, Governing Council member Mario Centeno, a known dove, warned of the "new risk" of inflation undershooting the ECB’s target.
Centeno cautioned that this could "stifle economic growth," leading to fewer jobs and reduced investment. A sluggish economy, he said, could create a "vicious cycle," further driving inflation below the target and compounding economic challenges.
Looking ahead
Swiss CPI is a main focus in European session. Eurozone will release PPI and PMI services final. UK will also publish PMI services final. Later in the day, US ISM services will take center stage, while jobless claims and factory orders will also be featured.
USD/JPY Daily Outlook
Daily Pivots: (S1) 144.41; (P) 145.47; (R1) 147.51; More...
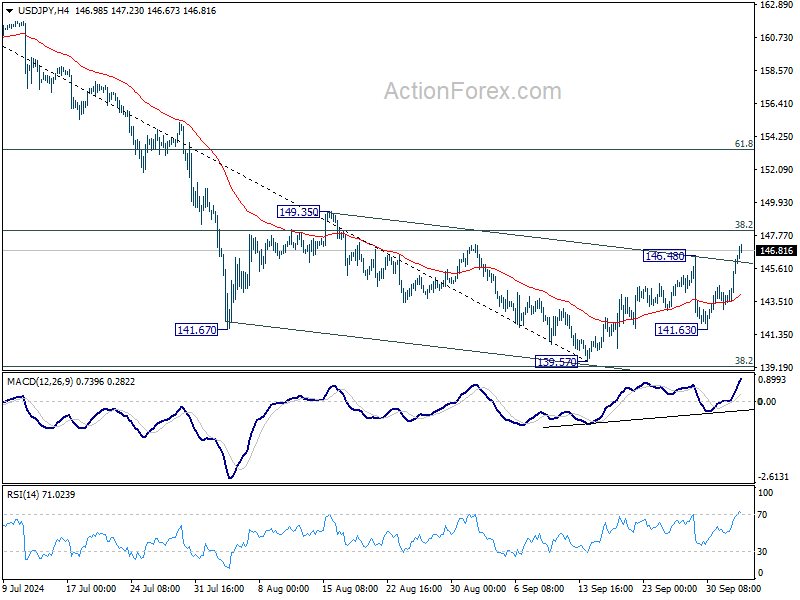
USD/JPY's rebound from 139.57 short term bottom resumed by breaking through 146.47 resistance. Intraday bias is back on the upside for 38.2% retracement of 161.94 to 139.57 at 148.11. Decisive break there will argue that whole fall from 161.95 has completed ahead of 139.26 fibonacci level, and bring further rally to 61.8% retracement at 153.39. For now, risk will stay on the upside as long as 141.63 support holds, in case of retreat.
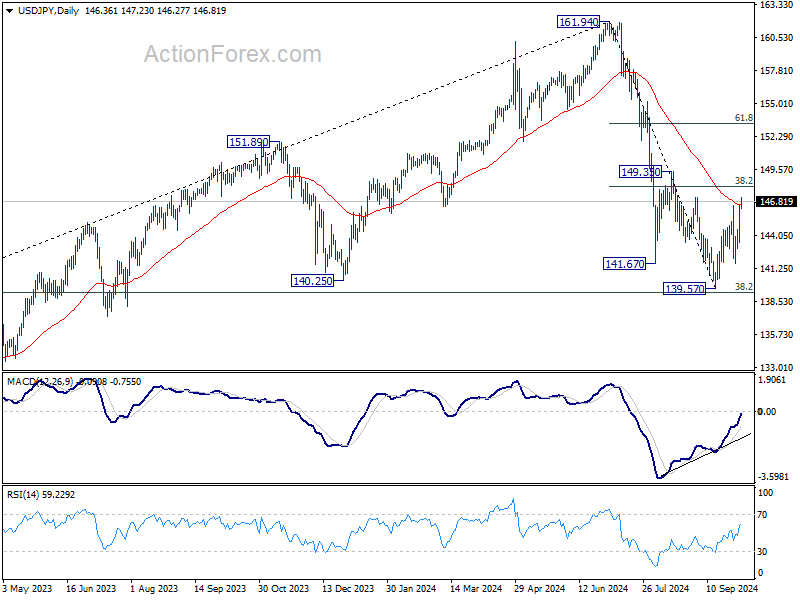
In the bigger picture, fall from 161.94 medium term top is seen as the first leg of the correction to whole up trend from 102.58 (2021 low). Strong support could be seen from 38.2% retracement of 102.58 to 161.94 at 139.26 to contain downside, at least on first attempt. Firm break of 149.35 resistance will indicate that the second leg has started. However, sustained break of 139.26 would open up deeper medium term decline to 61.8% retracement at 125.25.
Ethereum Rejected: Can It Avoid a Deeper Downturn?
Key Highlights
- Ethereum failed to surpass the $2,800 resistance and trimmed most gains.
- ETH price is following a major bearish trend line with resistance near $2,820 on the daily chart.
- Bitcoin price remains at risk of more losses below $60,000.
- Gold prices might gain pace for a move toward the $2,700 level.
Ethereum Technical Analysis
Ethereum struggled to surpass the $2,750 level and corrected gains. There was a rejection pattern on the chart, suggesting that ETH could face more downsides.
Looking at the daily chart, the price was rejected again below the 50% Fib retracement level of the downward move from the $2,560 swing high to the $2,078 low. It also stayed below the $2,800 resistance zone, the 100-day simple moving average (red), and the 200-day simple moving average (green).
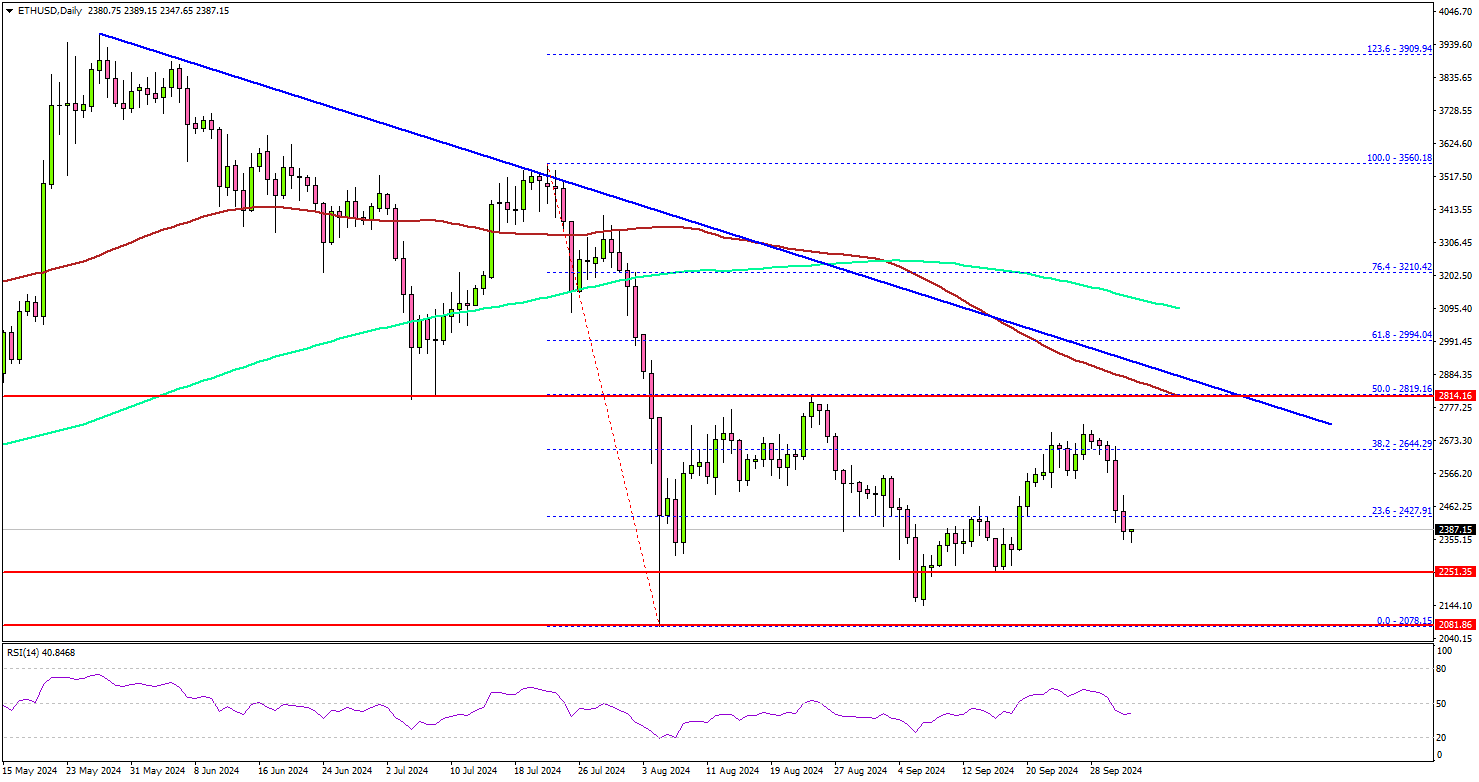
The price is now trading below the $2,620 level and signaling a downturn. The next major support is near $2,250, below which the price could slide toward $2,165. Any more losses might call for a move toward the $2,050 level.
On the upside, ETH is facing resistance near the $2,640 level. The next major resistance is near the $2,800 level. There is also a connecting bearish trend line with resistance at $2,850 on the same chart.
A daily close above the $2,820 resistance zone could start another steady increase. In the stated case, the price may perhaps rise toward the $3,000 level. The next stop for the bulls may perhaps be near the $3,250 level.
Looking at Bitcoin, the bears were able to push the price below $62,000 and might aim for more losses below $60,000.
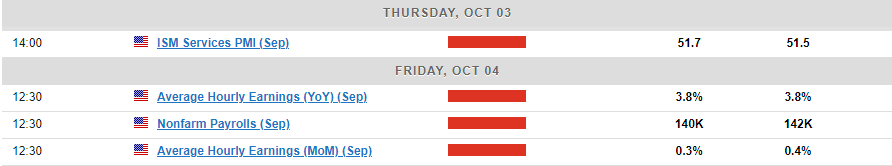
Economic Releases
- US ISM Services Index for Sep 2024 – Forecast 51.7, versus 51.5 previous.
- US Initial Jobless Claims - Forecast 220K, versus 218K previous.
BoJ’s Noguchi urges patience before Japan’s inflation mindset shifts
BoJ Board Member Asahi Noguchi, a known dovish, emphasized in a speech today that Japanese society still needs "considerable time" to go before fully adopting a mindset aligned with the central bank's 2% inflation target. Noguchi highlighted the importance of BoJ maintaining its accommodative monetary policy until this shift in mindset occurs.
With inflation surpassing the 2% target for over two years and nominal wages rising, Japanese firms are increasingly willing to pass on higher costs through price hikes. However, Noguchi highlighted that real consumption remains weak, as households continue to expect low price growth—a mindset shaped by Japan's prolonged deflationary period.
Japan’s PMI services finalized at 53.1, composite at 52.0
Japan’s services sector continued its expansion in September, although growth eased slightly. The final Services PMI was recorded at 53.1, down from 53.7 in August, marking a sustained rise in business activity for all but one of the past 25 months. Composite PMI, which includes both services and manufacturing, stood at 52.0, down from 52.9 in August, remaining above the 50-neutral threshold for the third consecutive month.
Usamah Bhatti, economist at S&P Global Market Intelligence, highlighted that the service sector’s strong performance carried into the end of Q3. The average reading for Q3 (53.5) was largely in line with Q1’s average of 53.4, signaling "sustained growth" in the service economy.
However, the manufacturing sector continued to struggle, weighing on overall private sector performance. While service sector remains a pillar of growth, aggregate new business growth slowed in September, and backlogs of work fell for the fifth consecutive month. The outlook for the wider private sector will depend on how the service economy responds to downside risks, including a stagnating economy.
ECB’s hawk Schnabel turns attention from inflation to rising growth risks
ECB Executive Board member Isabel Schnabel, widely known for her hawkish stance, has shifted her tone, adding to growing signals from other officials that the central bank is preparing for a 25bps rate cut this month.
Schnabel acknowledged in a speech overnight the "headwinds to growth," pointing to weakening labor demand and progress in disinflation. She noted that a "sustainable fall of inflation back to our 2% target in a timely manner is becoming more likely," despite persistent inflation in services and strong wage growth.
Schnabel also highlighted that while the peak impact of monetary tightening is likely behind us and real incomes are rising, the recovery remains fragile. “Growth remains shallow,” she said, with the recovery repeatedly falling short of expectations over the past 18 months.
In separate remarks, Governing Council member Mario Centeno, a known dove, warned of the "new risk" of inflation undershooting the ECB’s target.
Centeno cautioned that this could "stifle economic growth," leading to fewer jobs and reduced investment. A sluggish economy, he said, could create a "vicious cycle," further driving inflation below the target and compounding economic challenges.
Fed’s Barkin flags risk of inflation getting stuck
In the remarks overnight, Richmond Fed President Thomas Barkin expressed that he's still "more concern about inflation" than the labor market. He added due to solid demand and renewed labor market tightness, there are challenges in completing the "last mile" of of the inflation fight.
While Barkin dismissed the notion of a "big resurgence" in inflation, he acknowledged the "very real risk" of inflation "getting stuck".
He stated that he would be optimistic if, by Q1, inflation continued to show signs of stabilization, which would allow Fed to consider moving back to a "neutral" policy stance.
However, Barkin made it clear that "normalization comes when you're convinced that inflation hits 2%." He remains "open-minded" on how quickly rates could fall, leaving room for flexibility depending on future inflation data.
JPY Price Action Ideas: EUR/JPY, GBP/JPY and USD/JPY
- The Japanese Yen faces uncertainty due to a new PM, snap elections, and shifting market sentiment.
- Despite a strong US Dollar and GBP, the Yen saw a temporary boost from safe-haven flows amid geopolitical risks.
- USD/JPY is range-bound, with a potential breakout above 146.37 hinting at a run toward 150.00.
The Japanese Yen is going through a bumpy week with a new PM incoming, snap elections and modest safe haven gains. The list of issues facing the currency continues to expand as markets assess the monetary policy path of the incoming PM.
Comments thus far do not suggest any significant changes with incoming PM Ishiba today stating he expects monetary easing trend to stay in place. The PM also mentioned that he expects to work closely with the BoJ to overcome deflation and improve the economy.
Governor of the BoJ Kazuo Ueda who was brought in largely to facilitate a normalization in policy looks likely to continue his work without too much outside influence. At present markets are still unsure as to when the BoJ may raise rates again and this is in part responsible for recent Yen weakness.
The Yen did catch a bid on Tuesday as heightened geopolitical risks saw a flood into haven assets as the risk-off mood began to take hold. However, today we are seeing a strong US Dollar and GBP in particular which has pushed yen pairs higher on the day.
Economic Data Ahead
On the economic data front there is nothing major expected this week from Japan, EU or the UK. The biggest data release is the NFP and jobs report on Friday out of the US which could affect USD/JPY but could also have a knock on effect on overall market sentiment.
Beyond that it is key to keep an eye on developments in the Middle East. Any changes could see a flood into safe havens once more which could work in the Yens favor, even if it only proves to be temporary.
Technical Analysis
USD/JPY
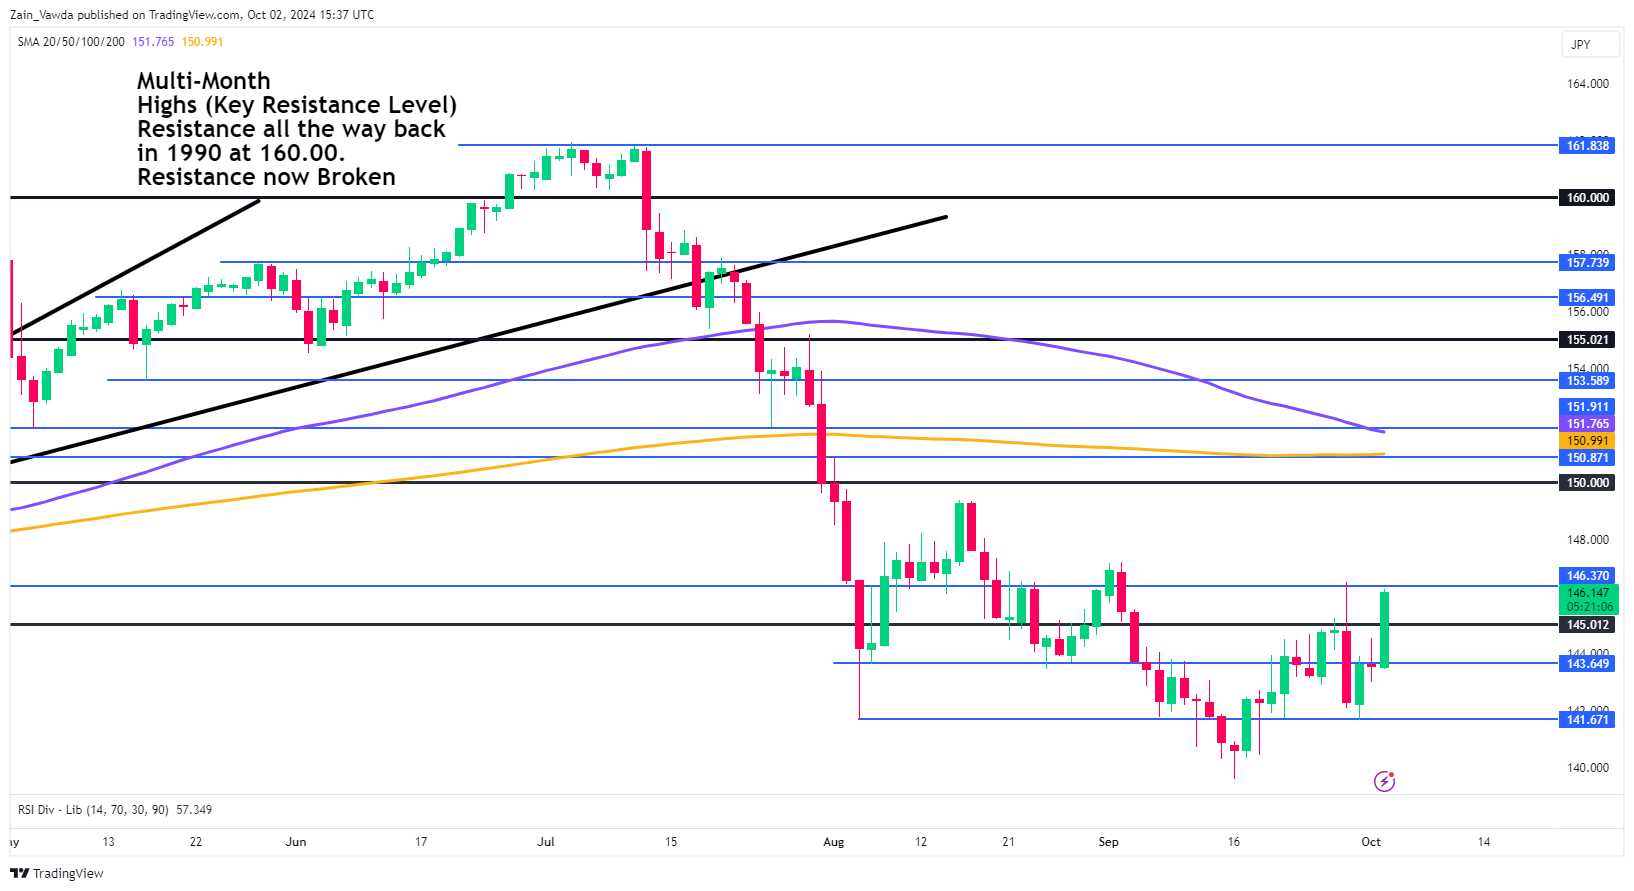
The USD/JPY pair has been hovering in a range of about 500 pips for the last 8 trading days. The return of USD strength has helped the pair stave off a retest of the psychological 140.00 handle.
At the time of writing USDJPY is eyeing a candle close above a key resistance area which could open up a run toward the 150.00 psychological mark. A rejection at the 146.37 handle could however lead to a push toward the most recent lows.
On the daily timeframe price action is messy as well with a higher high followed by a lower low and change in structure. A daily candle close above the 145.00 is enough to see another change in structure which would suggest that favor currently rests with the bulls.
Support
- 145.00
- 143.65
- 141.67
Resistance
- 146.37
- 147.20
- 150.00
USD/JPY Daily Chart, October 2, 2024
Source: TradingView.com (click to enlarge)
GBP/JPY
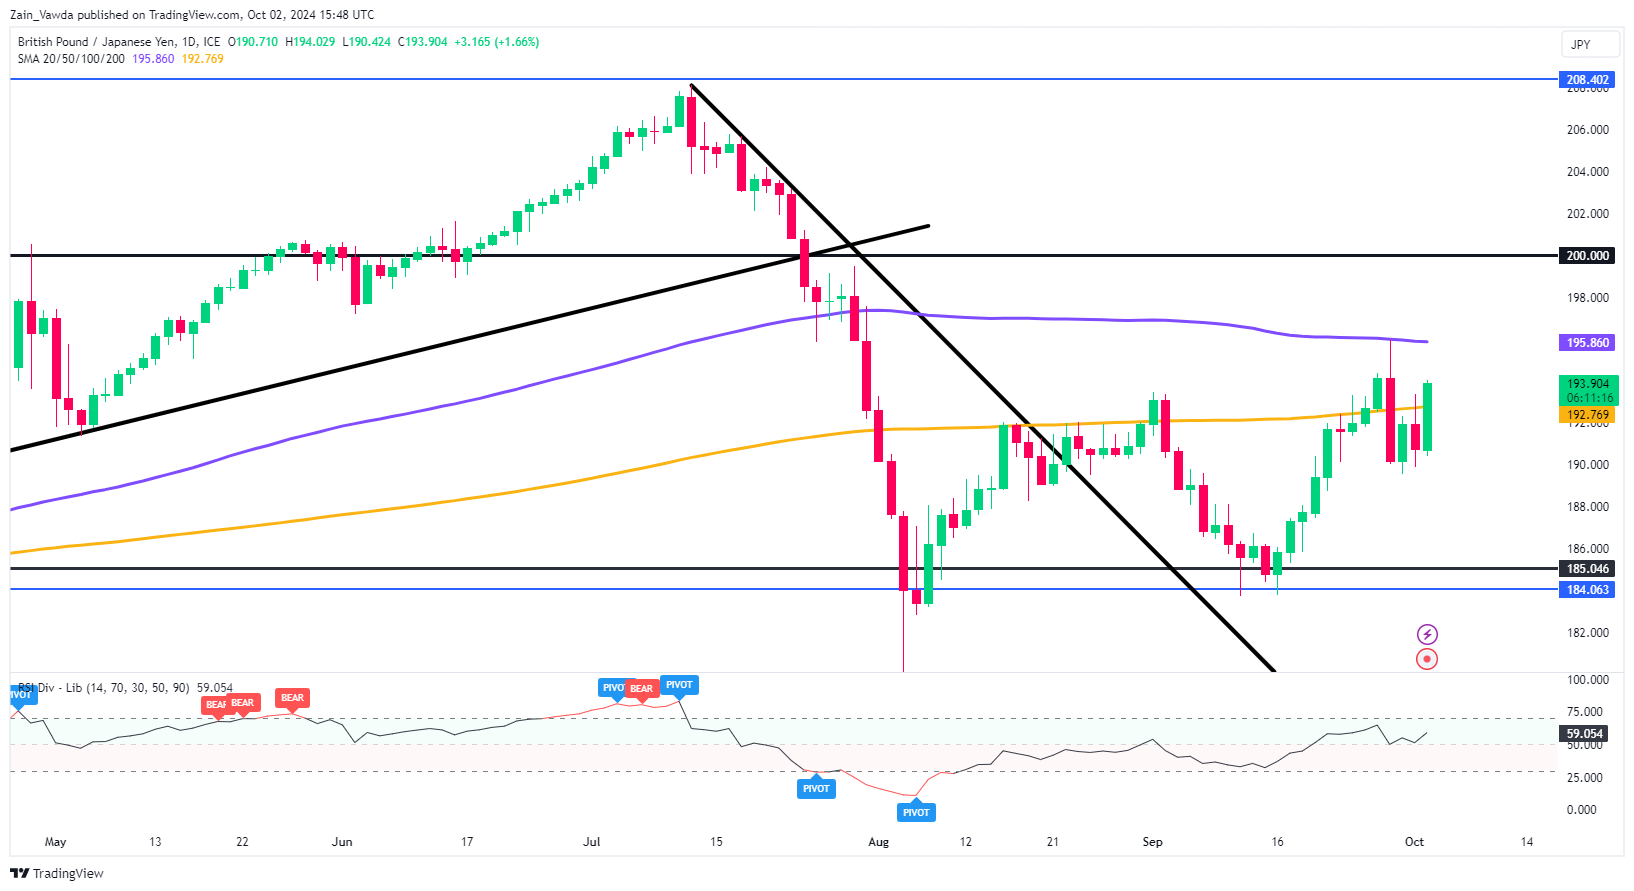
GBP/JPY is at a key confluence area which could help define the upcoming price action for the pair. Having been stuck in a range since Monday it was nice to see a bit of GBP strength return and push the GBP/JPY to closer to the 200.00 psychological mark.
Immediate resistance rests at 195.859 which is provided by the 100-day MA. A break beyond this level opens up a potential run toward 200.00.
GBP/JPY Daily Chart, October 2, 2024
Source: TradingView.com (click to enlarge)
Support
- 192.77
- 190.00
- 185.00
Resistance
- 195.86
- 198.00
- 200.00
EUR/JPY
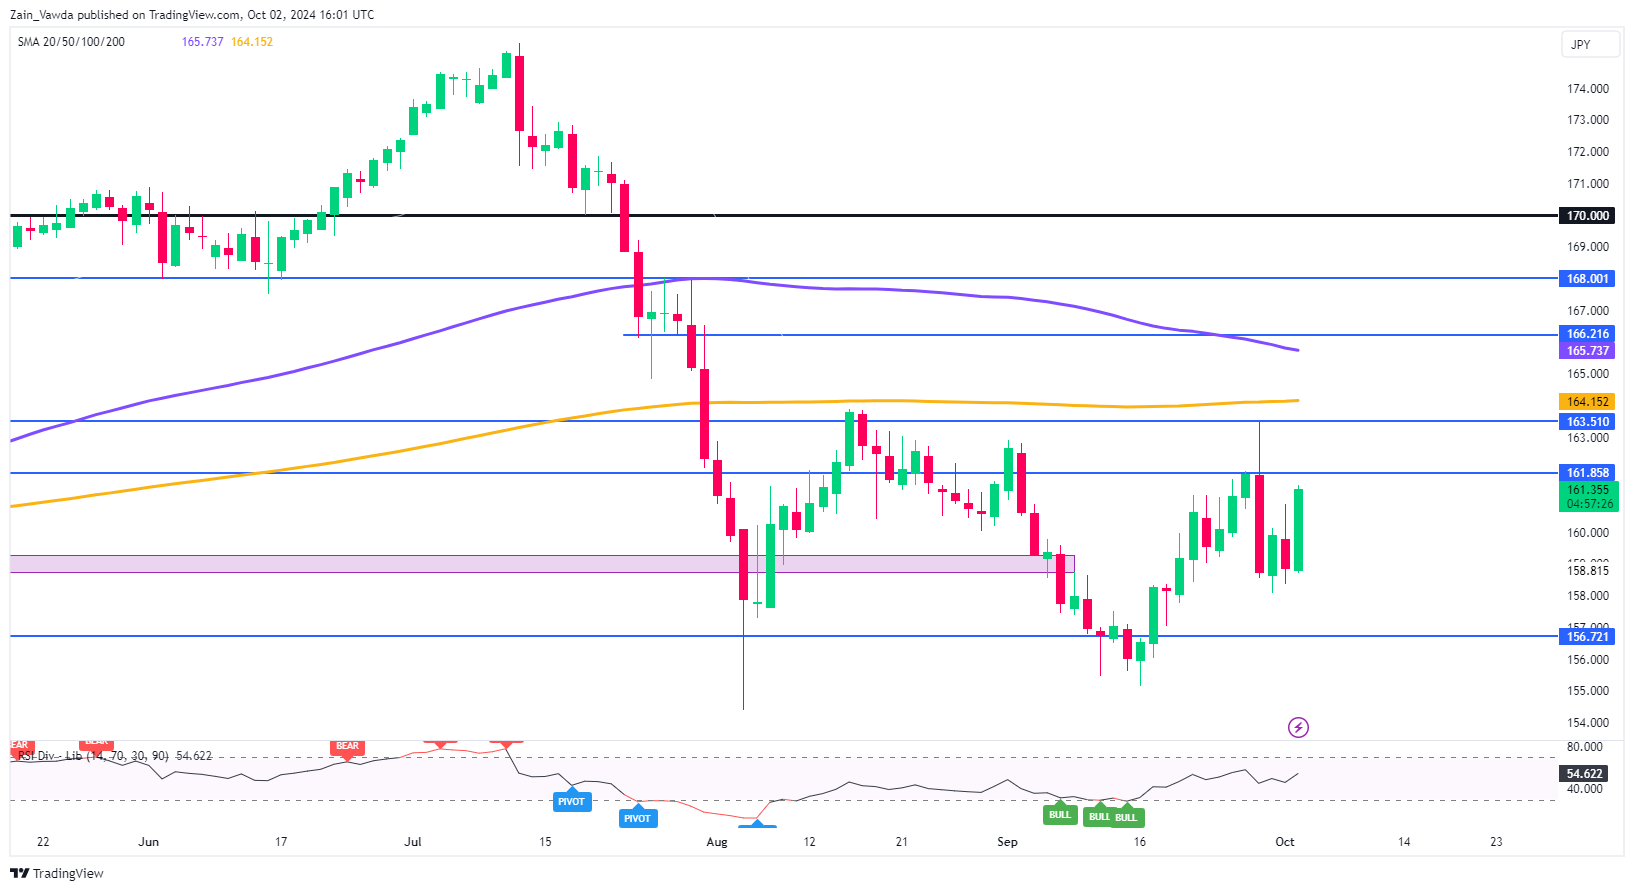
The EUR/JPY is almost identical in terms of price action to the GBP/JPY. The increasing rate cut bets where the ECB are concerned has failed to dampen the spirits of EUR/JPY bulls.
Technically speaking, following the significant selloff in EUR/JPY which began on July 11, EUR/JPY has yet to retrace even 50% of that move.
This means room for a deeper recovery remains in EUR/JPY and given the lack of data expected out this week we could very well get a continuation of the recent bullish price action.
Immediate resistance rests at 161.85 with a break higher facing a key confluence zone around the 163.50-164.00 handles.
EUR/JPY Daily Chart, October 2, 2024
Source: TradingView.com (click to enlarge)
Support
- 160.00
- 158.00
- 156.72
Resistance
- 161.85
- 163.50
- 165.00
WTI Wave Analysis
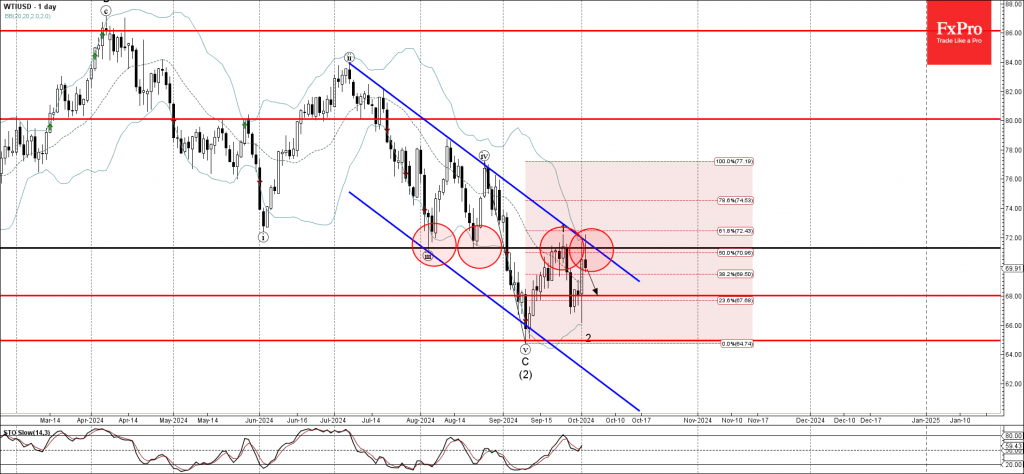
- WTI reversed from pivotal resistance level 71.30
- Likely to fall to support level 68.00
WTI crude oil recently reversed down from the pivotal resistance level 71.30 (former double bottom from August) intersecting with the upper daily Bollinger Band and the resistance trendline of the daily down channel from July.
The downward reversal from the resistance level 71.30 is likely to form the daily Japanese candlesticks reversal pattern Shooting Star.
Given the clear daily downtrend, WTI crude oil can be expected to fall further to the next support level 68.00.
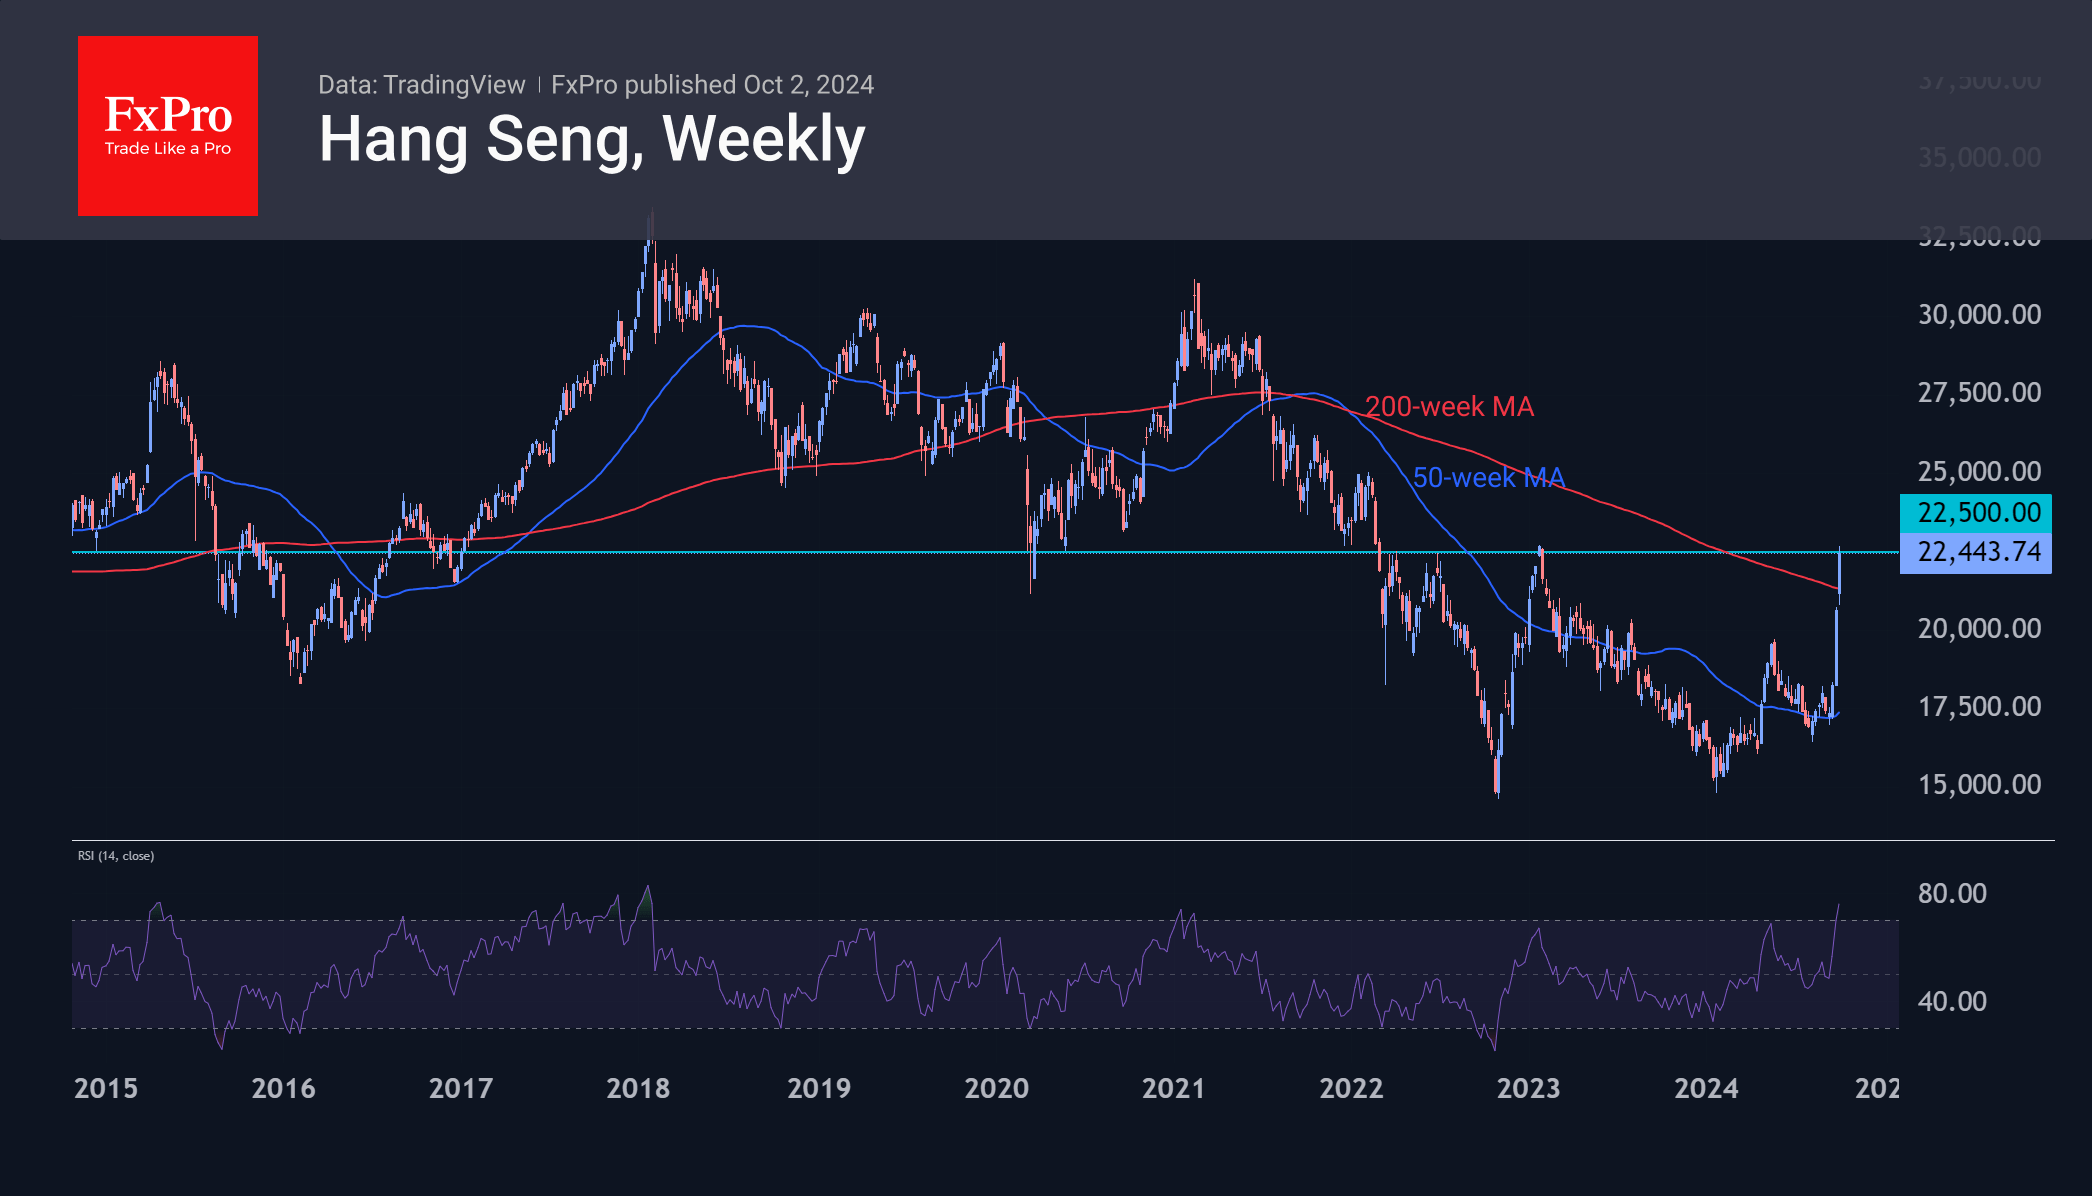
Hang Seng Is Too Hot Now, but Long-Term Attractive
The Chinese stock market is closed for a national holiday, but futures and ETFs are trading and are on another strong run today. The Hang Seng Index is up 9.6% from its close on 30 September (there was no trading on Tuesday), the second strongest rise since the surge on 16 March 2022. Then it rebounded after a setback, but now it is an acceleration of the rally, taking the index cumulatively up 34% from the 11 September lows.
Wednesday’s rally is the result of a short squeeze, as it comes at the close of the main Chinese markets and is not fuelled by optimism on global exchanges. On the contrary, global markets have moved away from risk in recent days, and the S&P 500 has been trading near the top for almost a week.
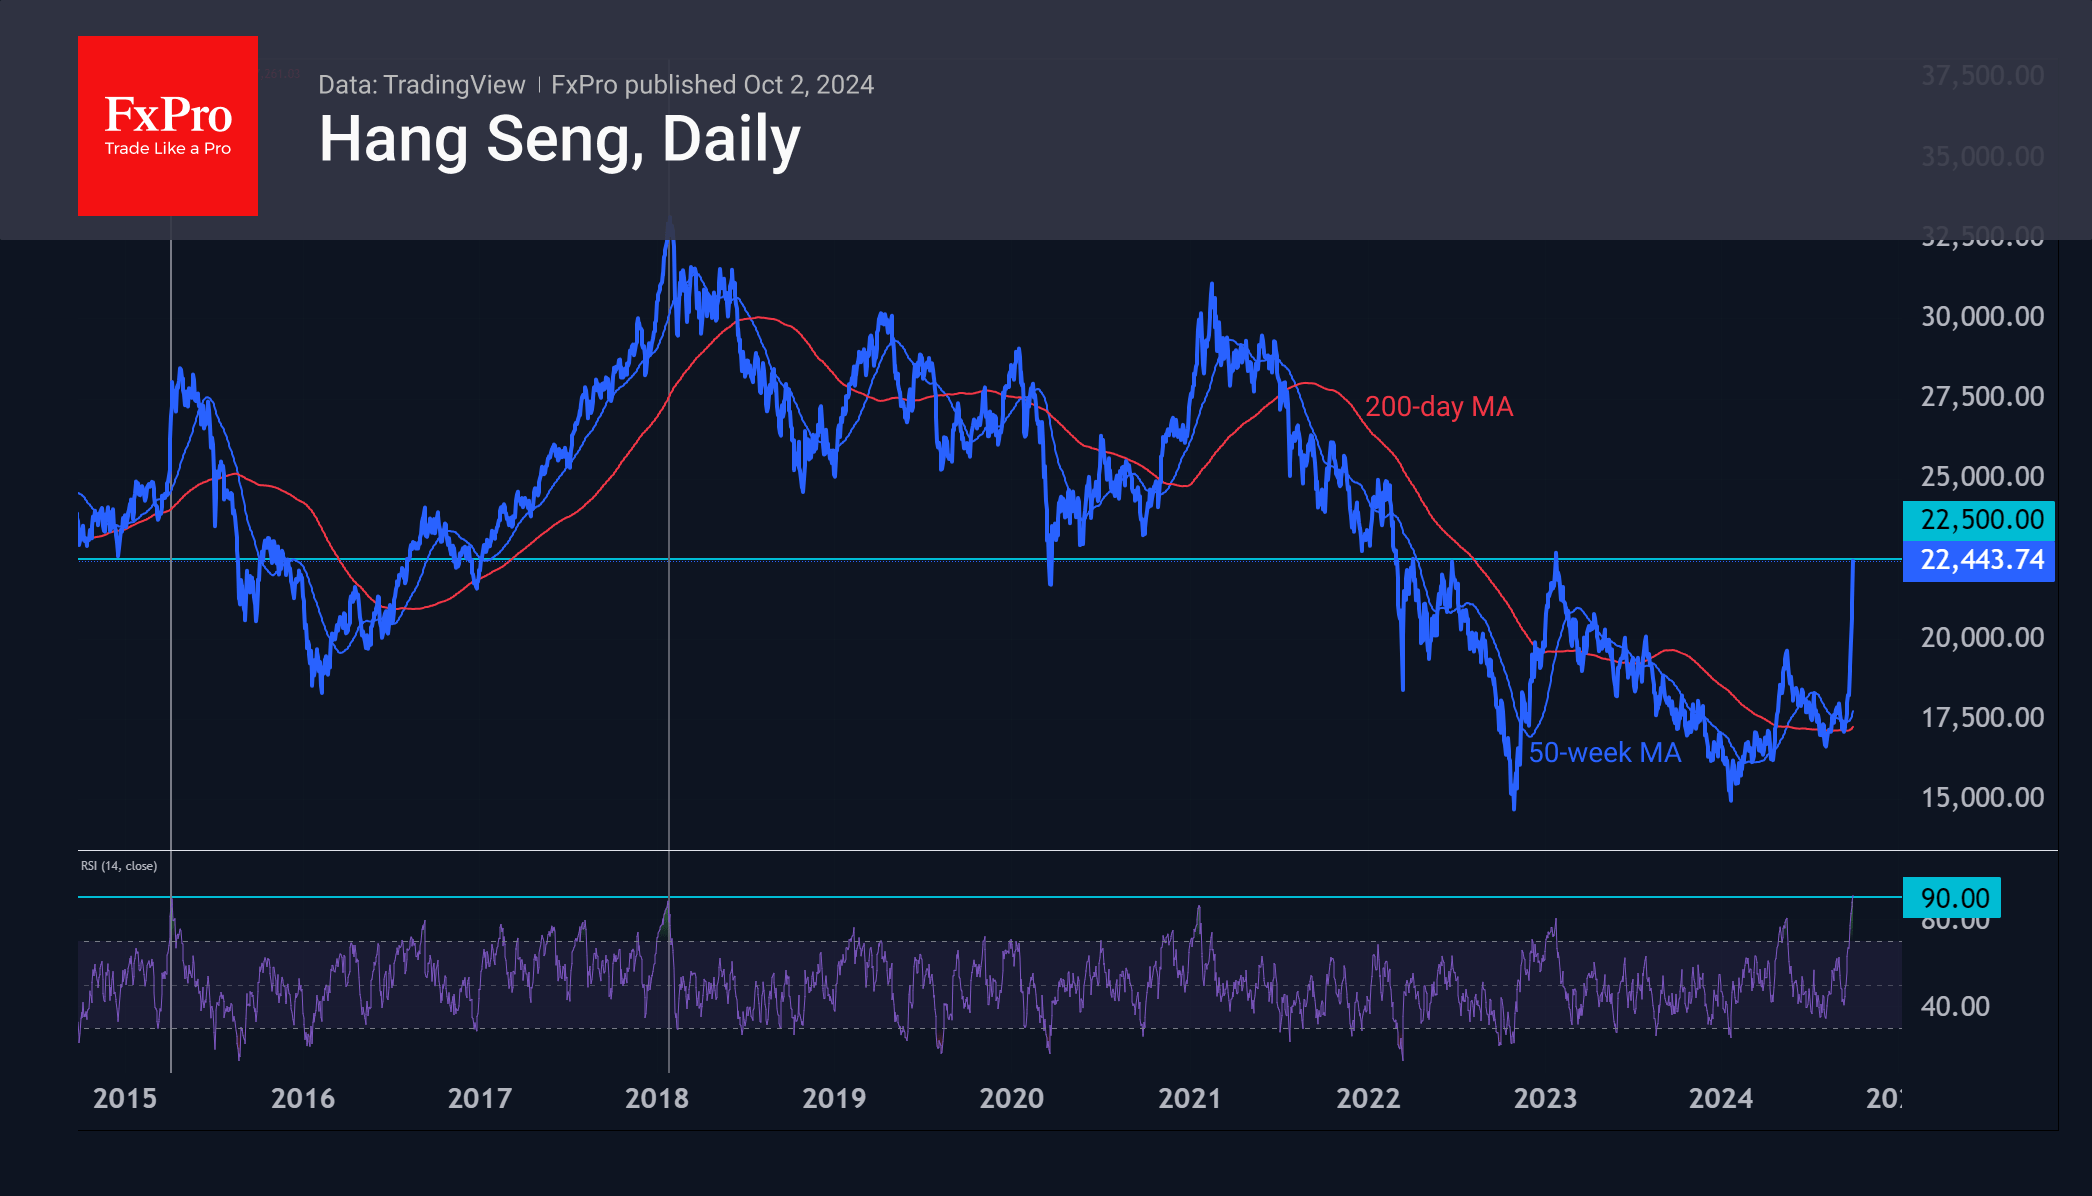
On a daily timeframe, RSI is approaching 91, the highest reading since 1987. The market was almost as hot in recent years in January 2018 and April 2015. In both cases, it fell for almost a year.
While this is a different case, and the multi-year sell-off in Chinese equities should be considered, the current overbought situation on daily timeframes could still be a good reason to shake out positions locally when the major Chinese markets open on 8 October.
Moreover, at current levels, the Hang Seng is approaching the 22500-resistance area, which has been in place since March 2022, and this will strengthen the resistance to growth in the short term.
However, one cannot overlook the more global picture emerging on the weekly timeframe. This week, the price has broken above the 200-week moving average after retreating from the 50-week average in early September.
This could potentially attract more capital and provide fuel for further upside. The RSI is also moving into overbought territory (above 70), but past examples suggest further upside, and a sharp drop to levels below 70 should be seen as a correction signal.
In the long term, a successful break of 22500 would open the door to 25000 and on to 30000, where we have seen major portfolio corrections in the past.