
Sample Category Title
USDJPY Pauses, But This is Temporary
The USDJPY pair halted its decline around 142.98 on Monday. However, this pause in the yen’s rally should not be misleading, as it comes amid uncertainty surrounding the extent of the anticipated monetary policy easing by the US Federal Reserve. The latest US employment report provided little information for adjusting forecasts of the Fed’s interest rate trajectory. Investors must assess fresh inflation data this week before drawing any fundamental conclusions.
Over the past week, the JPY strengthened by almost 3.0% against the US dollar. The USDJPY pair dropped to its annual low amid expectations of decisive action from the Bank of Japan. The BoJ is expected to raise rates by the end of the year, which will be supported by steady economic growth, wage increases, and ongoing inflationary pressure.
If the Bank of Japan’s monetary policymakers’ projections regarding macroeconomic aspects materialise, the central bank will be ready to adjust its monetary policy parameters more actively. Meanwhile, the latest data reflected weak GDP growth in Japan in Q2. The economy expanded by only 2.9% year-on-year, compared to the preliminary estimate of 3.1%.
Technical analysis of USDJPY
On the H4 chart, USD/JPY has formed a consolidation range around the 143.43 level. Due to recent news, the range has widened upwards to 144.00 and downwards to 141.76. Today, a rise towards the 143.43 level (testing from below) is possible, followed by a decline towards 141.70. Breaking this level could signal a continuation of the trend towards 139.70, with the potential for further development towards 137.77. This scenario is technically supported by the MACD indicator, whose signal line is below zero and pointing sharply downwards.
On the H1 chart, USD/JPY completed a downward impulse towards 141.76 and a subsequent rise to 143.00. A new consolidation range has almost formed. Today, a breakout below the lower boundary of this range is likely, with the downward wave continuing towards 140.30 and potentially further towards 139.70. After reaching this level, a correction towards 143.43 is possible. This scenario is also technically supported by the Stochastic oscillator, whose signal line is above 80 and pointing sharply downwards.
Oil: Bears Pause After Last Week’s 7.3% Drop
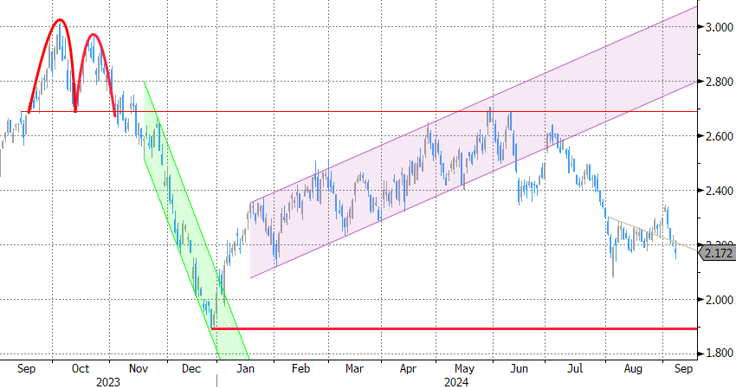
Oil price ticked higher on Monday and holding within a narrow consolidation, following 1.8% drop on Friday, sparked by disappointing US jobs data.
Mild rise in early Monday came from a partial profit taking and signals about potential hurricane system developing above US Gulf.
Larger picture shows the oil price in a downtrend which accelerated on growing fears about global demand, due to weak economic data from the US and China, two biggest oil consumers and OPEC decision to start raising output from October, which offsets impact from geopolitical tensions.
Oil price was down over 7% last week, extending the latest bear-leg off $80.14 (Aug 12 lower top) and remaining unaffected by signals of US rate cut that usually boost oil demand.
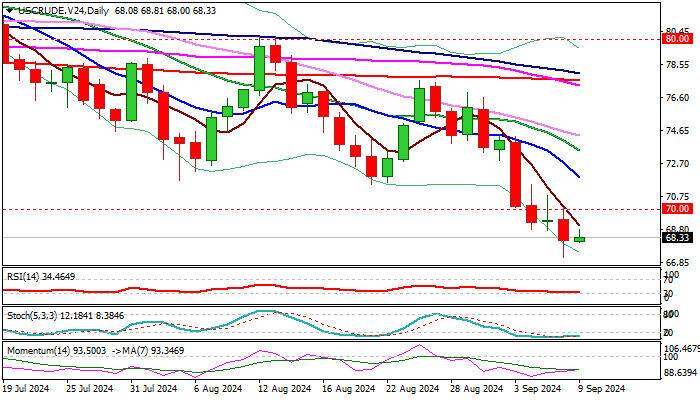
Daily technical studies are in full bearish setup and reinforced by the latest 50/200DMA death cross, but oversold conditions suggest that bears may take a breather for limited correction before larger bears resume.
Broken psychological $70 level reverted to initial resistance, followed by former double bottom at $71.46/66 (Aug 5/21 lows) reinforced by falling 10DMA ($71.90) which should ideally cap upticks and keep larger bears intact.
Res: 69.03; 70.00; 70.79; 71.66.
Sup: 68.00; 67.15; 67.00; 66.79.
Crypto: Hope for a Bottom
Market Picture
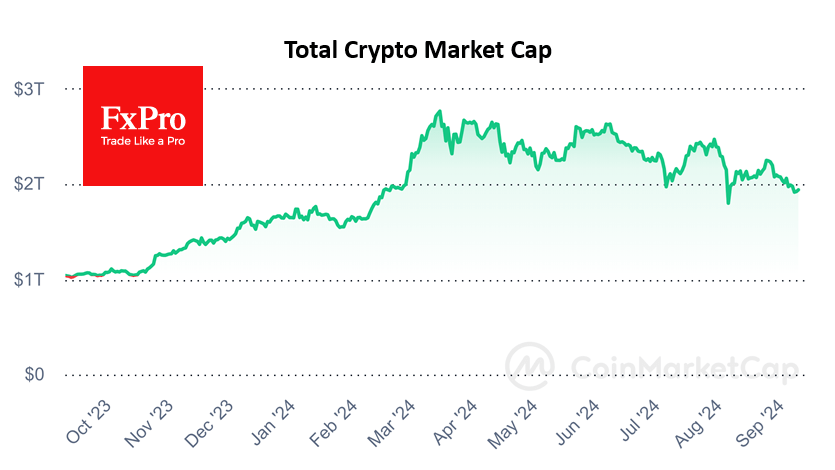
The crypto market is trying to stabilise around the $1.94 trillion mark for the third day (+0.8% in 24 hours and -4% in 7 days) after Friday’s sharp sell-off. It will soon be apparent whether support at the $2 trillion level has turned into resistance.
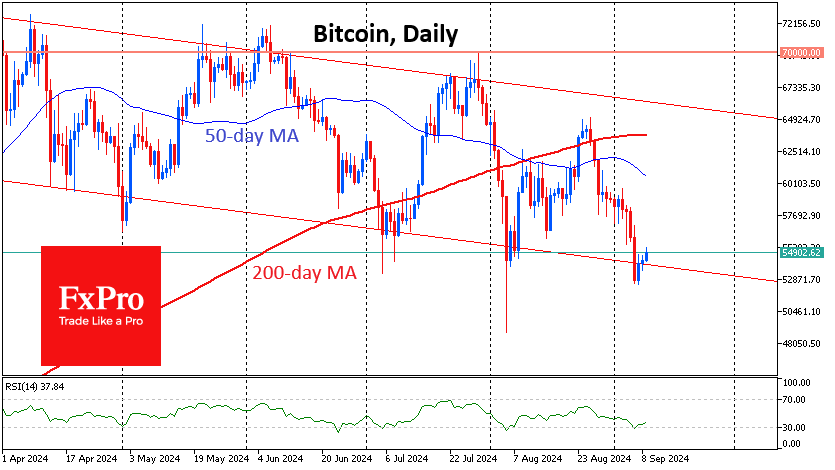
Bitcoin is trading just below $55K on Monday morning, near the bottom of the downward corridor that has been in place since March. Technical indicators are pointing to a possible bounce as the price has moved out of the oversold territory on the daily timeframe, which has preceded rallies several times over the past three months.
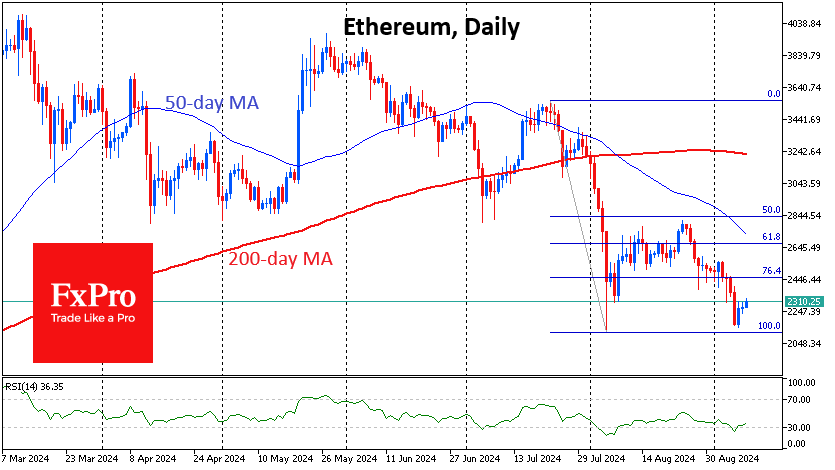
Ethereum is trading above $2300, bouncing off the August lows and not yet deepening the decline. The RSI has also moved out of the oversold territory, and the current low on the index is higher than the previous low, indicating that the intensity of the decline has eased.
News Background
According to SoSoValue, outflows from spot bitcoin ETFs in the US totalled $706.2 million last week, following outflows of $277.1 million the previous week. Since the launch of BTC ETFs in January, cumulative inflows fell to $16.89 billion (-4% for the week).
In the Ethereum ETF, outflows rose to $91 million last week, continuing the negative trend for the fourth consecutive week. Net outflows since the product launch increased to $568.3 million (+19.1% for the week).
According to CCData, Ethereum’s market depth on exchanges has fallen by 20% since the launch of spot ETFs, indicating reduced liquidity and increased sensitivity to large orders.
Pressman Film, a company known for producing films, will launch a tokenised fund to finance new projects through the Republic platform on the Avalanche network. Asset buyers will be able to become co-owners of six films. The price of Avalanche rose 7% to over $23.
Eurozone Sentix investor confidence falls to -15.4, deepening German recession concerns,
Eurozone Sentix Investor Confidence fell sharply again in September, dropping from -13.9 to -15.4, significantly below the expected -11.7. This marks the third consecutive month of declines and the lowest reading since January. The Current Situation Index also weakened, falling to -22.5, its lowest point since December 2023. Meanwhile, the Expectations Index offered a slight improvement, rising from -8.8 to -8.0, but it remains deep in negative territory.
Germany's outlook painted an even bleaker picture. Investor confidence in Europe’s largest economy plunged from -31.1 to -34.7, its lowest point since October 2022. Current Situation Index dropped significantly from -42.8 to -48.0, reaching levels not seen since June 2020. Meanwhile, Expectations Index dipped further from -18.5 to -20.3, hitting its lowest since October 2023.
Sentix analysts described the situation as increasingly dire, stating that the German economy is approaching a new "climax" in its deepening recession. The report emphasized that the recession is "raging ever stronger," with expectations continuing to fall, highlighting the "hopelessness" felt by investors.
The report also highlighted that the broader Eurozone is grappling with "dangerous recessionary tendencies," driven largely by Germany's economic struggles. The prospect of a more accommodative monetary policy is now the key hope for market participants, as the ECB is widely expected to announce another rate cut in its upcoming meeting this week.

XAU/USD Outlook: Gold Continues to Move Within Larger Range
Gold remains at the back foot at the start of the week, after Friday’s 0.8% drop and a weekly close below $2500.
The metal’s price was deflated by US labor data on Friday, as employment increased below expectations but unexpected drop in jobless rate cooled fears about stronger weakness in the labor sector, contributing to bets for Fed’s rate cut by 0.25% rather than more aggressive approach with 50 basis points cut.
Markets shift focus towards release of US inflation data for August, due later this week, which will provide more details about Fed’s decision in September’s monetary policy meeting.
On the other hand, the yellow metal remains underpinned by growing concerns about the situation in the US economy, as well as persisting geopolitical tensions, which adds to scenario of prolonged consolidation before the price resumes higher.
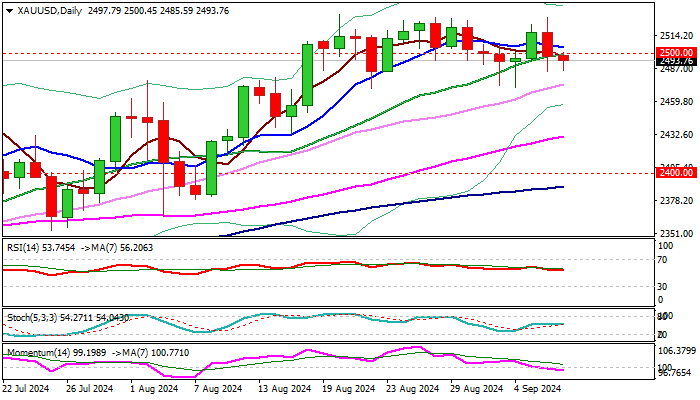
Technical picture remains bullish overall despite daily studies somewhat weakened, with larger bullish bias to stay intact while the price holds above three-week range floor at $2470 zone.
Three consecutive weekly Doji candles point to strong indecision and signal prolonged sideways mode, with mixed daily studies (14-d momentum turned negative, stochastic and RSI remain in positive territory, MA’s in mixed configuration) contributing to current picture.
Technical studies still favor scenario of $2470 pivot holding dips and offering fresh buying opportunities however, fundamentals are likely to play a key role and to gold’s key driver in the near term.
In case $2470 support is lost, stronger pullback towards $2431 (rising 55DMA) and $2400/$2390 zone (psychological / 100DMA) in extension, could be likely scenario.
Conversely, bulls may strengthen grip if the price returns and stabilizes above $2500 level and shift focus towards new all-time high at $2531, violation of which to spark fresh acceleration higher.
Res: 2500; 2505; 2523; 2531.
Sup: 2485; 2474; 2470; 2457.
News of the Week (September 9—September 13): EURJPY Market Spotlight
EURJPY is setting up for significant shifts—traders, be ready!
The EURJPY pair reflects the Euro and Japanese Yen exchange rate. Traders frequently use the EURJPY pair to gauge market risk sentiment. The Euro is primarily driven by economic indicators from major economies like Germany and France, monetary policy decisions by the European Central Bank, and geopolitical events within the Eurozone. On the other hand, the Yen is sensitive to Japan’s economic performance but is also known for its status as a safe-haven currency, meaning it often strengthens during global financial uncertainty.
Japan Gross Domestic Product (GDP) QoQ, Sep 09, 01:50 (GMT+2)
The upcoming release of Japan's quarterly GDP is forecasted to show a recovery, with an expected growth of 0.8%, compared to the previous contraction of -0.5%. If the actual GDP figure surpasses this forecast, it would indicate stronger-than-expected economic growth in Japan. A better-than-expected GDP would likely boost the Yen as confidence in Japan's economic recovery grows. And Yen's strength may lower EURJPY.
Conversely, the Yen could lose value if the GDP result is weaker than the forecast, suggesting Japan’s economic recovery is faltering. In this case, traders may move away from the Yen, causing the EURJPY pair to rise as the Euro gains relative strength.
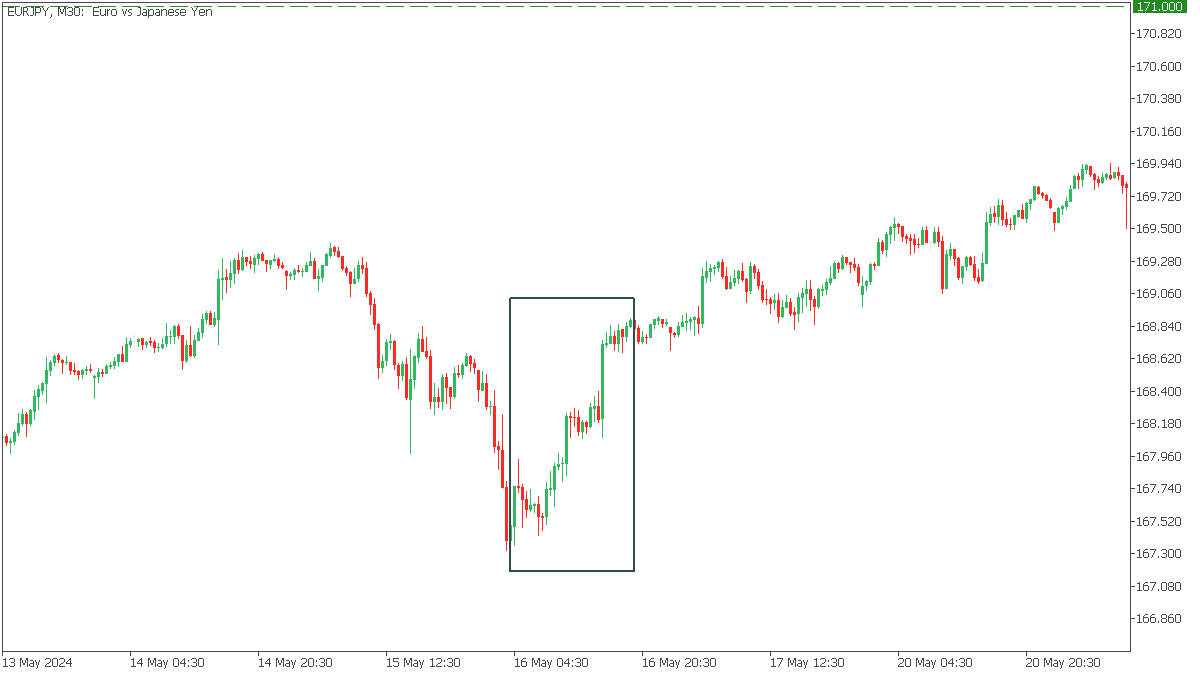
The last time the May 16, 2024, report from the GDP QoQ came in significantly worse than expected, causing EURJPY to rise!
Eurozone Interest Rate Decision, Sep 12, 14:15 (GMT+2)
The Eurozone’s interest rate decision is anticipated to result in a rate cut to 4.0% from the current 4.25%, which would signal a dovish stance from the European Central Bank. If the ECB goes ahead with the forecasted cut, the Euro might weaken as lower interest rates reduce the currency’s appeal to investors seeking higher returns. In this case, the EURJPY pair could decline.
However, if the ECB surprises the market by keeping rates unchanged, signaling concerns about inflation, the Euro could strengthen. A stronger-than-expected stance on interest rates would likely push the EURJPY pair higher.
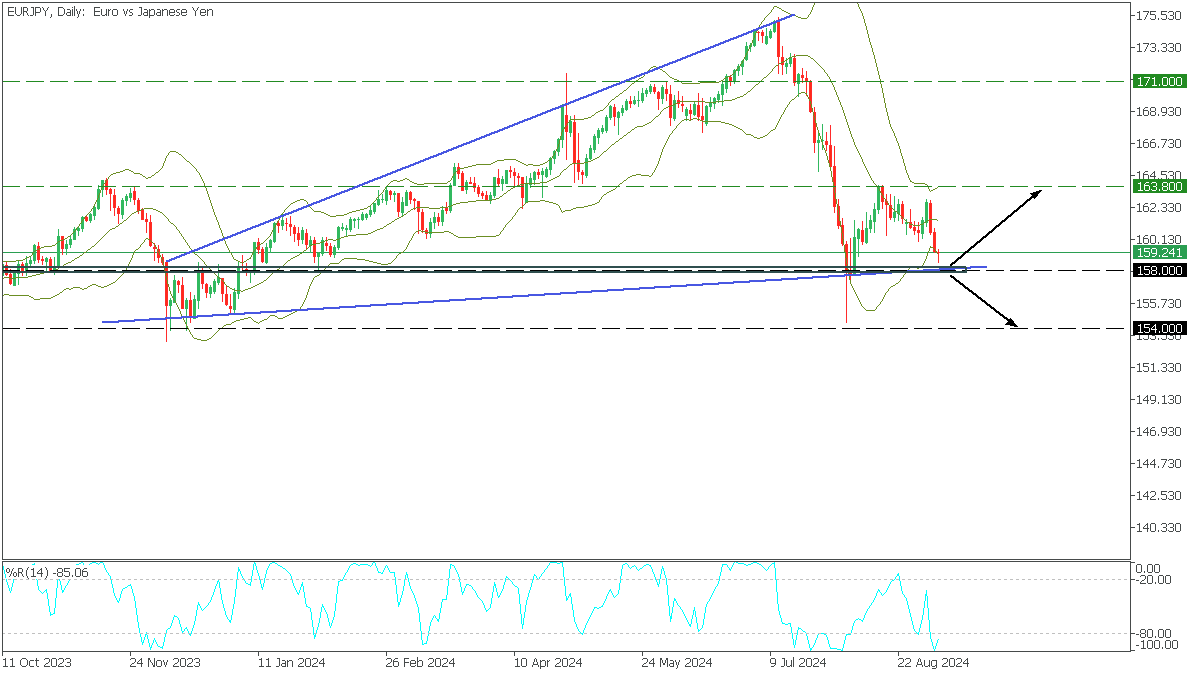
In the Daily timeframe, EURJPY formed an expanding wedge pattern after a short-term bullish rise. The price fell to the lower trend line, testing the critical support area and the lower Bollinger line. At the same time, the %R shows oversold.
- If the price breaks the lower trend line below 158,000, the downside target would be 154,000.
- A bounce from the lower trend line will bring EURJPY back to the resistance at 163.800.
Gold Weakness Might Have Legs
- Gold is trading lower today, but close to recent highs
- It failed to benefit from Friday’s negative stock market reaction
- Momentum indicators remain mixed
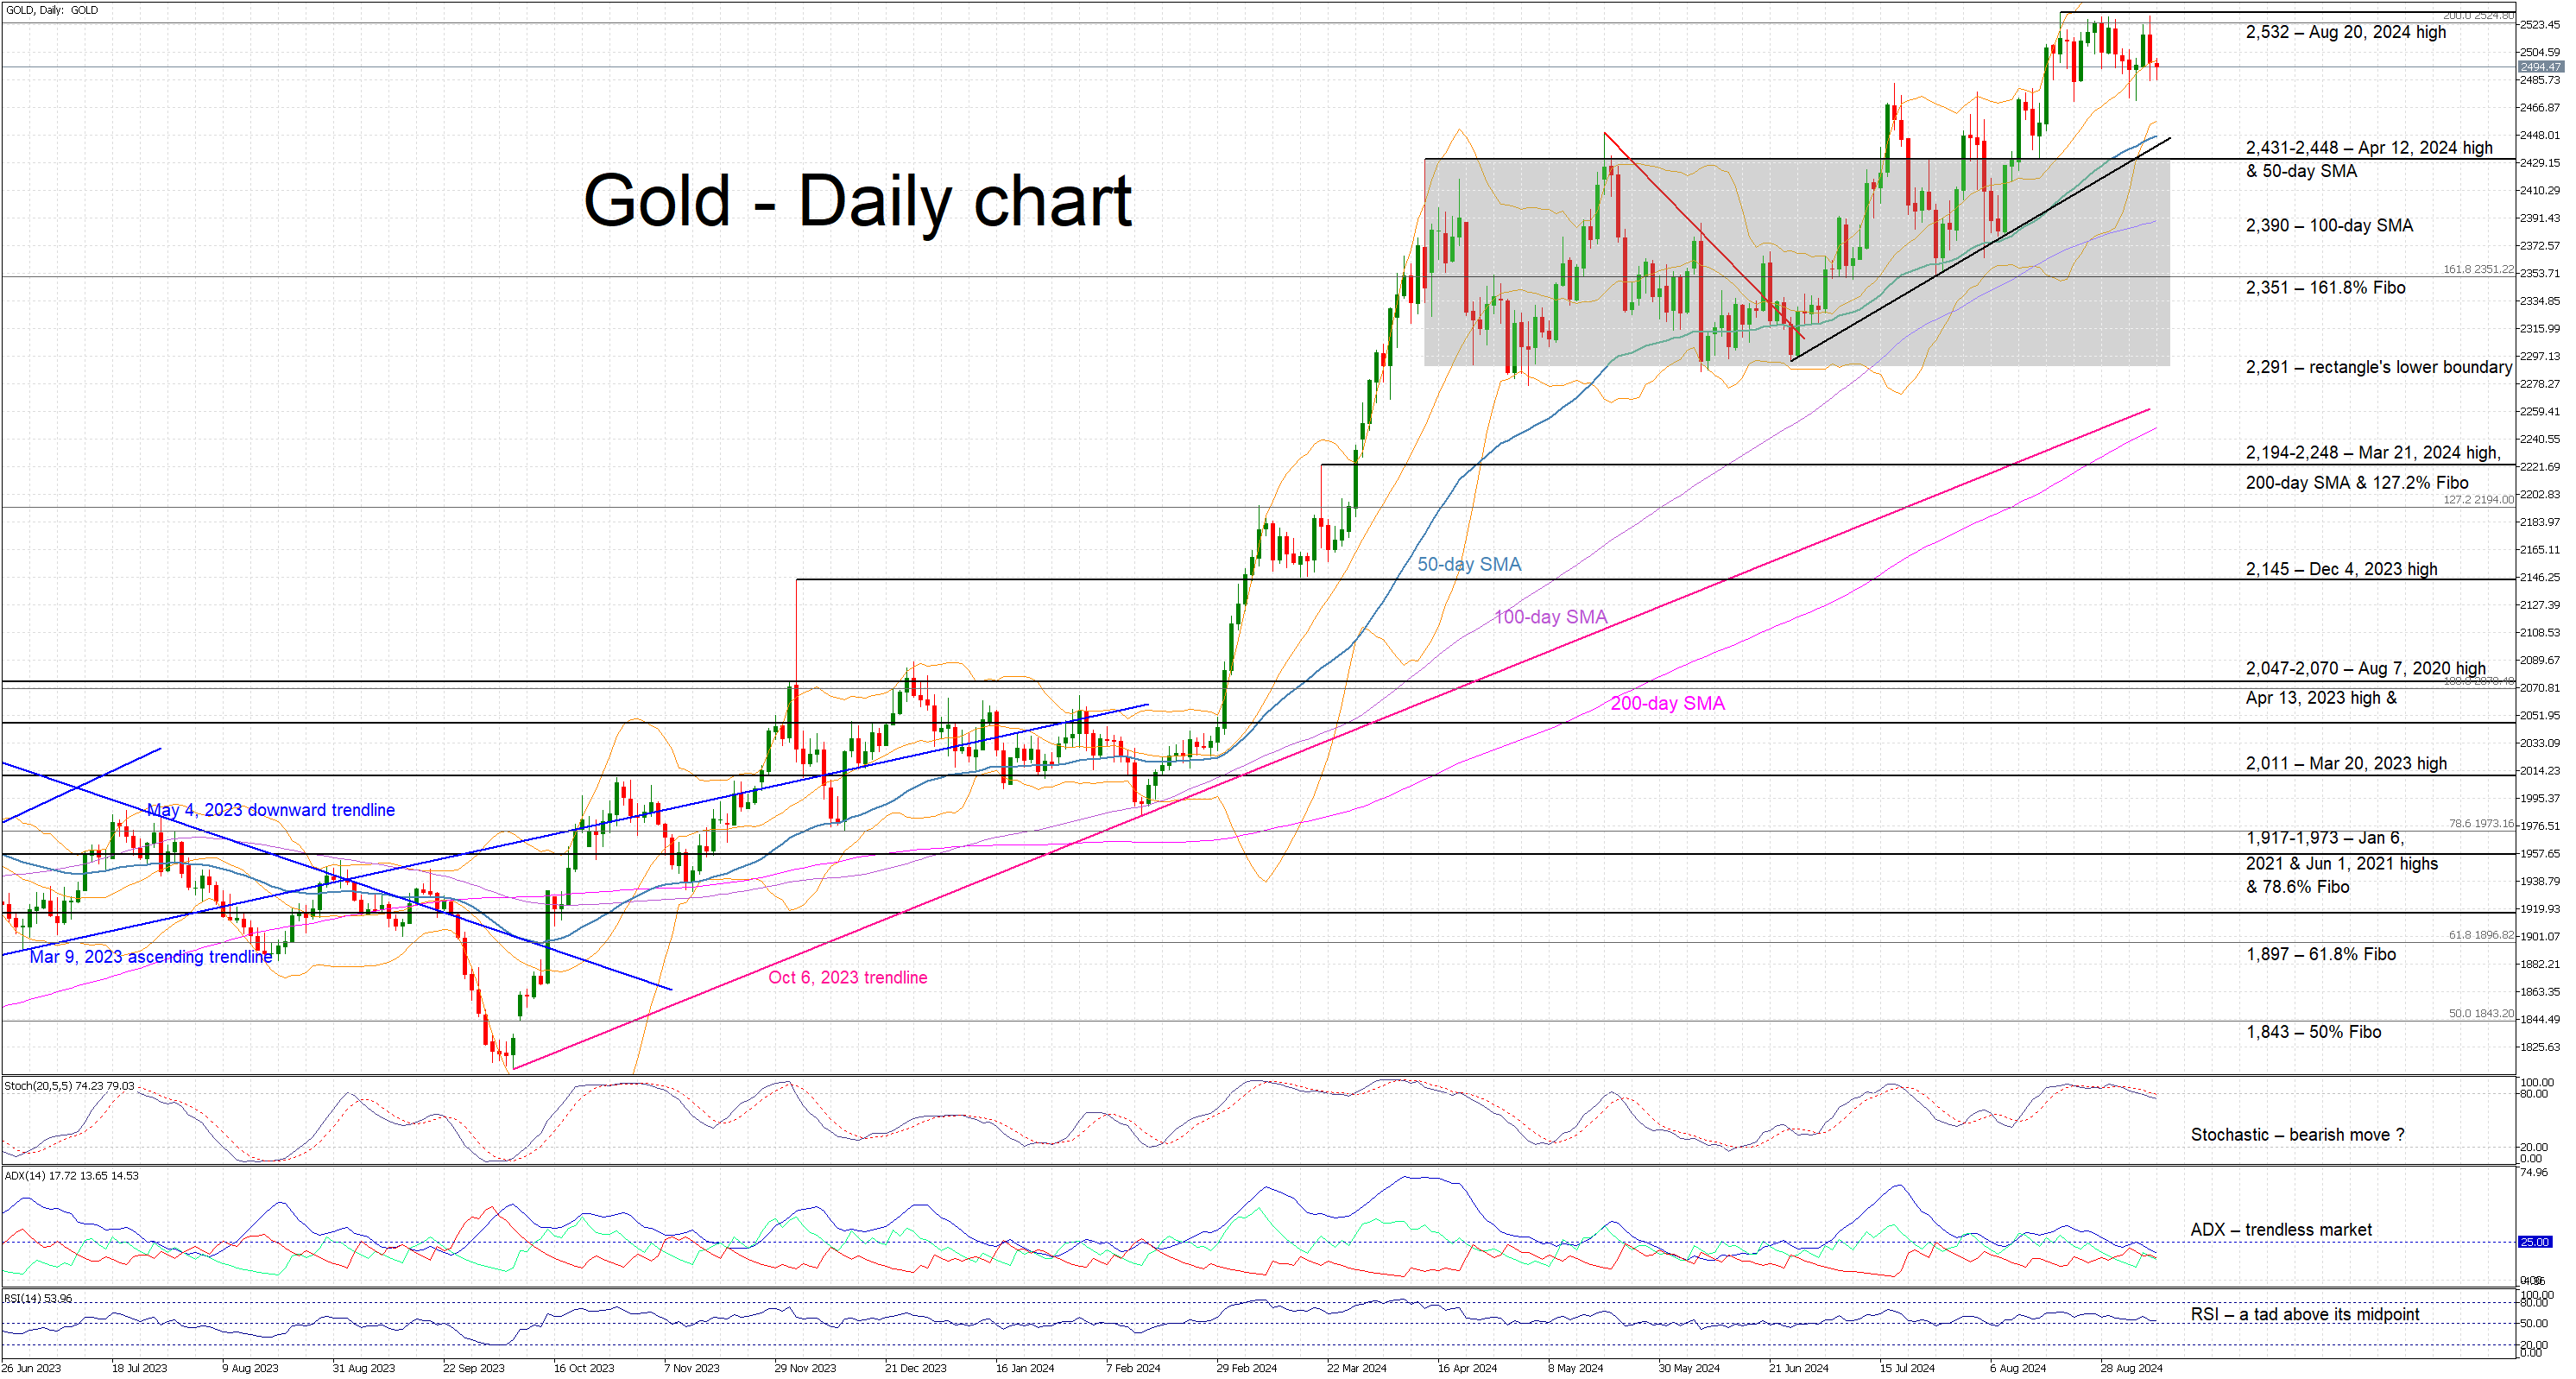
Gold is trading lower again today, recording its second consecutive red candle, but remaining a tad below its recent all-time high of $2,532. Last Friday’s non-farm payrolls figure resulted in an acute market reaction with the S&P 500 index recording its worst weekly performance since 2023, but gold failed to benefit. Similarly, developments in both the Middle East and the Ukraine-Russia conflict continue to have little impact on gold prices.
In the meantime, the momentum indicators remain mixed. The RSI remains above its midpoint but shows little appetite for a move higher. Similarly, the Average Directional Movement Index (ADX) is hovering well below its 25 midpoint, thus revealing a trendless gold market. More importantly, the stochastic oscillator has crossed below both its moving average (MA) and overbought territory, and it is currently tentatively edging lower. Should this move pick up pace, it could be seen as a strong bearish signal.
If the bulls remain confident, they could try to regain the market reins and gradually overcome the all-time high at 2,532. If successful, they would enter uncharted waters again, with the next plausible target being the 2,600 level, which coincided with the 261.8% Fibonacci extension of March 8, 2022 – September 28, 2022 downtrend.
On the flip side, the bears are keen for the current correction to accelerate. They could push gold towards the 2,431-2,448 area, which is defined by the April 12, 2024 high and the 50-day simple moving average (SMA). Even lower, the 100-day SMA and the 161.8% Fibonacci extension at 2,390 and 2,351 respectively, a tad above the lower boundary of the developing rectangle at 2,291, could really trouble the bears.
To sum up, gold is in the red again today despite the decreasing risk appetite as the market is digesting last week’s US data releases and preparing for another action-packed week.
More Volatility: Yes. More Certainty on Fed: No
Markets
More volatility: yes. More certainty on the outcome of next week’s Fed meeting: no. Friday’s nonfarm payrolls couldn’t settle the rate cut size debate (25 bps vs 50 bps). The forecasted decline in the US unemployment rate, from 4.3% to 4.2%, failed to break the real-time recession indicator (Sahm rule) that rang all the alarm bells last month (3-month moving average of unemployment rate >= 0.50 ppt of the minimum of the 3-month averages from the previous year). The overall miss in payrolls growth was mainly because of a 86k cumulative downward revision to June & July with headline August payrolls being solid (142k vs 165k consensus). Wage growth unexpectedly accelerated by 0.4% M/M to 3.8% Y/Y (from 3.6%). The front end of the US Treasury curve outperformed significantly in a first reaction. The US 2-yr yield tested the early August low at 3.65%, but data weren’t sufficiently weak to force the break going into the weekend. Early USD weakness was undone in the aftermath of the payrolls as well. Especially as US stock markets handled the data badly (-1% to -2.5%), directing some safe haven money into USD. The failed test of support in the trade-weighted greenback (100.83; Dec23 & Aug24 low) gave some technical support as well. Once the payrolls dust really settled, comments by heavyweight Fed governor Waller hit the screens. Renown for his higher-for-longer stance in Q1 of this year, he said amongst others to be open for more forceful rate cuts. Algos picked up the line resulting in a fresh rally at the front end of the US Treasury curve, this time with a new cycle low for the US 2-yr yield around 3.60%. Some nuances are needed though. Waller is ready to act quickly and forcefully (referring to 75 bps rate hikes in inflation battle) should there be a significant deterioration in the labour market. Waller backs a September rate cut, be it with a careful start. So markets kind of overdid it on the first headlines with the US 2-yr yield rebound towards 3.70% this morning.
Today’s eco calendar is uneventful. Wednesday’s US CPI and Thursday’s ECB meeting grab attention later this week. We keep a close eye on risk sentiment following Friday’s nasty losses. More of the same on global growth slowdown worries could help USD find a short term bottom. From a momentum perspective, the jury is out whether such setting could lift core bonds further ahead of key central bank meetings. Both the US and European curves are close to key support levels across all tenors.
News & Views
Chinese consumer prices once again underwhelmed, highlighting an ongoing sluggish domestic demand and underscoring the need for more drastic supportive government measures. CPI rose a mere 0.6% y/y in August, only marginally picking up from July’s 0.5%. It was less than the 0.7% expected and heavily skewed to the upside by food prices (2.8% y/y). Excluding the latter, non-food CPI was barely positive (0.2% y/y). Core inflation (ex. food & energy) came in at 0.3%, slowing from the 0.4% in July. Services inflation amounted to 0.7%, also less than in the month before. A very weak PPI suggests there is little improvement ahead. Factory gate inflation fell a steep -1.8% y/y (-1.5% expected), accelerating the trip into deflation from the -0.8% in July. Food producer prices have greatly fallen in August (-1.3% from -0.7%). This will likely put one of the last remaining solidly rising CPI categories under downward pressure in the coming months. The Chinese yuan slipped straight at the open this morning. USD/CNY rose from Friday’s close sub 7.10 to 7.112 currently.
France has asked the European Commission for more time to submit its debt and deficit reduction plans, both the Financial Times and Bloomberg reported over the weekend. Such an extension beyond September 20 is foreseen in the rules with one EU official anticipating the submission by mid-October, alongside the draft 2025 budget. The request comes after the recent appointment of former Brexit negotiator Michel Barnier as the country’s new prime minister in the wake of the June elections. Those produced a hung parliament with a lot of ideological divide. The 2025 budget will be presented to parliament for debate by October 1 and its approval won’t come easy. The excessive debt procedure that France has been put in by the EC requires the country to bring debt on a sustainable path down through controlling its deficits. Documents last week, however, showed France’s budget gap at risk to rise from 5.5% in 2023 to 5.6% this year instead of government forecasts projecting a decline to 5.1%.
Graphs
GE 10y yield
The ECB cut policy rates by 25 bps in June. Stubborn inflation (core, services) make follow-up moves less evident. Markets nevertheless price in two to three more cuts for 2024 as disappointing US and unconvincing EMU activity data rolled in, dragging the long end of the curve down. The move accelerated during the early August market meltdown.
US 10y yield
The Fed in its July meeting paved the way for a first cut in September. It turned attentive to risks to the both sides of its dual mandate as the economy is moving to a better in to balance. The pivot weakened the technical picture in US yields. A string of weak eco data and a risk-off market climate pushed and kept the 10-yr sub 4%. We think we could be up to three 50 bps rate cuts this year.
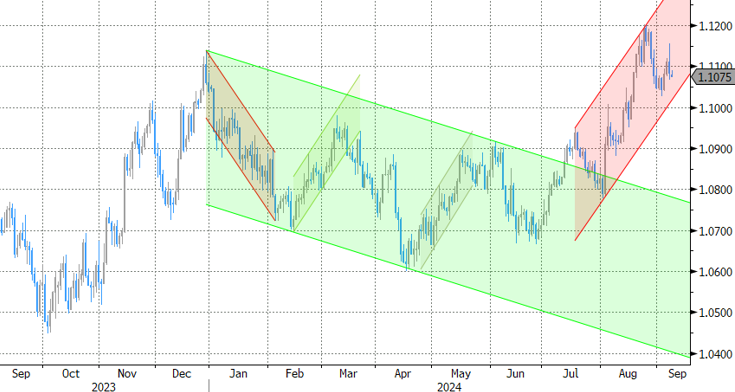
EUR/USD
EUR/USD moved above the 1.09 resistance area as the dollar lost interest rate support at stealth pace. US recession risks and bets on fast and large rate cuts trumped traditional safe haven flows into USD. EUR/USD 1.1276 (2023 top) serves as next technical references.
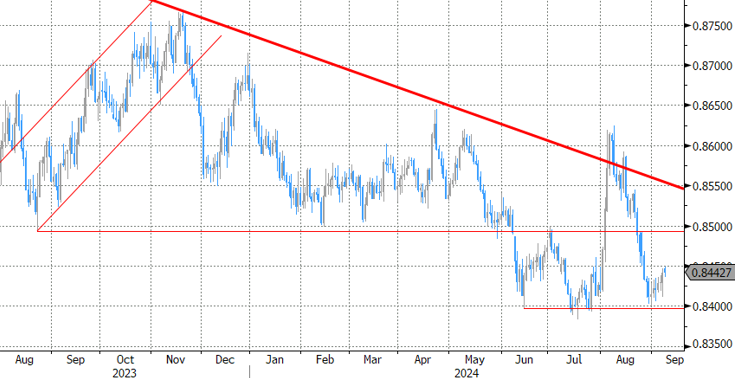
EUR/GBP
The BoE delivered a hawkish cut in August. Policy restrictiveness will be further unwound gradually on a pace determined by a broad range of data. The strategy similar to the ECB’s balances out EUR/GBP in a monetary perspective. Recent better UK activity data and a cautious assessment of BoE’s Bailey at Jackson Hole are pushing EUR/GBP lower in the 0.84/0.086 range.
Low Spirits
Last week ended on an ugly note, really, as the jobs data from the US revealed throughout the week was weak, but maybe not weak enough to tilt the Federal Reserve (Fed) expectations toward a clear direction. Job openings fell more than expected, and Friday’s official data showed that hirings rebounded in August, though not as much as pencilled in by analysts. The US economy added a 142K new nonfarm jobs, last month’s ugly figure was further revised down by 25K jobs, but the wages grew faster than expected and the unemployment rate fell from 4.3% to 4.2%, as expected. As such, the data sure pointed that the Fed will cut in September, but the pricing of a 50bp cut fell to 29%, from around 40% before the release of the jobs data. The US 2-year yield tipped a toe below 3.60% but rebounded, the 10-year jumped to 3.74%, the 2 to 10-year portion of the curve is no longer inverted and the US dollar index is better bid since the data on expectation that the Fed will cut, but not in a hurry and probably not by big chunks.
In equities, the Dow Jones fell 1%, the S&P500 lost 1.73% on Friday, and recorded its worst week since March while Nasdaq 100 was the most hit, by an almost 2.70% drop in just one session. Roundhill’s Magnificent 7 ETF fell nearly 3.90% on Friday, and Broadcom – which announced better-than-expected earnings but a slightly lower than expected forecast paid the price of that unpleasant forecast with a 10% drop in its stock price. Rough. And oh, the USDJPY - where the unwinding of the carry trades tend to amplify the risk selloff – fell to the lowest levels since August and the pair is consolidating below the 143 level this morning.
Weak data from Asia
And if all this is not enough, the data released in the earliest hours of this week pointed that the Japanese economy recovered slower-than-expected but that the price pressures remained higher than expected in Q2, and that inflation in China came in below estimates as well, not helping to relieve the growing tensions about China and its sputtering economy. The Nikkei index is down by more than 0.60% at the time of writing and China’s CSI 300 is down by more than 1%.
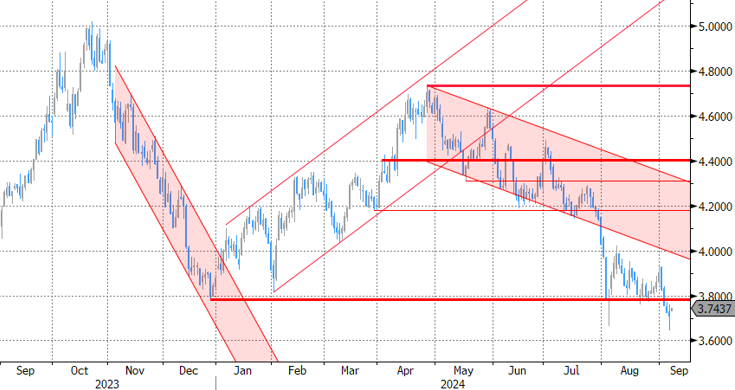
US crude fell 1.75% on the back of the mixed US jobs data on Friday, closed last week below the $70pb psychological level and remained under pressure this morning on further bad news from China. Copper futures – which are considered a gauge of global economic health - consolidate below the 200-DMA.
Good news is, US futures are in the positive, hinting that we could see a small rebound after last week’s heavy selloff.
The week ahead
This week, attention will shift to the latest CPI update from the US – and the European Central Bank (ECB) meeting. But before all that, Apple will be revealing its latest iPhones, Airpods, Apple Watch and Apple Intelligence – a new and much anticipated AI toolkit – as soon as today. And AI investors are not in their best mood to see the glass half full.
Coming back to the economic matters, the US CPI data is due Wednesday, and is expected to show a further slowdown in the US headline inflation to 2.6% in August, from 2.9% printed a month earlier. A sufficiently soft data will keep the expectation of Fed cuts on the table, but won’t move mountains, unless we see a big surprise to the upside – in which case the Fed cut expectations could take a hit. As the Fed’s Waller said ‘the balance of risks has shifted toward the employment side of [their] dual market’.
For the ECB, the expectations are pretty clear. The ECB is expected to announce a 25bp cut when it meets this Thursday, but what will happen next is not clear. The Eurozone inflation has been slowing, along with growth. Released Friday, the GDP data pointed at a softer-than-expected growth in Q2 due to a prolonged weakness in the zone’s manufacturing sector, especially in Germany. Meanwhile, the wages growth also eased – a good thing for the dovish ECB expectations. Frankly, given the level of dovish Fed expectations, the ECB doves have room to increase their own dovish bets. The EURUSD, near 1.1075, looks like it could give back some advance if the ECB officials give signs this week that the progress in the inflation battle has been satisfactory enough to ease more. But what makes the euro doves more cautious than the Fed’s is that the Fed has a dual mandate – they must care about the price pressures but also about the health of the economy and the jobs market. But the ECB has a single mandate, and that’s maintaining price stability. Therefore, the ECB may not let itself seduce by faster rate cuts if the European officials think that there is the slightest chance that inflation could pick up momentum in the next few months.
An Eventful Week Ahead
In focus today
In the euro area, we receive the Sentix investor confidence indicator, which is the first indicator of investor sentiment in September.
Overnight, Chinese trade data for August is released. While exports recovered during H1, momentum has faded due to a weaker global manufacturing sector. Hence, one of China's few growth drivers in H1 is losing speed again leaving few engines of growth apart from stimulus-driven investments.
The remainder of the week will be eventful. Kamala Harris and Donald Trump will have their first debate Tuesday evening (US time), while US August CPI is due on Wednesday. On Thursday, the ECB will hold their September meeting, and Swedish CPI is released in the morning.
Economic and market news
What happened overnight
In China, August inflation data showed CPI at 0.6% y/y, somewhat below expectations of 0.7% amid higher food prices due to weather disruptions. Core inflation fell to 0.3% in August from 0.4% in July, indicating weak demand. PPI was lower than expected at -1.8% y/y (cons: -1.4%) - largely due to lower commodity prices. Overall, the readings highlight how China is a disinflationary force for global inflation.
In Japan, Q2 GDP growth was revised down to 2.9% annualised from 3.1%, corresponding to 0.7% q/q SA from 0.8%. The adjustments were driven by lower corporate and personal spending.
What happened since Friday
In the US, nonfarm payrolls were lower than expected at 142k (cons: 160k), while the two prior months were revised down by 86k. The unemployment rate ticked somewhat lower to 4.2%, and wage growth was slightly higher than expected at 0.4% m/m SA (3.8% y/y). Overall, the August Jobs Report corroborated the gradual easing trend seen in labour markets. After the release, NY Fed President Williams acknowledged that it is time to cut rates, while Fed Governor Waller stated that he could support consecutive cuts or even larger ones if the data warrants it. Chicago Fed President Goolsbee, who has advocated for rate cuts for months, emphasized a data-driven approach to policy decisions. While we expect a 25bp rate cut in September, markets are currently pricing in a 33bp cut.
In the euro area, the ECB's preferred wage tracker, compensation per employee, declined to 4.33% y/y in Q2 from 4.76% y/y in Q1 - lower than the staff projections from June, which estimated an increase to 5.1%. Hence, the reading is good news for the ECB, reflecting abating underlying price pressure. That said, the level remains high, while more timely indicators also showed an uptick in July. As such, we project the ECB to remain cautious on the outlook. For the meeting on Thursday, we expect a 25bp rate cut, followed by quarterly rate cuts until Q3 2025.
In Germany, industrial production declined 2.4% m/m SA (-5.3% y/y) in July after rising 1.7% in June, reaching the lowest level since Covid. The German economy clearly remains the weak spot of the euro area, and we expect the economy to grow just marginally in the coming quarters. Given the large industry, the economy has been particularly hit by rising interest rates, energy prices and lower global trade in the past years.
In France¸ the Finance Ministry has requested an extension from the European Commission beyond the September 20 deadline to align its deficit reduction plan with Paris' 2025 draft budget. Worsening finances have led to EU disciplinary proceedings, leaving incoming Prime Minister Michel Barnier under pressure as he is set to form a government and draft a budget by October 1, under the threat of a no-confidence vote.
Equities: Global equities were lower on Friday and significantly declined over the last week, primarily focusing on the US job market and updated recession probabilities. The developments on Friday closely matched last week's insights. Consequently, there was a widespread move away from risk across various asset classes, with gold being an exception. Last week, global equities fell by almost 4%, with cyclical sectors underperforming defensive ones by nearly 3%. VIX increased from 16 to 22, minimum volatility outstripped momentum by 8%, and the tech sector dropping more than 7% while utilities and consumer staples ended slightly higher. In the US on Friday: Dow -1.0%, S&P 500 -1.7%, Nasdaq -2.6%, and Russell 2000 -1.9%. Asian markets are broadly lower this morning, while US and European equities are higher.
FI: Global bonds rallied on Friday following the US jobs report, which came in to the soft side in terms of job creation and revisions. However, the initial reaction quickly faded, as neither Williams nor Waller provided any clear guidance on the outlook for the September decision following the release. This week's CPI data may play a crucial role in determining whether the Fed opts for a 25bp or 50bp rate adjustment. The 2s10s UST curve bull-steepened some 8bp through the session, as the 2Y yield declined by 10bp. Markets are currently pricing in a 33bp cut for the upcoming September FOMC meeting, and the anticipation of rate cuts by year-end has increased by 9bp to 119bp following the NFP data. Additionally, rate cut expectations for the ECB have also risen, now projected at 175bp by the end of 2025, up from 166bp at the close on Thursday.
FX: The end to last week saw cyclically sensitive currencies come under pressure as post non-farm markets volatility entailed risk trading heavy and energy prices move lower. Especially NOK had a poor end to the week with EUR/NOK moving 10 figures higher back close to 11.90; also EUR/SEK moved 6 figures higher. EUR/USD did remarkably little while the JPY gained on the broader cross asset moves.