Sample Category Title
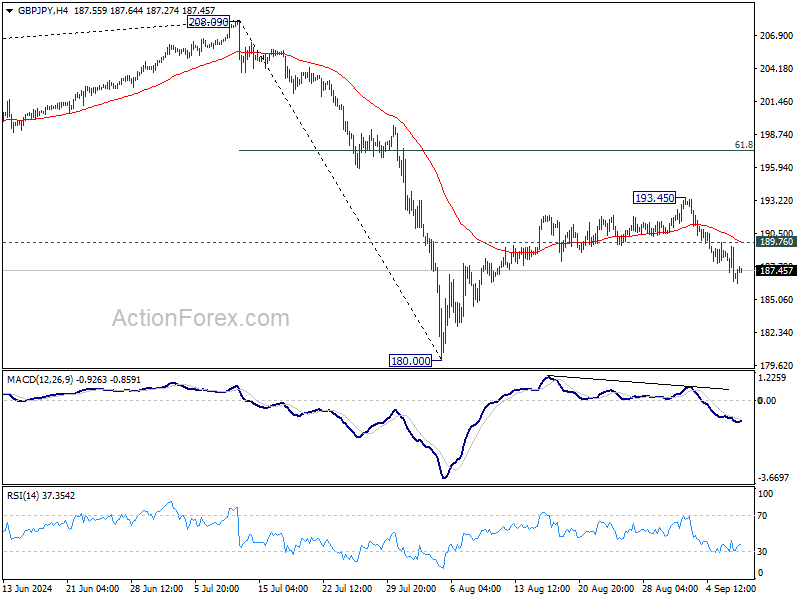
GBP/JPY Daily Outlook
Daily Pivots: (S1) 185.77; (P) 187.58; (R1) 188.65; More...
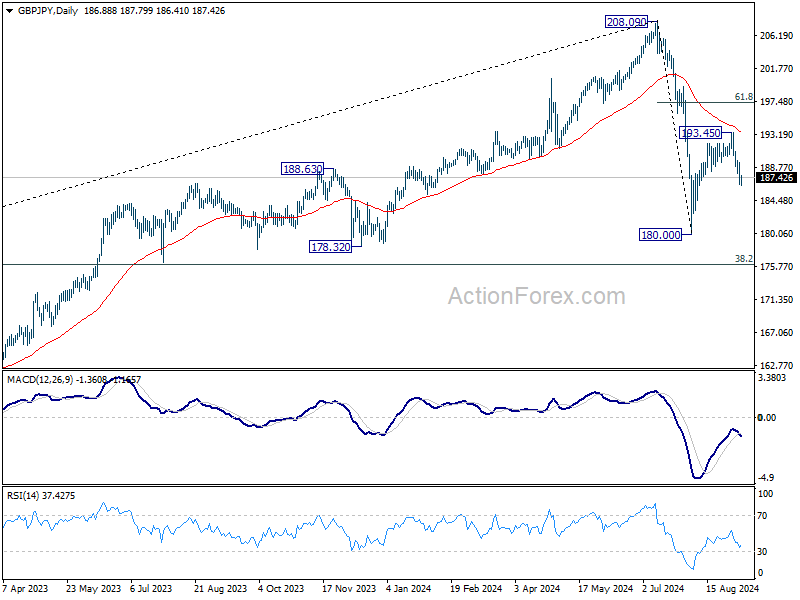
Intraday bias in GBP/JPY remains on the downside for the moment. Fall from 193.45 is in progress for retest 180.00 low first. Break there will resume whole fall from 208.09. On the upside, above 189.76 minor resistance will turn intraday bias neutral.
In the bigger picture, price actions from 208.09 are seen as a correction to whole rally from 123.94 (2020 low). The range of consolidation should be set between 38.2% retracement of 123.94 to 208.09 at 175.94 and 208.09. However, decisive break of 175.94 will argue that deeper correction is underway.
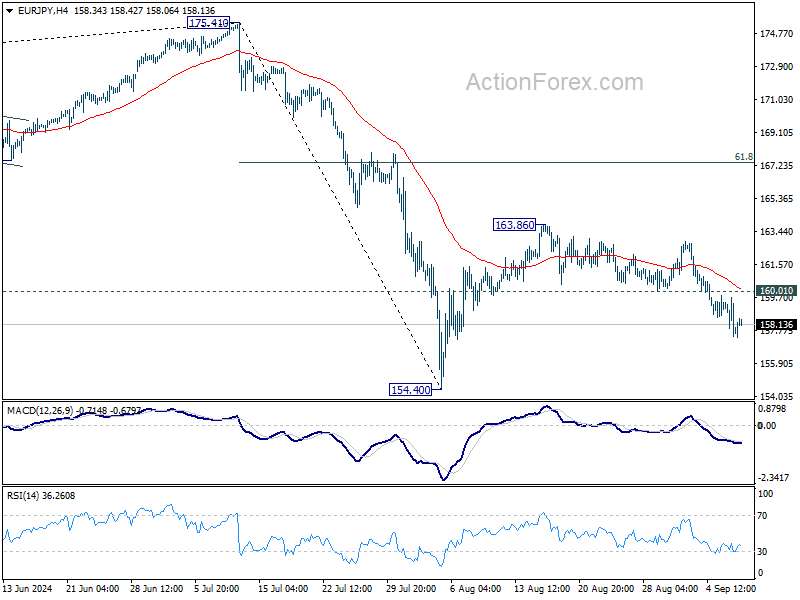
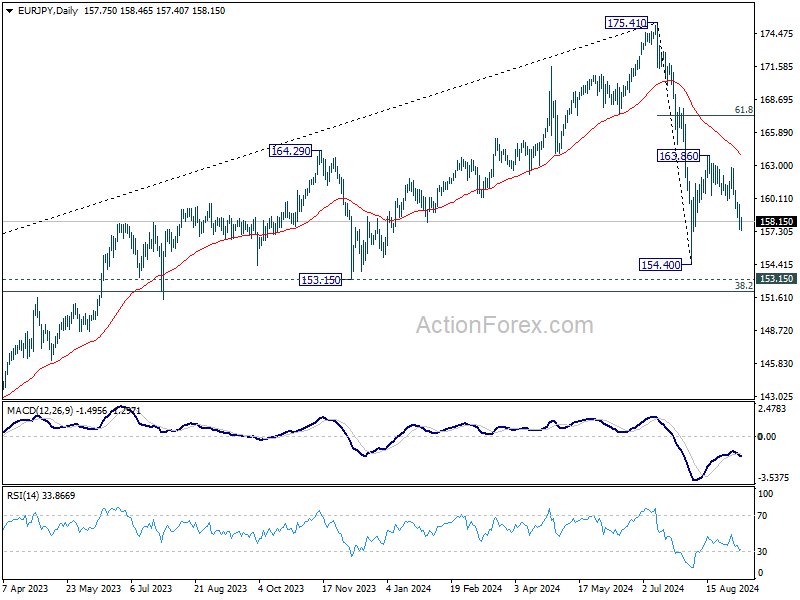
EUR/JPY Daily Outlook
Daily Pivots: (S1) 156.92; (P) 158.30; (R1) 159.14; More....
Intraday bias in EUR/JPY remains at this point. Fall from 163.86 is in progress for retesting 154.40 low. Firm break there will resume whole decline from 175.41 to 153.15 support. On the upside, above 160.01 support turned resistance will turn intraday bias neutral first.
In the bigger picture, price actions from 175.41 are seen as correction to rally from 114.42 (2020 low). The range of consolidation should have been set between 38.2% retracement of 114.42 to 175.41 at 152.11 and 175.41 high. However, decisive break of 152.11 would argue that deeper correction is underway.
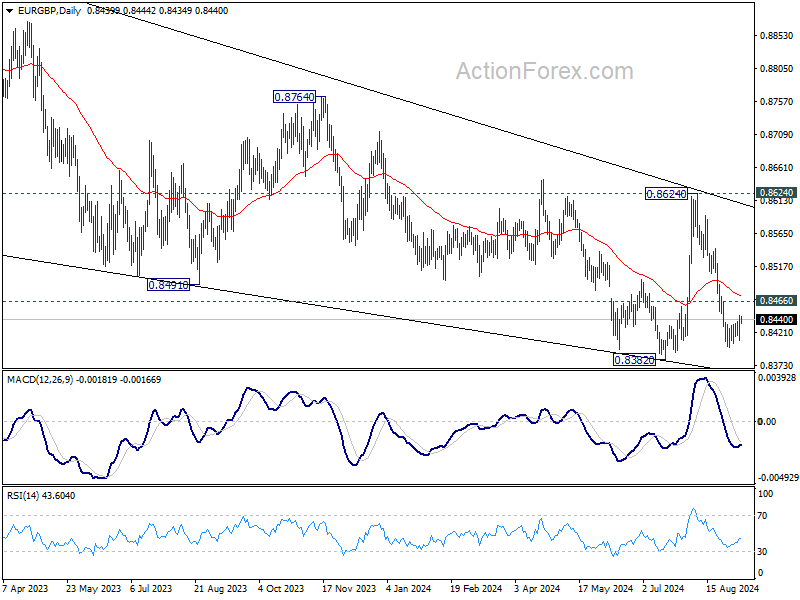
EUR/GBP Daily Outlook
Daily Pivots: (S1) 0.8421; (P) 0.8434; (R1) 0.8456; More...
Intraday bias in EUR/GBP remains neutral and further decline is expected with 0.8466 resistance intact. On the downside, below 0.8399 will resume the fall from 0.8624 and target 0.8382 support. Firm break there will resume larger down trend.
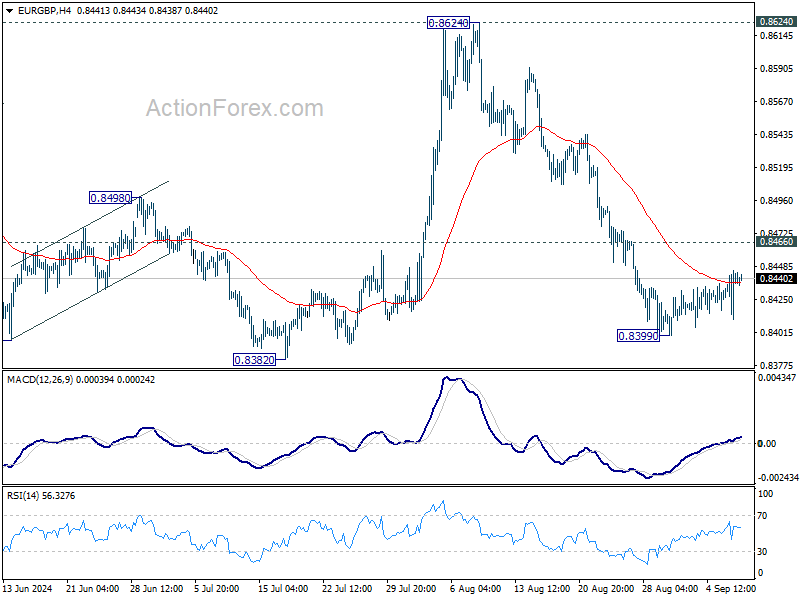
In the bigger picture, as long as 0.8624 resistance holds, down trend from 0.9267 is expected to continue. Firm break of 0.8382 will target 0.8201 (2022 low). However, decisive break of 0.8624 will indicate that such down trend has completed, and turn outlook bullish for 0.8764 resistance next.
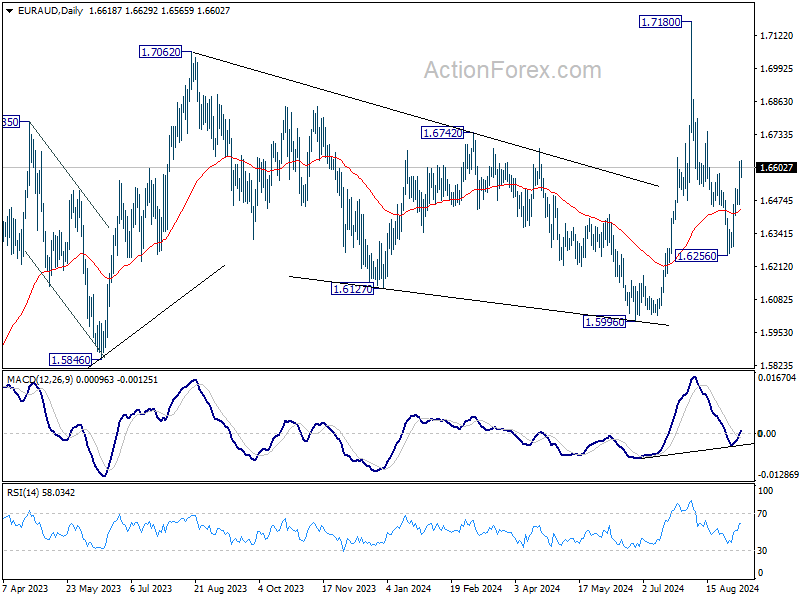
EUR/AUD Daily Outlook
Daily Pivots: (S1) 1.6502; (P) 1.6566; (R1) 1.6682; More...
Intraday bias in EUR/AUD remains on the upside for the moment. Corrective pullback from 1.7180 could have completed at 1.6256 already. Further rise should be seen to retest 1.7180 high next. On the downside, however, break of 1.6413 support will turn bias back to the downside for 1.6256 again.
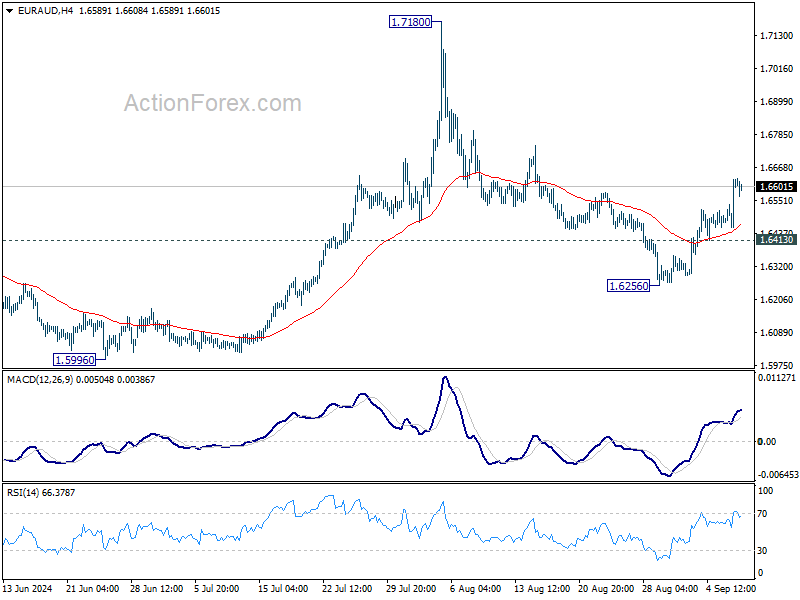
In the bigger picture, outlook is mixed up by the deeper than expected fall from 1.7180. Yet as long as 1.5996 support holds, up trend from 1.4281 (2022 low) is still expected to resume at a later stage. Firm break of 1.7180 will pave the way to 61.8% projection of 1.4281 to 1.7062 from 1.5996 at 1.7715.
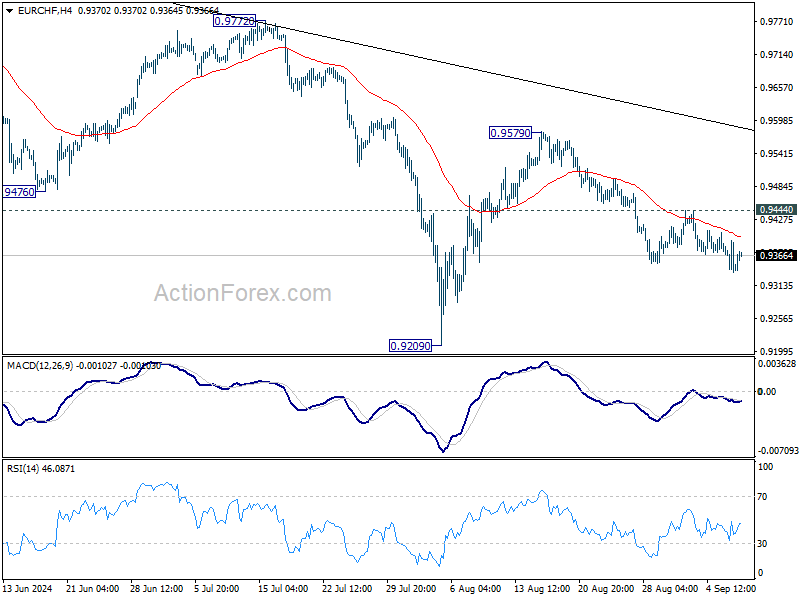
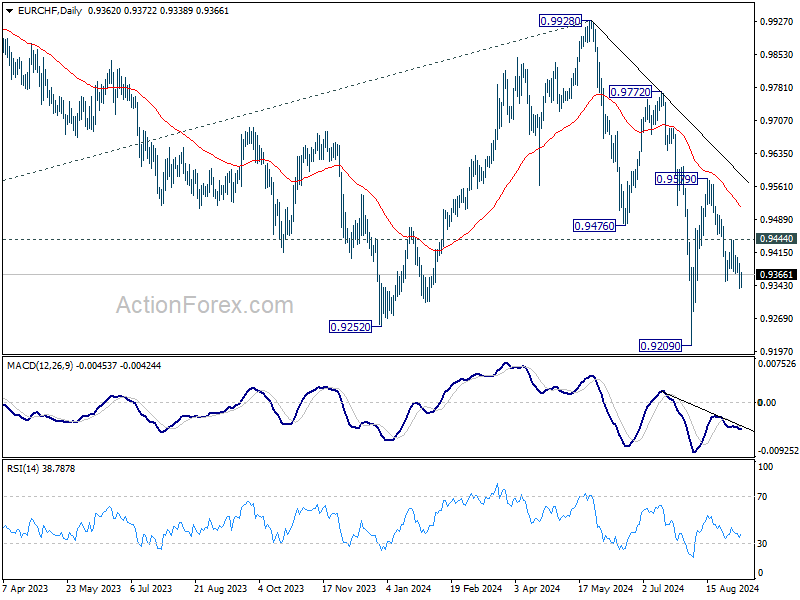
EUR/CHF Daily Outlook
Daily Pivots: (S1) 0.9322; (P) 0.9364; (R1) 0.9389; More....
Further decline is expected in EUR/CHF with 0.9444 resistance intact, despite relatively weak downside momentum as seen in 4H MACD. Rebound form 0.9029 should have completed at 0.9579, ahead of 55 D EMA. Deeper fall should be seen to retest 0.9209 first. Firm break there will resume larger down trend. However, break of 0.9444 will turn bias back to the upside for 0.9579 resistance instead.
In the bigger picture, medium term corrective pattern from 0.9407 (2022 low) might have completed with three waves to 0.9928. Decisive break of 0.9252 (2023 low) will confirm long term down trend resumption. Next target will be 61.8% projection of 1.1149 to 0.9407 from 0.9928 at 0.8851. For now, outlook will stay bearish as long as 0.9928 resistance holds, even in case of strong rebound.
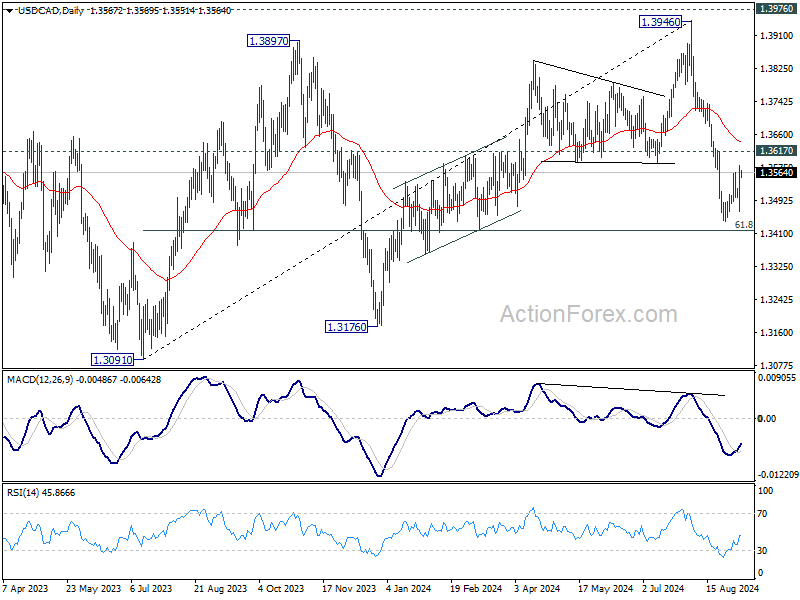
USD/CAD Daily Outlook
Daily Pivots: (S1) 1.3492; (P) 1.3509; (R1) 1.3519; More...
Intraday bias in USD/CAD remains neutral as consolidation from 1.3439 is extending. Further decline will remain in favor as long as 1.3617 resistance holds. On the downside, break of 1.3439 and sustained trading below 61.8% retracement of 1.3091 to 1.3946 at 1.3418 will pave the way to 1.3091/3176 support zone next. However, firm break of 1.3617 will turn bias back to the upside for stronger rebound instead.
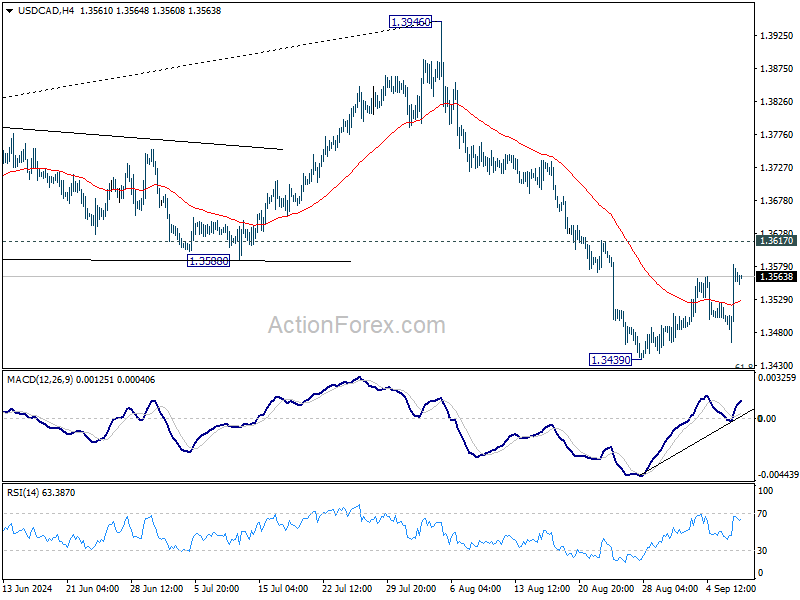
In the bigger picture, current development suggests that corrective pattern from 1.3976 (2022 high) is extending with another falling leg. While deeper decline could be seen, strong support should emerge above 1.2947 resistance turned support to bring rebound. Rise from 1.2005 (2021 low) is still in favor to resume at a later stage.
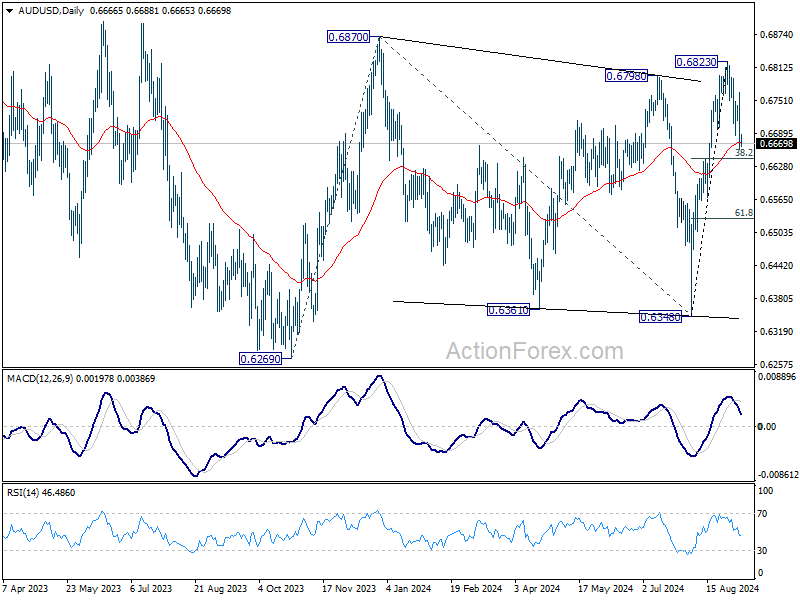
AUD/USD Daily Report
Daily Pivots: (S1) 0.6631; (P) 0.6699; (R1) 0.6738; More...
Intraday bias in AUD/USD remains mildly on the downside at this point. Fall from 0.6823 short term top would target 38.2% retracement of 0.6348 to 0.6823 at 0.6642. Break will target 61.8% retracement at 0.6529. On the upside, though, above 0.6766 resistance will bring retest of 0.6823 instead.
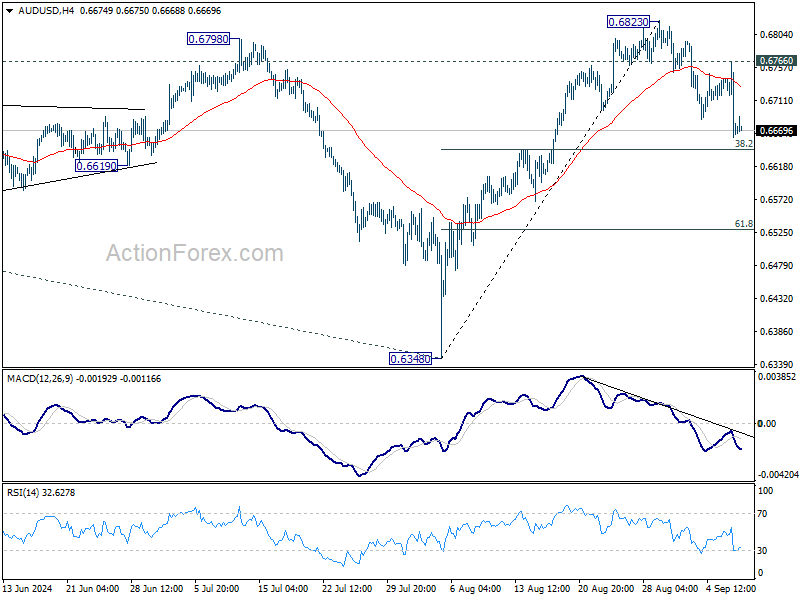
In the bigger picture, overall, price actions from 0.6169 (2022 low) are seen as a medium term corrective pattern, with rise from 0.6269 as the third leg. Firm break of 0.6798/6870 resistance zone will target 0.7156 resistance. In case of another fall, strong support should be seen from 0.6169/6361 to bring rebound.
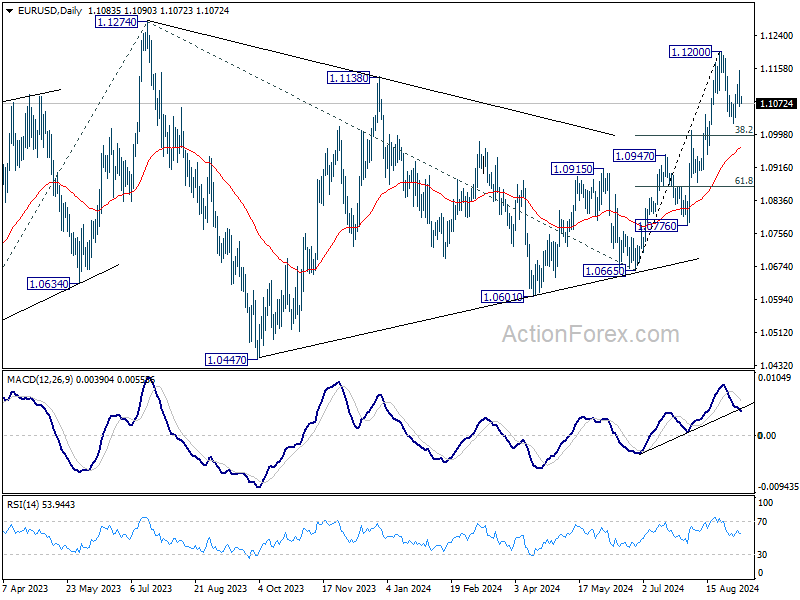
EUR/USD Daily Outlook
Daily Pivots: (S1) 1.1049; (P) 1.1102; (R1) 1.1138; More....
Intraday bias in EUR/USD remains neutral for the moment, and consolidation from 1.1200 could extend further. In case of deeper retreat, downside should be contained by 38.2% retracement of 1.0665 to 1.1200 at 1.0996 to bring rebound. Break of 1.1200 will resume larger rise towards 1.1274 high. However, sustained break of 1.0996 will indicate reversal and turn bias to the downside.
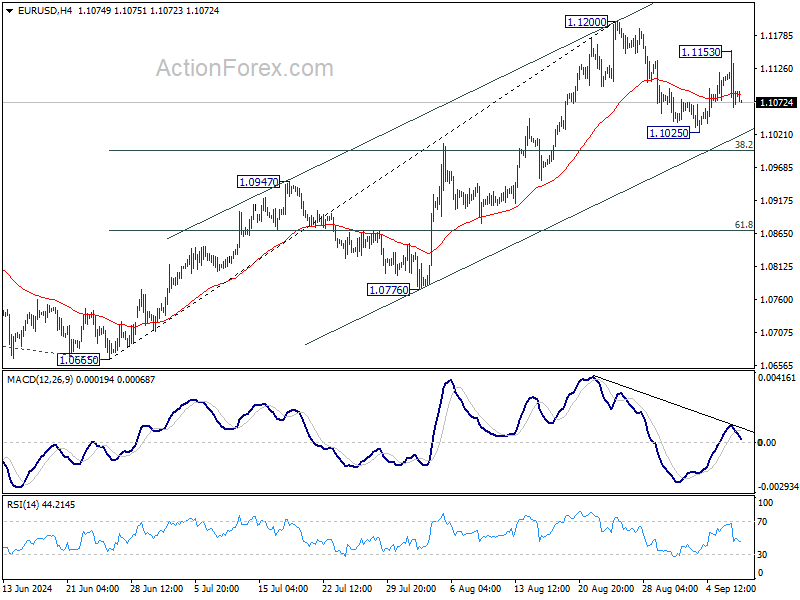
In the bigger picture, prior break of 1.1138 resistance indicates that corrective pattern from 1.1274 might have completed at 1.0665 already. Decisive break of 1.1274 (2023 high) will confirm whole up trend from 0.9534 (2022 low). Next target will be 61.8% projection of 0.9534 to 1.1274 from 1.0665 at 1.1740. This will now be the favored case as long as 1.0947 resistance turned support holds.
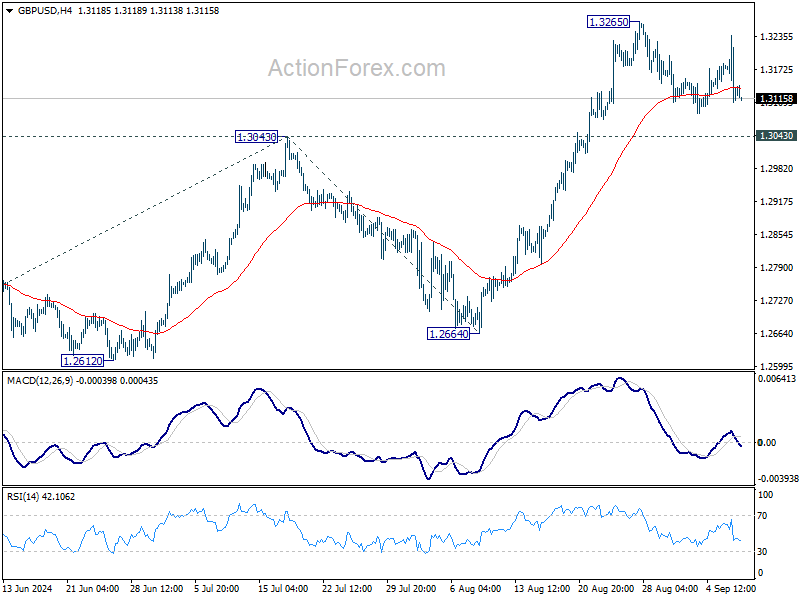
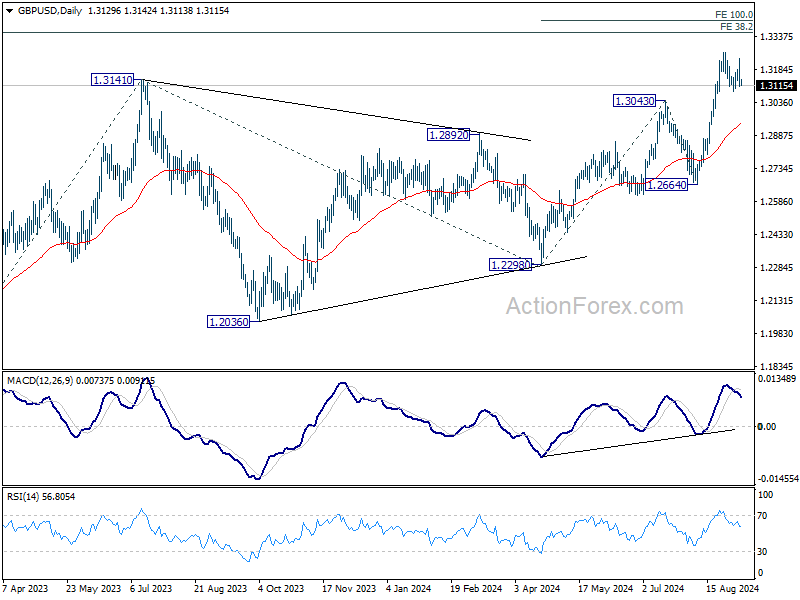
GBP/USD Daily Outlook
Daily Pivots: (S1) 1.3078; (P) 1.3158; (R1) 1.3207; More...
Intraday bias in GBP/USD remains neutral as consolidation from 1.3265 is still extending. Outlook will stay bullish as long as 1.3043 resistance turned support holds. On the upside, firm break of 1.3265 will resume larger up trend to 100% projection of 1.2298 to 1.3043 from 1.2664 at 1.3409. However, firm break of 1.3043 will turn bias back to the downside for deeper pullback.
In the bigger picture, up trend from 1.0351 (2022 low) is in progress. Next target is 38.2% projection of 1.0351 to 1.3141 from 1.2298 at 1.3364. For now, outlook will stay bullish as long as 1.2664 support holds, even in case of deep pullback.
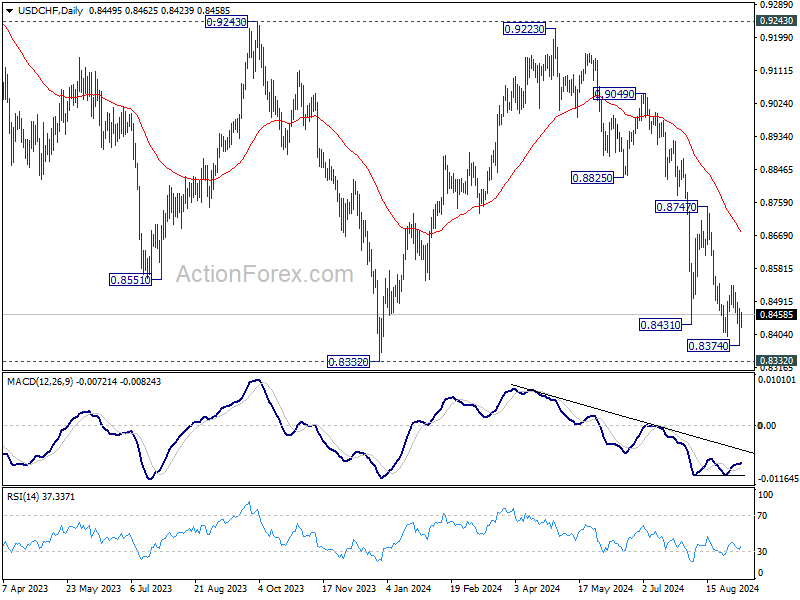
USD/CHF Daily Outlook
Daily Pivots: (S1) 0.8379; (P) 0.8428; (R1) 0.8480; More…
Intraday bias in USD/CHF is turned neutral with 4H MACD crossed above signal line. But further decline will remain in favor as long as 0.8536 resistance holds. Below 0.8374 will resume the fall from 0.9223 to retest 0.8332 low. Decisive break there will indicate larger down trend resumption. However, considering bullish convergence condition in 4H MACD, break of 0.8536 resistance will now confirm short term bottoming, and turn bias back to the upside for 0.8747 resistance.
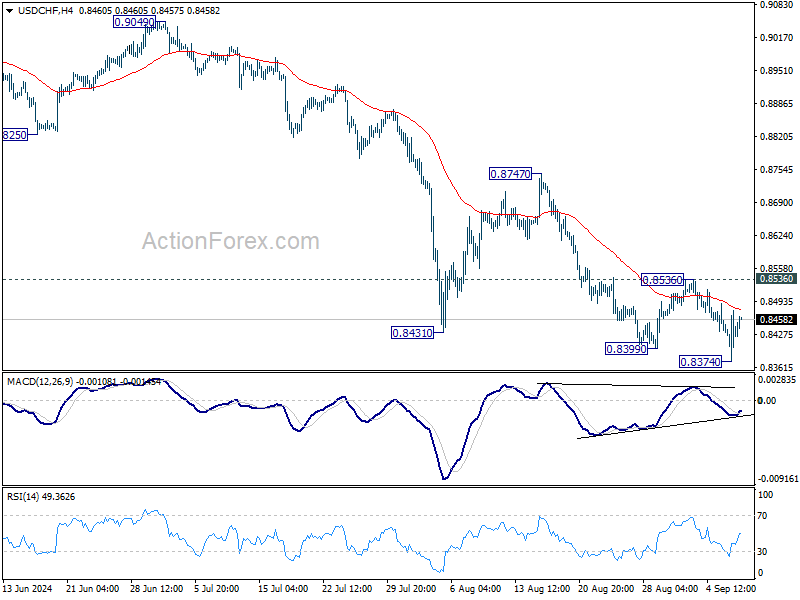
In the bigger picture, price actions from 0.8332 (2023 low) are currently seen as a medium term corrective pattern, with fall from 0.9223 as the second leg. Strong support could be seen from 0.8332 to bring rebound. Yet, overall outlook will continue to stay bearish as long as 0.9243 resistance holds. Firm break of 0.8332, however, will resume larger down trend from 1.0146 (2022 high).