
Sample Category Title
GBP/USD Mid-Day Outlook
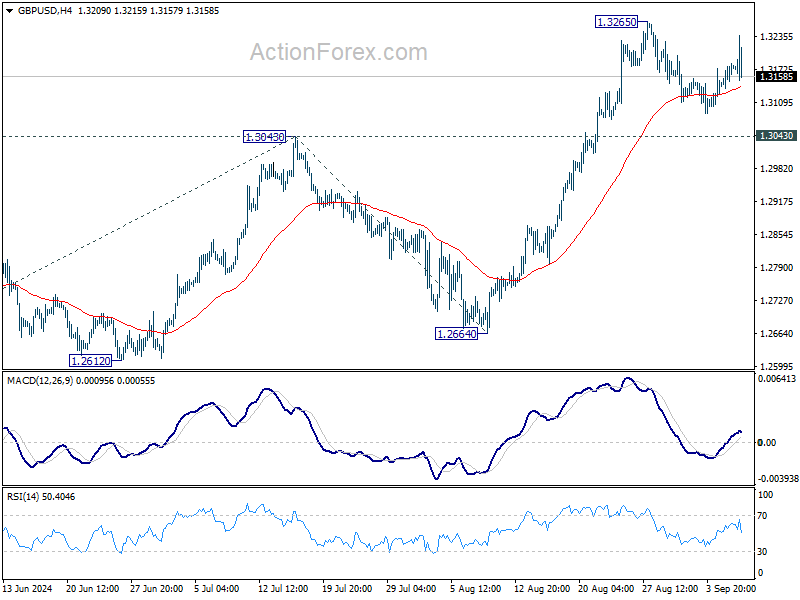
Daily Pivots: (S1) 1.3150; (P) 1.3168; (R1) 1.3199; More...
Intraday bias in GBP/USD remains neutral as it's still bounded in consolidations below 1.3265. While another retreat cannot be ruled out, downside should be contained above 1.3043 resistance turned support to bring rebound. On the upside, above 1.3265 will resume larger up trend to 100% projection of 1.2298 to 1.3043 from 1.2664 at 1.3409. However, firm break of 1.3043 will indicate short term topping and turn bias back to the downside for deeper pullback.
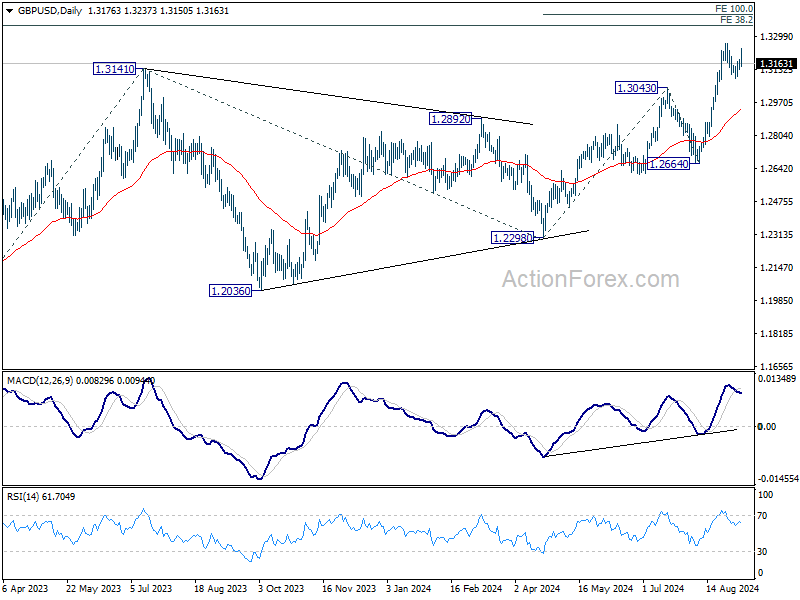
In the bigger picture, up trend from 1.0351 (2022 low) is resuming. Next target is 38.2% projection of 1.0351 to 1.3141 from 1.2298 at 1.3364. For now, outlook will stay bullish as long as 1.2664 support holds, even in case of deep pullback.
USD/JPY Mid-Day Outlook
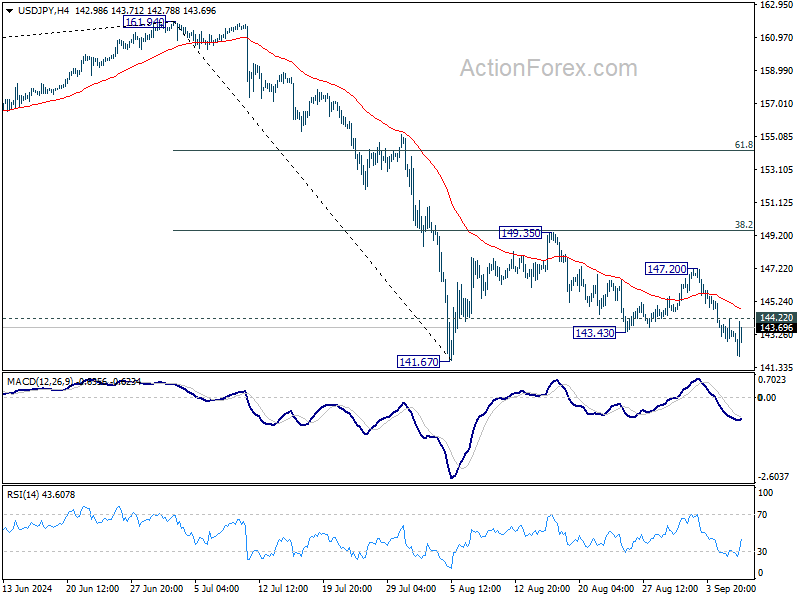
Daily Pivots: (S1) 142.79; (P) 143.51; (R1) 144.17; More...
Intraday bias in USD/JPY stays on the downside for the moment. Firm break of 141.67 support will resume whole decline from 161.95 high, for 140.25 support next. On the upside, above 144.22 minor resistance will turn intraday bias neutral first. But risk will stay on the downside as long as 147.20 resistance holds, in case of recovery.
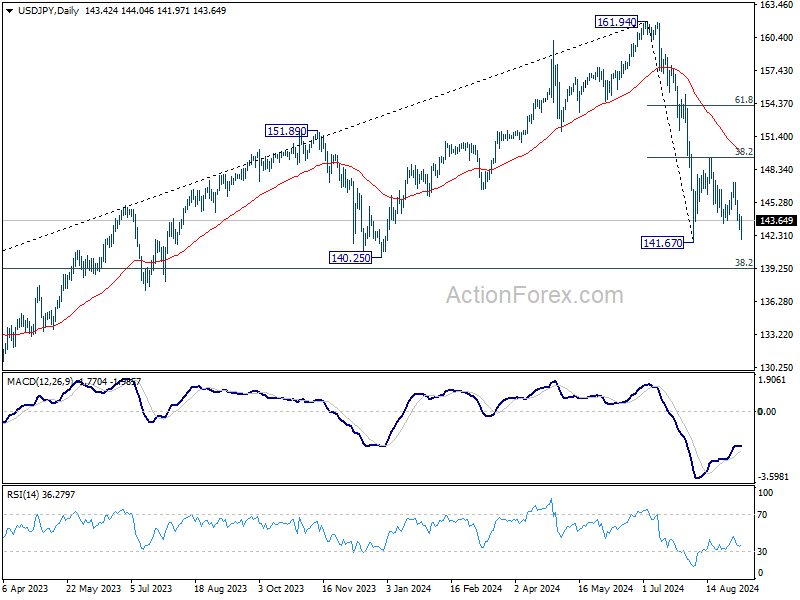
In the bigger picture, fall from 161.94 medium term top is seen as correcting whole up trend from 102.58 (2021 low). Deeper decline could be seen to 38.2% retracement of 102.58 to 161.94 at 139.26, which is close to 140.25 support. In any case, risk will stay on the downside as long as 55 W EMA (now at 149.24) holds. Nevertheless, firm break of 55 W EMA will suggest that the range for medium term corrective pattern is already set.
US: Hiring Rebounded in August, While the Unemployment Rate Ticked Down to 4.2%
Non-farm employment rose by 142k in August, slightly below the consensus forecast calling for a gain of 165k. Job gains in the two prior months were revised lower by 86k.
- Over the past three months, payroll gains have averaged 116k, in line with recent months but considerably below the 202k averaged over the prior twelve-month period.
Private payrolls rose 118k, with most of the gains concentrated in leisure & hospitality (+46k), health care & social assistance (+44.1k) and construction (+34k). Government hiring chipped in with 24k jobs in August.
In the household survey, a stronger gain in civilian employment (+168k) outstripped a further increase in the labor force (+120k) – pushing the unemployment rate down 0.1 percentage points to 4.2%. The labor force participation rate held steady at 62.7%.
Average hourly earnings (AHE) were up 0.4% month-on-month (m/m) – an acceleration from July's 0.2% gain. On a twelve-month basis, AHE ticked up to 3.8% (from 3.6% in July).
Key Implications
This morning's employment report provided further evidence that the labor market is cooling. Not only did job growth come in below the consensus forecast, but revisions to prior months also showed a weaker pace of job creation. That said, it wasn't all bad news. The unemployment rate partly reversed some of July's uptick – thanks to a sharp reversal in temporary layoffs following a spike in July – while aggregate weekly hours rose by a healthy 0.3% m/m, or the largest monthly gain since March.
Fed officials have been clear in recent communication: rate cuts are imminent. However, market participants are still wrestling with whether the FOMC will cut by 25 or 50 basis points at its next meeting in less than two-weeks. Clearly the labor market has cooled over the past year, but we feel there isn't enough evidence to suggest that the recent softening is the start of a more serious deterioration in underlying fundamentals. Absent a change to this view, we expect three quarter-point rate cuts from the Fed by year-end.
Canada’s Labour Market Continued to Cool in August
Canada's labour market added a modest net 22k new positions, roughly on expectations. However, all the gains were in part-time job positions, which rebounded 66k after losses in July. Full-time positions gave back 44k.
Growth in the labour force outpaced job gains, pushing the unemployment rate up two tenths to 6.6%, slightly higher than expected. Once again, strong population (+96k) and labour force (+82.5k) growth swamped the more modest growth in employment.
Looking across sectors, job gains were concentrated in education services (+1.7% month-on-month (m/m), 25K), health care and social assistance (+0.9% m/m, 25k) and finance, insurance and real estate (+0.8%m/m, +11k).
The unemployment rate has now risen 1.5 percentage points (p.p.) since April 2023, but over the past year it has risen the most for youth (+3.2 p.p. to 14.5%). And job market prospects did not improve much for students in August either, with their unemployment rate rising to 16.7%, versus 12.9% last summer and the highest since 2012.
Lastly, total hours worked declined slightly in August (-0.1% m/m), leaving them up 1.4% over the past year. Wage growth cooled modestly to 5.0% year-on-year in August.
Key Implications
August's jobs report managed a gain in jobs, but apart from that the story continues a be further cooling in Canada's labour market. In Wednesday's Bank of Canada's interest rate announcement, Governor Macklem characterized Canada's economy as having "enough slack". This continued weakening in the job market suggests slack continues to build in the labour market, pointing to the need for further interest rate cuts.
The labour market is giving the OK for the Bank of Canada to continue its gradual quarter-point cut per rate announcement pace. We expect the Bank to cut interest rates in two more quarter point moves in October and December this year (see rates forecasts).
USD/CHF Mid-Day Outlook
Daily Pivots: (S1) 0.8419; (P) 0.8455; (R1) 0.8476; More…
USD/CHF's fall from 0.9223 resumed by breaching 0.8399 support. Intraday bias is back on the downside for retesting 0.8332 low. decisive break there will indicate larger down trend resumption. However, break of 0.8536 resistance will now confirm short term bottoming, and turn bias back to the upside for 0.8747 resistance.
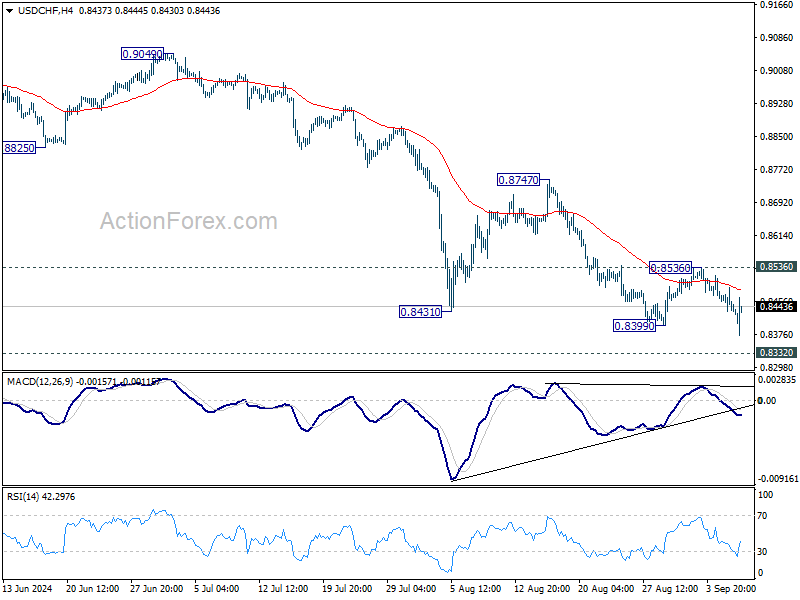
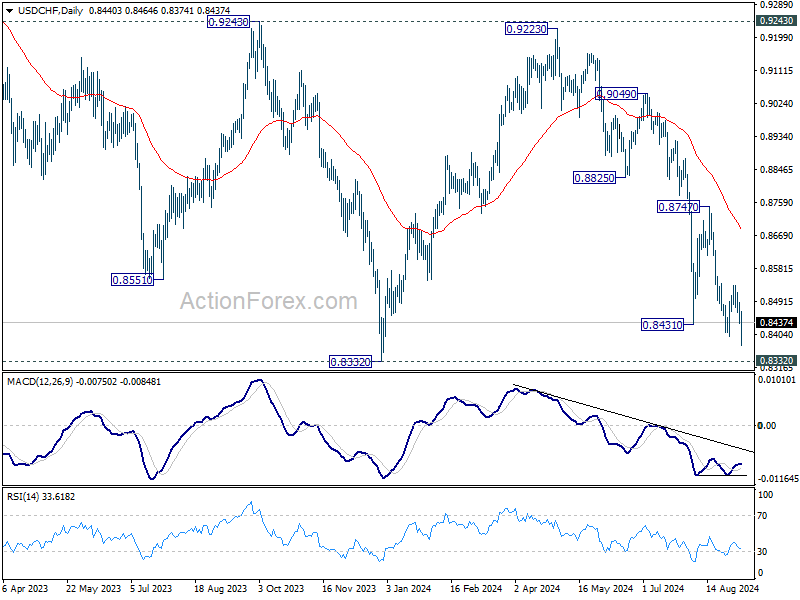
In the bigger picture, price actions from 0.8332 (2023 low) are currently seen as a medium term corrective pattern, with fall from 0.9223 as the second leg. Strong support could be seen from 0.8332 to bring rebound. Yet, overall outlook will continue to stay bearish as long as 0.9243 resistance holds. Firm break of 0.8332, however, will resume larger down trend from 1.0146 (2022 high).
NFP Viewed as Dovish but Not Disastrous, Dollar Declines
The August US non-farm payroll report has been interpreted as largely dovish by the markets. Job growth showed clear signs of slowing, but the slight decrease in the unemployment rate has helped ease immediate recession fears. As a result, market expectations for a 50 bps rate cut by Fed this month have now risen above 50%. Dollar is broadly sold off in response, and 10-year Treasury has a notable decline.
Nevertheless, while the data points to a cooling labor market, it wasn't severe enough to suggest a sharp economic downturn. Hence, the drop in US stock futures has been mild, indicating that investor sentiment remains cautious but not overly negative. There is indeed prospect of a strong bounce in major stock indexes during the rest of the session.
As the week comes to a close, Japanese Yen has solidified its position as the strongest performer. It is likely to maintain its lead unless US yields stage a sharp rebound. Swiss Franc is the second strongest, slightly outperforming the Euro.
On the other hand, Australian and New Zealand Dollars continue to struggle as the worst performers for now. Canadian Dollar has seen a notable rally, after release of domestic job data, which has pushed the greenback down to the third-worst performer. If US stock markets manage to stage a rally and recover more of this week's losses, there is potential for Dollar to end as the weakest currency of the week.
US NFP grows 142k in Aug, unemployment rate ticks down to 4.2%
US non-farm payroll employment rose 142k in August, missing expectation of 163k. Growth was also well below the average monthly gain of 202k over the prior 12 months. Previous month's growth was revised down from 114k to 89k.
Unemployment rate ticked down from 4.3% to 4.2%, matched expectations. Participation rate was unchanged at 62.7%.
Average hourly earnings rose 0.4% mom, above expectation of 0.2% mom.
Canada's employment rises 22.1k in Aug, unemployment rate jumps to 6.6%
Canada's employment grew 22.1k in August, below expectation of 25.0k. The 66k gains in part-time work were offset by -44k decline in full-time work.
Unemployment rate rose from 6.4% to 6.6%, above expectation of 6.5%, marking the highest level since May 2017 outside of the pandemic period. Employment rate fell -0.1% to 60.8%.
Average hourly wages rose 5.0% yoy, slowed from July's 5.2% yoy.
Japan's household spending rises only 0.1% in Jul, lagging expectations despite wage growth
Japan's household spending edged up by 0.1% yoy in July, falling well short of the expected 1.2% yoy increase. While this marked the first annual rise in three months, the modest growth suggests that households are still holding back on spending due to inflationary pressures.
The increase was driven by a 17.3% yoy surge in housing outlays, with more people undertaking home renovations such as installing new kitchens and bathtubs, according to the Ministry of Internal Affairs and Communications. Entertainment spending also grew by 5.6% yoy, supported by purchases of televisions for the Paris Olympics. Expenditures on domestic and overseas package tours saw significant jumps of 47.0% yoy and 62.6% yoy, respectively.
Despite the tepid spending growth, the average monthly income of salaried households with at least two people rose by 5.5% yoy in real terms, marking the third consecutive monthly increase after 3.1% yoy and 3.0% yoy gains in June and May.
A ministry official noted that "spending has not increased as much as wages grew," suggesting that some households might be saving part of their higher incomes. The ministry plans to continue monitoring how rising wages impact consumption going forward.
USD/CHF Mid-Day Outlook
Daily Pivots: (S1) 0.8419; (P) 0.8455; (R1) 0.8476; More…
USD/CHF's fall from 0.9223 resumed by breaching 0.8399 support. Intraday bias is back on the downside for retesting 0.8332 low. decisive break there will indicate larger down trend resumption. However, break of 0.8536 resistance will now confirm short term bottoming, and turn bias back to the upside for 0.8747 resistance.
In the bigger picture, price actions from 0.8332 (2023 low) are currently seen as a medium term corrective pattern, with fall from 0.9223 as the second leg. Strong support could be seen from 0.8332 to bring rebound. Yet, overall outlook will continue to stay bearish as long as 0.9243 resistance holds. Firm break of 0.8332, however, will resume larger down trend from 1.0146 (2022 high).
Economic Indicators Update
| GMT | Ccy | Events | Actual | Forecast | Previous | Revised |
|---|---|---|---|---|---|---|
| 23:30 | JPY | Overall Household Spending Y/Y Jul | 0.10% | 1.20% | -1.40% | |
| 05:00 | JPY | Leading Economic Index Jul P | 109.5 | 109.4 | 109 | |
| 06:00 | EUR | Germany Industrial Production sM/M Jul | -2.40% | -0.20% | 1.40% | |
| 06:00 | EUR | Germany Trade Balance (EUR) Jul | 16.8B | 21.2B | 20.4B | |
| 06:45 | EUR | France Trade Balance (EUR) Jul | -5.9B | -5.7B | -6.1B | |
| 06:45 | EUR | France Industrial Output M/M Jul | -0.50% | -0.20% | 0.80% | -6.0B |
| 07:00 | CHF | Foreign Currency Reserves (CHF) Aug | 694B | 704B | ||
| 09:00 | EUR | Eurozone GDP Q/Q Q2 | 0.20% | 0.30% | 0.30% | |
| 12:30 | USD | Nonfarm Payrolls Aug | 142K | 163K | 114K | 89K |
| 12:30 | USD | Unemployment Rate Aug | 4.20% | 4.20% | 4.30% | |
| 12:30 | USD | Average Hourly Earnings M/M Aug | 0.40% | 0.30% | 0.20% | -0.10% |
| 12:30 | CAD | Net Change in Employment Aug | 22.1K | 25.0K | -2.8K | |
| 12:30 | CAD | Unemployment Rate Aug | 6.60% | 6.50% | 6.40% | |
| 14:00 | CAD | Ivey PMI Aug | 55.3 | 57.6 |
Canada’s employment rises 22.1k in Aug, unemployment rate jumps to 6.6%
Canada's employment grew 22.1k in August, below expectation of 25.0k. The 66k gains in part-time work were offset by -44k decline in full-time work.
Unemployment rate rose from 6.4% to 6.6%, above expectation of 6.5%, marking the highest level since May 2017 outside of the pandemic period. Employment rate fell -0.1% to 60.8%.
Average hourly wages rose 5.0% yoy, slowed from July's 5.2% yoy.
US NFP grows 142k in Aug, unemployment rate ticks down to 4.2%
US non-farm payroll employment rose 142k in August, missing expectation of 163k. Growth was also well below the average monthly gain of 202k over the prior 12 months. Previous month's growth was revised down from 114k to 89k.
Unemployment rate ticked down from 4.3% to 4.2%, matched expectations. Participation rate was unchanged at 62.7%.
Average hourly earnings rose 0.4% mom, above expectation of 0.2% mom.
Gold Rallies as Market Bets on Rapid Fed Monetary Easing
Gold has returned to growth. On Friday, a troy ounce of the precious metal was priced at 2517 USD. The price has stabilised as the market awaits the release of August's crucial US employment report. The data could prompt a revision of the Federal Reserve's interest rate outlook, which is particularly important given the short time left before the Fed meets.
Lower interest rates could reduce the cost of holding gold as a non-yielding asset. Given the weak employment market signals, the market believes the Fed will be forced to act more decisively.
The latest statistics showed that private employers in the US hired at the slowest pace in 3.5 years in August. This follows a decline in the number of job vacancies. In addition, manufacturing activity in the economy declined. All this appears to be a negative factor indicating the state of the US economy and fuelling expectations of a 50-basis points rate cut in September. Investors are currently pricing in a 41% probability of such a scenario, which is relatively high. Considering fundamental factors, it is reasonable to assume that gold prices will continue to rise.
XAUUSD technical analysis
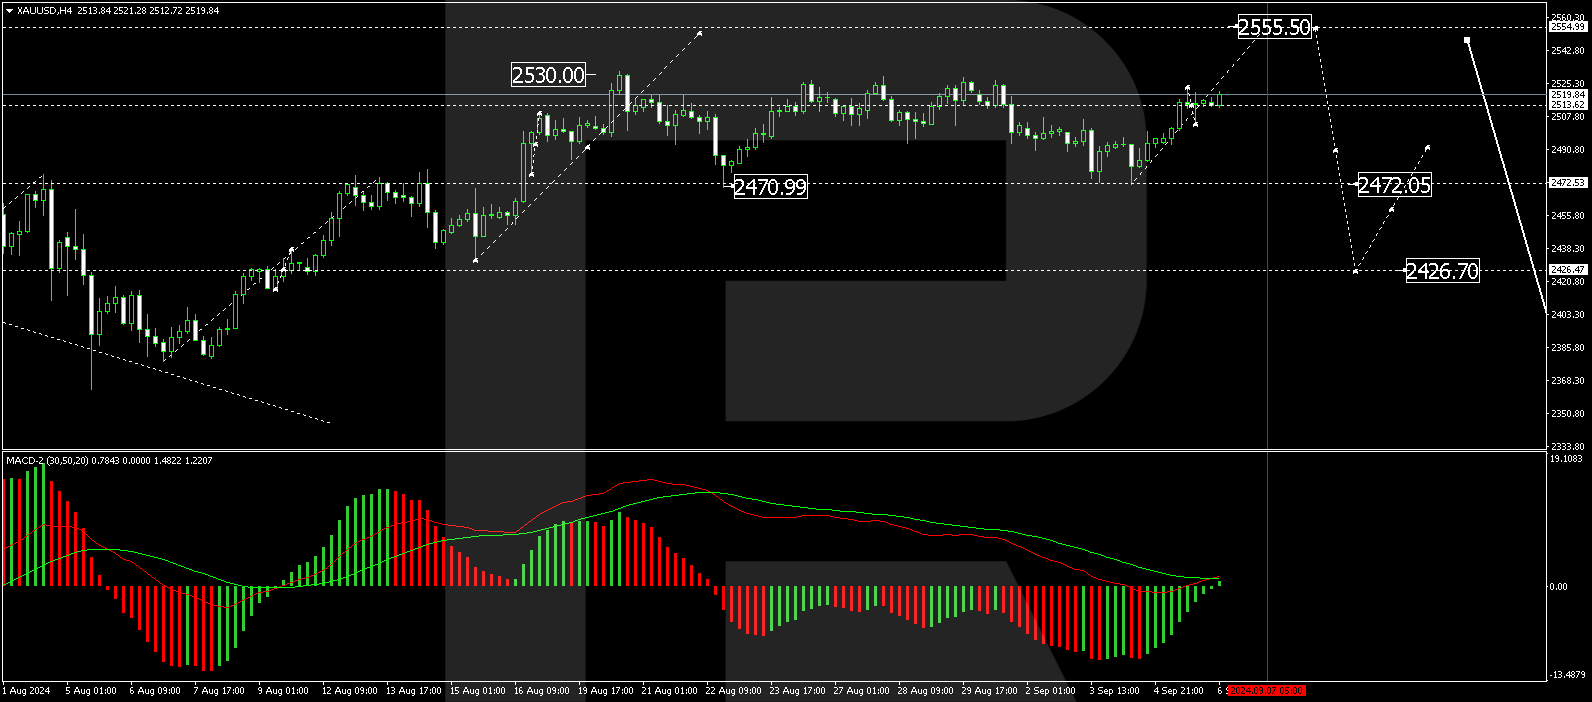
On the H4 chart, XAUUSD has received support at 2472.00. Currently, the structure of a growth wave towards 2513.62 is being formed. Today, the market is creating a consolidation range around this level. An upside breakout will open the potential for growth towards 2555.50. A break above the 2522.00 level may signal the development of a further growth wave. Technically, this scenario is confirmed by the MACD indicator. Its signal line is above zero and sloping upwards.
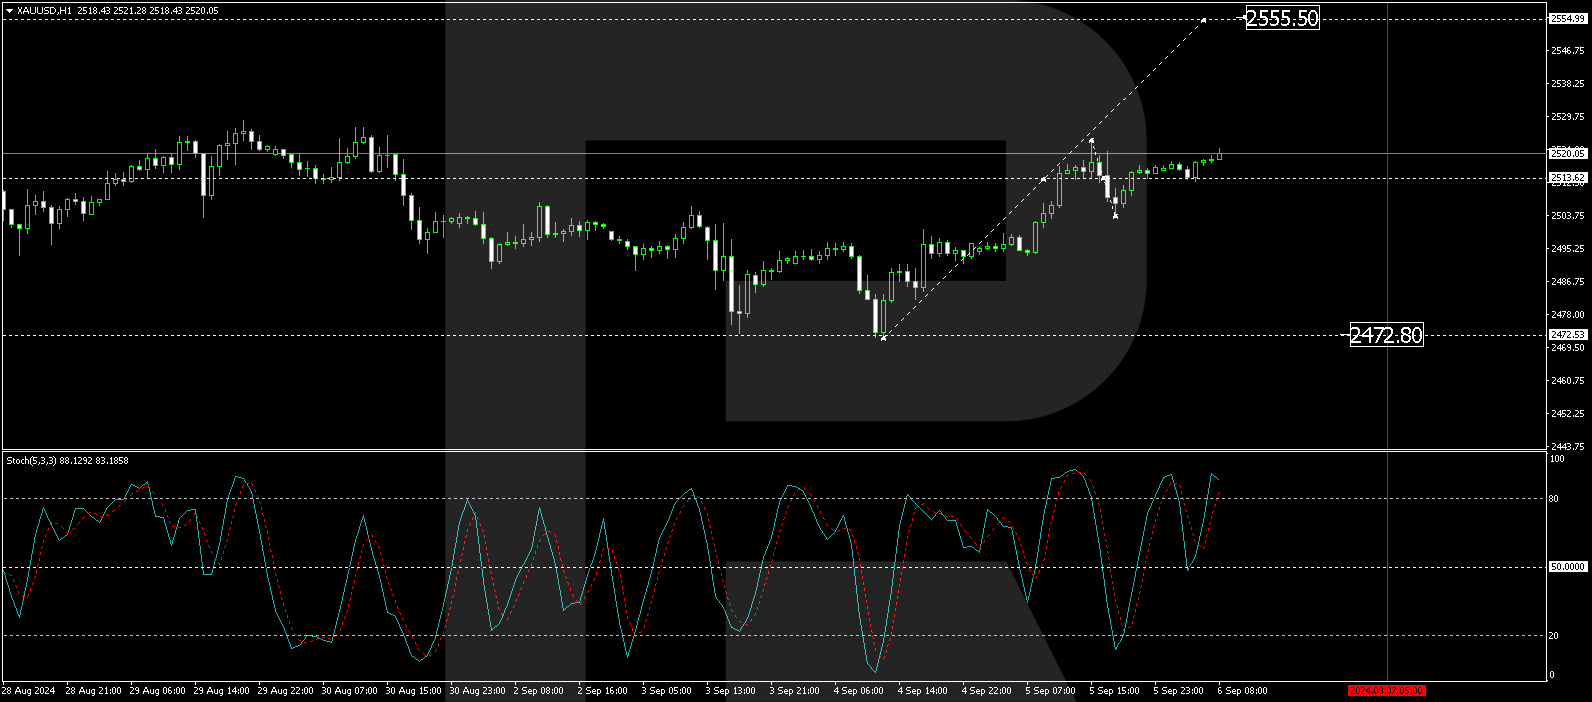
On the H1 chart of XAUUSD, the market has completed a growth wave to 2513.62. Currently, the range is extended upwards to the level of 2523.20 and downwards to the level of 2504.00. In the case of a downward breakout, a decline to 2491.55 may occur. Conversely, an upward breakout could continue the trend to 2555.50. Technically, this scenario is confirmed by the Stochastic oscillator. Its signal line is near the level of 80 and is preparing to decline to 20.
USD/JPY – Yen Extends Rally Ahead of US Jobs Data
The Japanese yen has posted strong gains on Friday. In the European session, USD/JPY is trading at 142.76 at the time of writing, down 0.47% on the day. The yen is on a tear and is up 2.3% against the greenback this week.
Japan’s household spending misses expectations
Japan’s economy is showing signs of recovery but consumers are not convinced and continue to keep a tight grip on their purse strings. Household spending eked out a gain of 0.1% y/y in July, rebounding from a 1.4% decline in June but short of the market estimate of 1.2%. Monthly, household spending fell 1.7% in July, the steepest decline in six months. This followed a 0.1% gain in June and was much lower than the market estimate of -0.2%.
US nonfarm payrolls could shake up markets, determine size of Fed cut
Today’s nonfarm payroll report has been hotly anticipated. Will we see an improvement from the July debacle of 114 thousand new jobs, which routed the global financial markets? The markets have largely recovered from the melt down but investors remain nervous and another poor nonfarm payroll release could send the markets sharply lower. The market estimate for August stands at 160 thousand.
This week’s US job numbers were mixed and investors are hoping to get some clarity about the labor market from today’s employment report. Unemployment claims dropped but JOLT job openings declined and missed expectations. The August ADP employment report dropped to just 99 thousand, down from a revised 111 thousand in July and way off the market estimate of 145 thousand. The ADP report has generally not been a reliable indicator for nonfarm payrolls, although the correlation has been stronger this year.
If the nonfarm payrolls release comes in as expected or higher, it could cement a 25-basis point from the Federal Reserve at the Sept. 18 meeting. Conversely, a weaker-than-expected reading would raise expectations for an oversize cut of 50 bps. The markets have currently priced in a 50-bps reduction at 43% and a 25-bps cut at 67% according the CME’s FedWatch, but I expect those odds to change before the day is over.
USD/JPY Technical
- USD/JPY is testing support at 142.79. Below, there is support at 142.13
- There is resistance at 143.51 and 144.17
