
Sample Category Title
EUR/CHF Daily Outlook
Daily Pivots: (S1) 0.9364; (P) 0.9386; (R1) 0.9399; More....
Intraday bias in EURCHF remains neutral with focus on 0.9351 support. Firm break there, will resume the decline from 0.9579 to retest 0.9209 low. Further decline will remain in favor as long as 0.9455 resistance holds, in case of recovery.
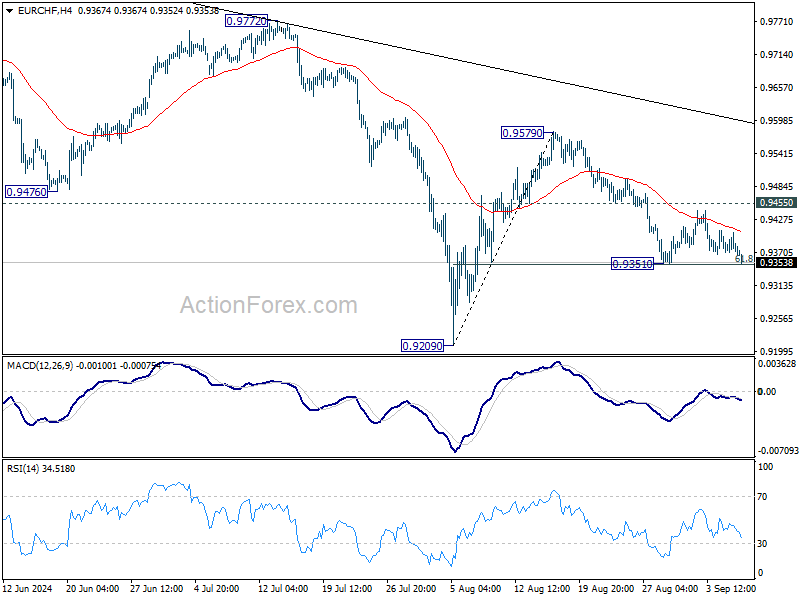
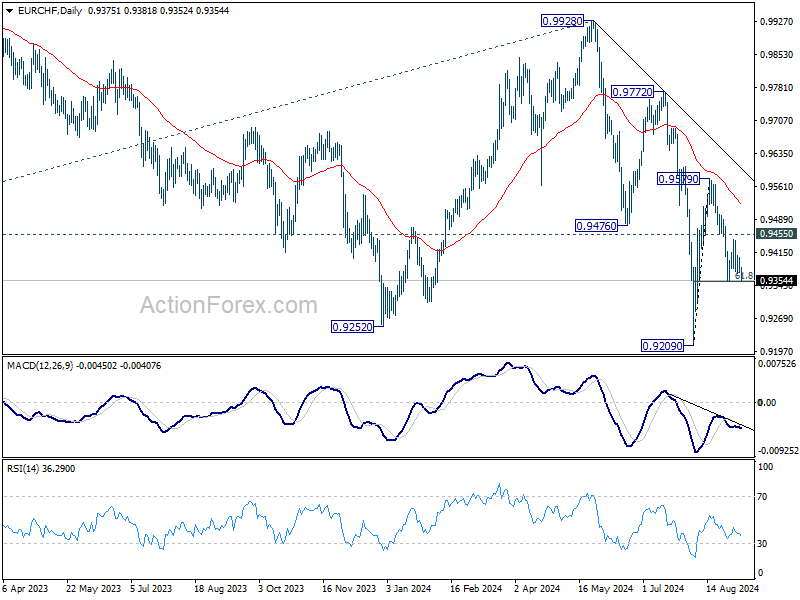
In the bigger picture, medium term corrective pattern from 0.9407 (2022 low) might have completed with three waves to 0.9928. Decisive break of 0.9252 (2023 low) will confirm long term down trend resumption. Next target will be 61.8% projection of 1.1149 to 0.9407 from 0.9928 at 0.8851. For now, outlook will stay bearish as long as 0.9928 resistance holds, even in case of strong rebound.
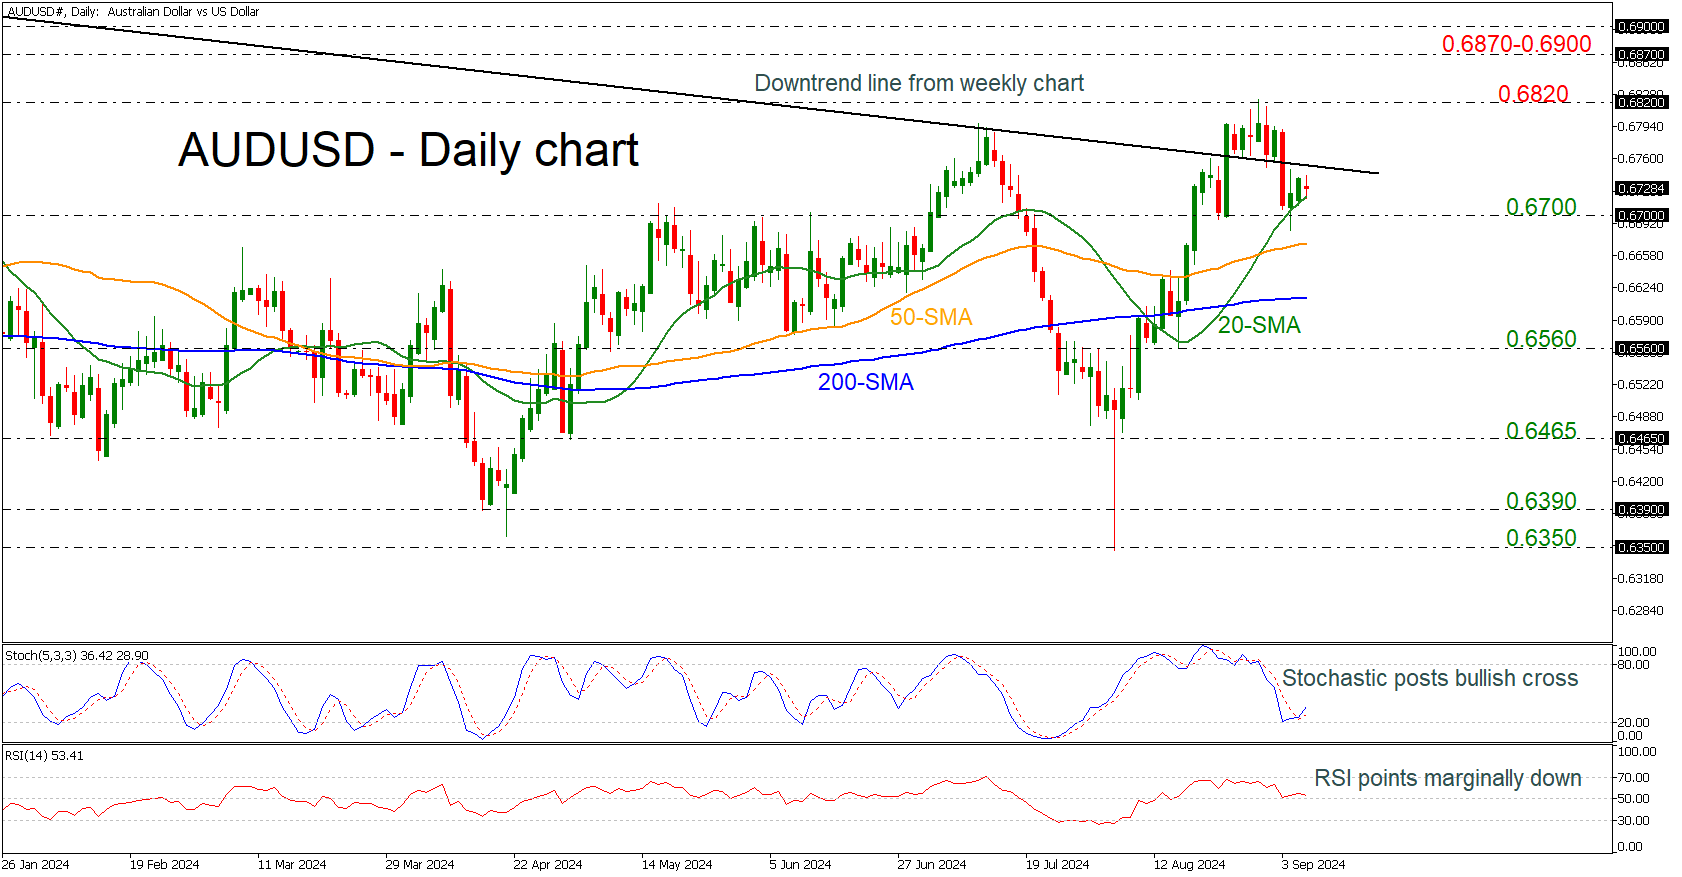
AUDUSD Bounces Off 0.6700 But Looks Weak
- AUDUSD flirts with weekly downtrend line
- Stochastics create bullish cross
- But RSI holds near neutral level
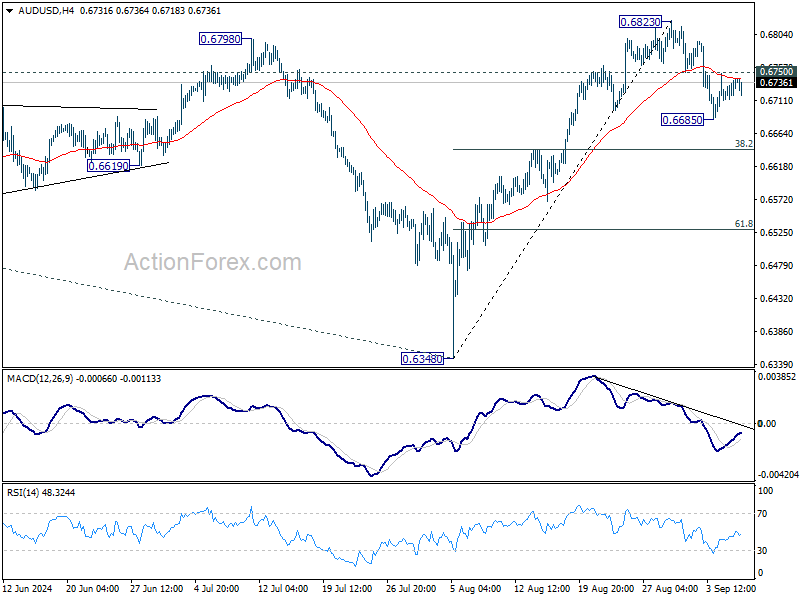
AUDUSD has reversed to the upside after the rebound off the 0.6700 round number with strong barrier coming from the weekly descending trend line around 0.6750. Over the last couple of weeks, the market has been developing back and forth of the aforementioned diagonal line, looking weak to change the outlook to a more positive one.
Technically, the stochastic oscillator posted a bullish crossover within its %K and %D lines above the oversold region; however, the RSI is heading down mirroring the latest red candle.
In case of another run above the 0.6750 level, then the market could re-challenge the 0.6820 resistance ahead of the restrictive region of 0.6870-0.6900.
On the flip side, a closing session beneath the 0.6700 mark could open the door to 50-day simple moving average (SMA) at 0.6670 ahead of the 200-day SMA at 0.6615. The latter level would be another tough obstacle to overcome before hitting the 0.6560 support.
Turning to the medium-term picture, the bearish outlook came back into play after the bridge back to the downside of the descending trend line. A jump above that point would restore the bullish mode. For a bull market though, traders need to wait for a clear close above 0.6900.
USD/CAD Daily Outlook
Daily Pivots: (S1) 1.3492; (P) 1.3509; (R1) 1.3519; More...
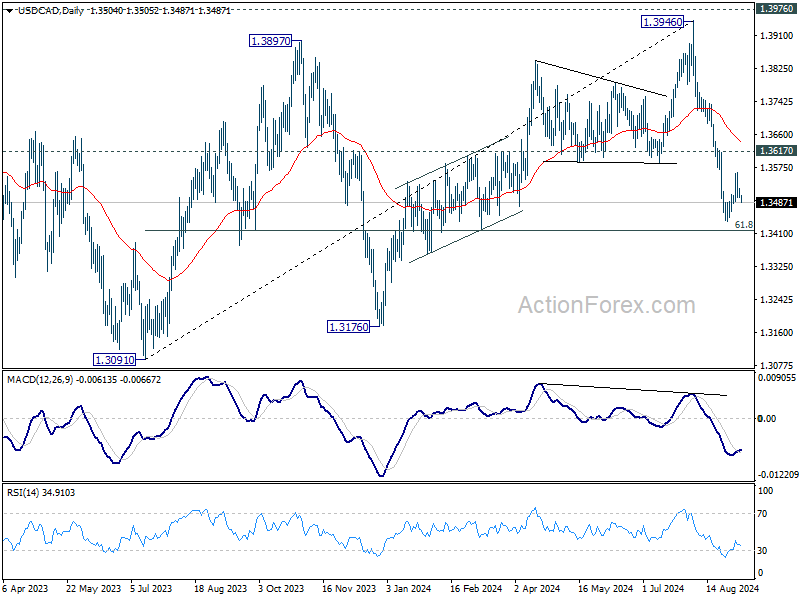
USD/CAD is still bounded in consolidation above 1.3439 and intraday bias remains neutral. With 1.3618 resistance intact, further decline is expected. On the downside, break of 1.3439 and sustained trading below 61.8% retracement of 1.3091 to 1.3946 at 1.3418 will pave the way to 1.3091/3176 support zone next. However, firm break of 1.3617 will confirm short term bottoming and turn bias back to the upside for stronger rebound.
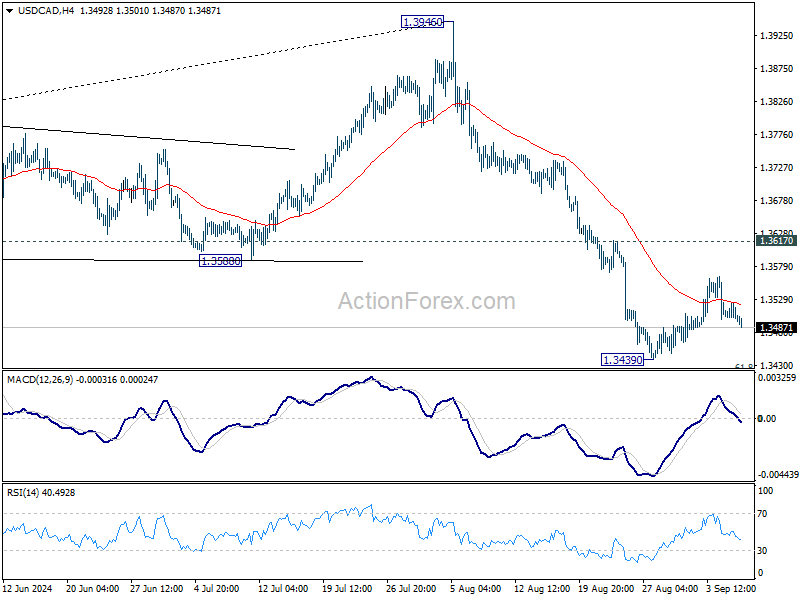
In the bigger picture, current development suggests that corrective pattern from 1.3976 (2022 high) is extending with another falling leg. While deeper decline could be seen, strong support should emerge above 1.2947 resistance turned support to bring rebound. Rise from 1.2005 (2021 low) is still in favor to resume at a later stage.
AUD/USD Daily Report
Daily Pivots: (S1) 0.6723; (P) 0.6732; (R1) 0.6751; More...
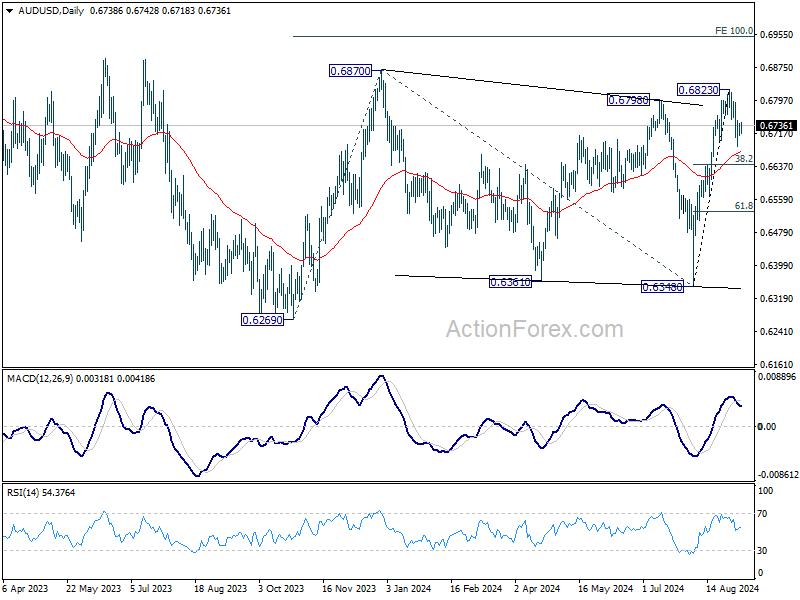
Intraday bias in AUD/USD remains neutral at this point. On the downside, below 0.6685 will extend the decline from 0.6823 short term top to 38.2% retracement of 0.6348 to 0.6823 at 0.6642. Break will target 61.8% retracement at 0.6529. On the upside, though, above 0.6750 support turned resistance will bring retest of 0.6823 instead.
In the bigger picture, overall, price actions from 0.6169 (2022 low) are seen as a medium term corrective pattern, with rise from 0.6269 as the third leg. Firm break of 0.6798/6870 resistance zone will target 0.7156 resistance. In case of another fall, strong support should be seen from 0.6169/6361 to bring rebound.
USD/JPY Daily Outlook
Daily Pivots: (S1) 142.79; (P) 143.51; (R1) 144.17; More...
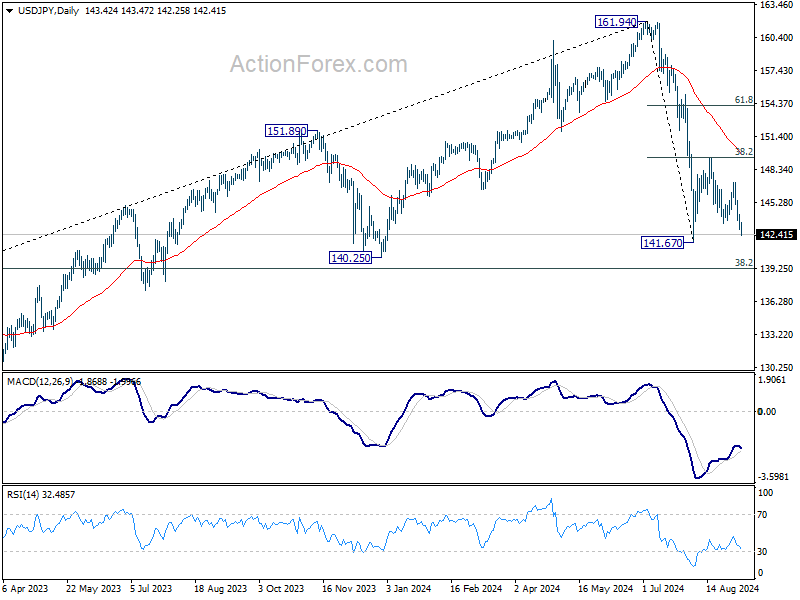
Intraday bias in USD/JPY remains on the downside for retesting 141.67 low. Firm break there will resume whole decline from 161.95 high, for 140.25 support next. On the upside, above 144.22 minor resistance will turn intraday bias neutral first. But risk will stay on the downside as long as 147.20 resistance holds, in case of recovery.
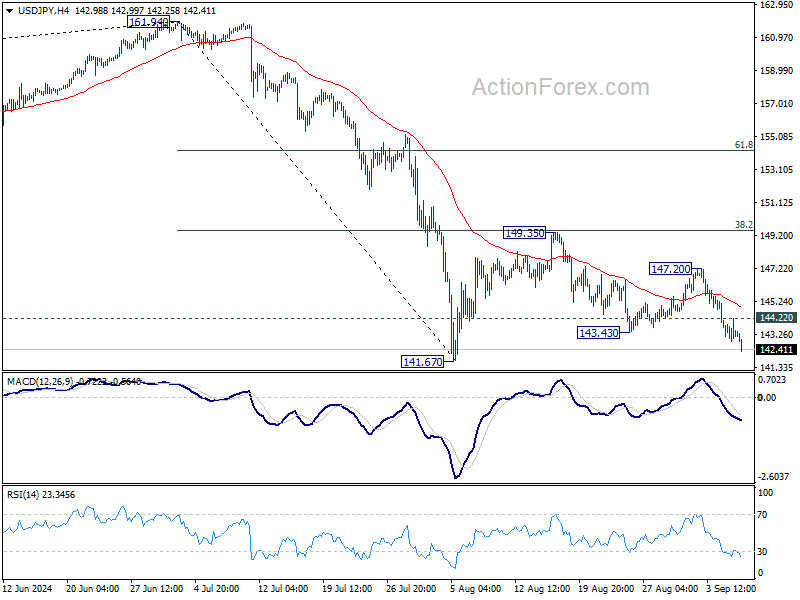
In the bigger picture, fall from 161.94 medium term top is seen as correcting whole up trend from 102.58 (2021 low). Deeper decline could be seen to 38.2% retracement of 102.58 to 161.94 at 139.26, which is close to 140.25 support. In any case, risk will stay on the downside as long as 55 W EMA (now at 149.24) holds. Nevertheless, firm break of 55 W EMA will suggest that the range for medium term corrective pattern is already set.
USD/CHF Daily Outlook
Daily Pivots: (S1) 0.8419; (P) 0.8455; (R1) 0.8476; More…
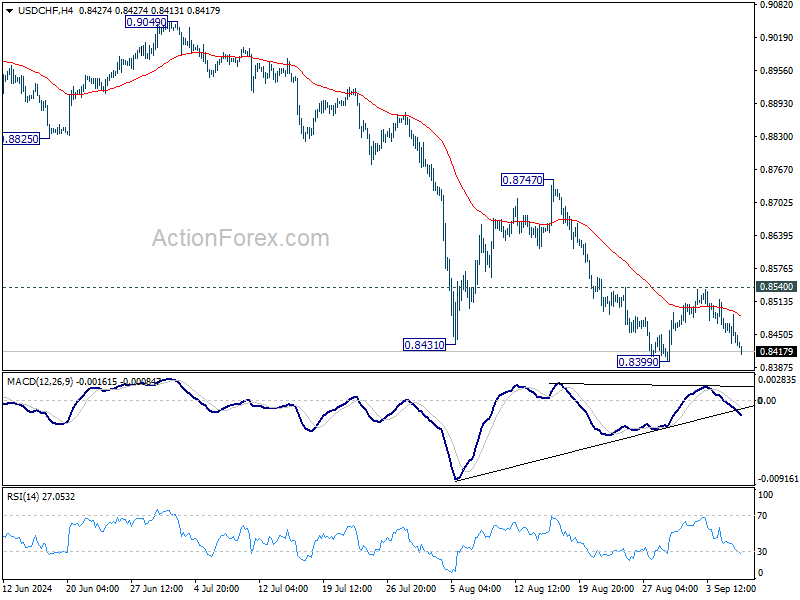
Intraday bias in USD/CHF remains neutral for the moment as consolidation continues above 0.8399. With 0.8540 resistance intact, further decline is expected. On the downside, break of 0.8339 will resume the fall from 0.9223 and target 0.8332 low. However, considering bullish convergence condition in 4H MACD, firm break of 0.8540 will confirm short term bottoming, and turn bias back to the upside for 0.8747 resistance instead.
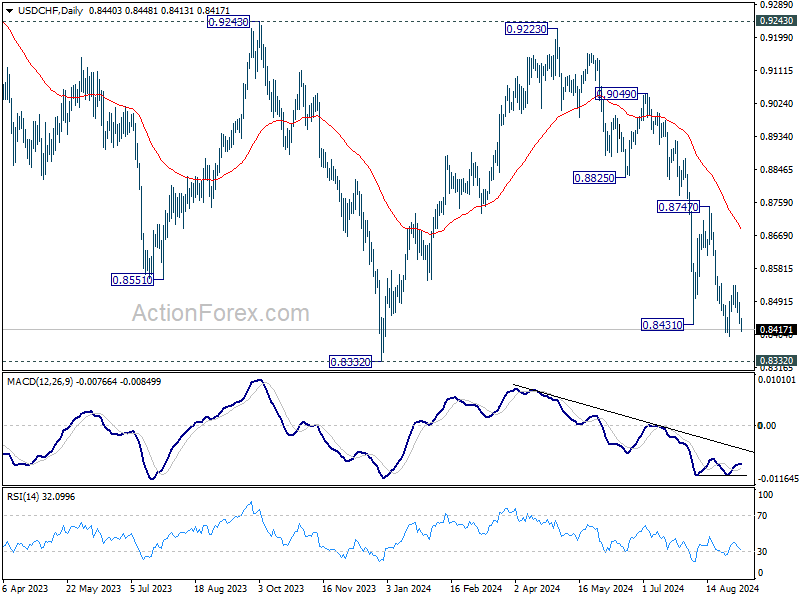
In the bigger picture, price actions from 0.8332 (2023 low) are currently seen as a medium term corrective pattern, with fall from 0.9223 as the second leg. Strong support could be seen from 0.8332 to bring rebound. Yet, overall outlook will continue to stay bearish as long as 0.9243 resistance holds. Firm break of 0.8332, however, will resume larger down trend from 1.0146 (2022 high).
GBP/USD Daily Outlook
Daily Pivots: (S1) 1.3150; (P) 1.3168; (R1) 1.3199; More...
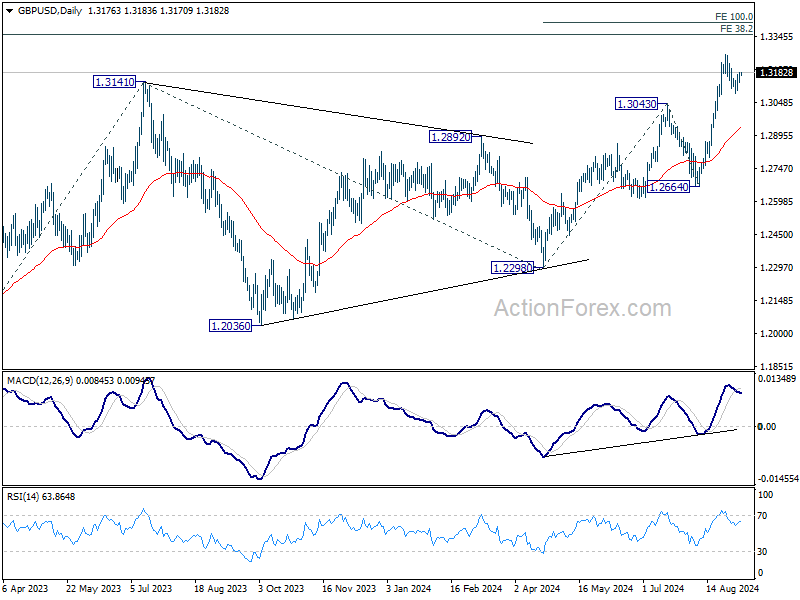
GBP/USD is still extending consolidation from 1.3265 and intraday bias stays neutral. While deeper retreat cannot be ruled out, downside should be contained above 1.3043 resistance turned support to bring rebound. On the upside, above 1.3265 will resume larger up trend to 100% projection of 1.2298 to 1.3043 from 1.2664 at 1.3409. However, firm break of 1.3043 will indicate short term topping and turn bias back to the downside for deeper pullback.
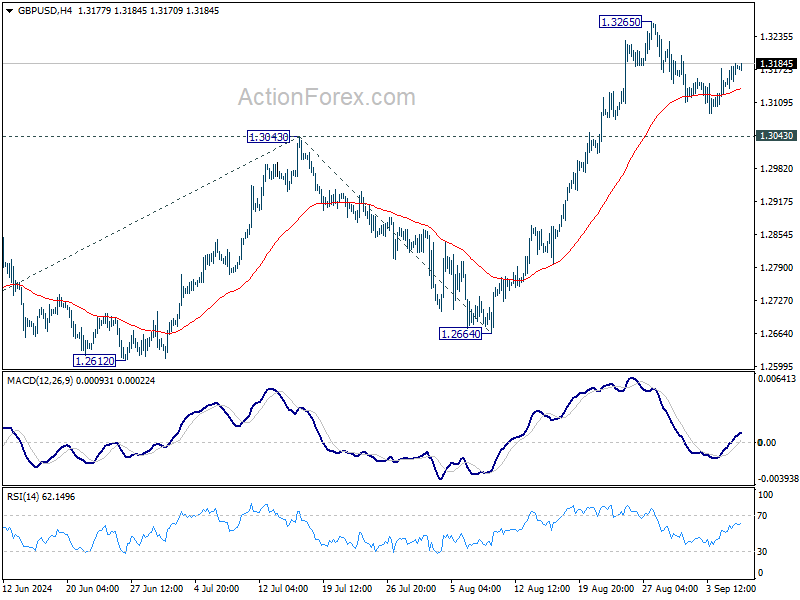
In the bigger picture, up trend from 1.0351 (2022 low) is resuming. Next target is 38.2% projection of 1.0351 to 1.3141 from 1.2298 at 1.3364. For now, outlook will stay bullish as long as 1.2664 support holds, even in case of deep pullback.
It’s P-Day Today
Markets
The ADP job report yesterday produced the same price action seen in the wake of the US manufacturing ISM and US job openings. A below-consensus 99k for August and a downward revision to July’s report delivered another setback to yields. Outperformance at the front caused the 10-yr/2-yr spread to turn positive again only to be reversed after the publication of the August services ISM. Numbers were in line with expectations (headline 51.5 vs 51.4) but it sufficed for the likes of the 2-yr to cap previous losses somewhat. Maturities from 10-yr on finished at or even below the previous intraday lows. It meant the lowest closing level since July 2023. Eventual changes varied from -1.1 bp (2-yr) to -3.8 bps (30-yr). German yields eased 1.5-2.7 bps across the curve. Both data releases caused some intraday dollar volatility as well. The greenback lost ground against most peers. EUR/USD topped 1.11 with the previous YtD high around 1.12 looming. DXY finished just north of 101. USD/JPY’s close (143.45) was the lowest since early January. Oil (Brent $72.7/b, unchanged) wanted to but failed to gain on confirmed rumours that OPEC+ has agreed to delay a plan to gradually restore output due to the recent plunge in prices.
It’s P-day today. The official payrolls report’s importance is difficult to overstate. In the run-up SF Fed president Daly said that the Fed’s job right now is to keep the labour market about where it is now. She doesn’t yet know how big a rate cut is needed though. Goolsbee (Chicago) said he’s seeing mounting warning signs from the labor market and argued for multiple rate cuts soon. The consensus is for a 165k net job growth. Considering the recent developments, we think that’s a high-enough bar. Markets will also eyeball the unemployment rate. There’s a slight decline anticipated to 4.2%. Any miss in expectations - be it in job growth, the unemployment rate or, God forbid, both – will be looked at with Powell’s message of an “unwelcome weakening in the labour market” in mind. A set of disappointing data won’t just settle the debate on a 50 bps rate cut September 18. It will also shape expectations for similar-sized moves on the remaining meetings of this year in the “go fast, go hard” logic used to counter inflation applied to the labour market. Yields risk falling off a cliff, especially after breaking through recent support levels. The next references to look at are 3.55% (March 2023 low) and 3.45% (June 2022 interim high) for the 2-yr. The 10-yr may find some relief around 3.5% (June 2022 interim high). The dollar is prone for steep losses. EUR/USD 1.1139 won’t last long as dollar support. The EUR/USD YtD high of 1.12 serves as intermediate support ahead of 1.1274.
News & Views
At the press conference following Wednesday’s policy decision of the Polish National Bank (NBP), governor Glapinski slightly eased its previous assessment that NBP would only be able to cut interest rates in 2026 at the earliest. He indicated that the NBP could come in a position to start discussing interest rate cuts next year. However for now, the expected path of inflation remains too high. The NBP governor expects inflation to be around 5.0% at the end of the year. In addition, price growth still might increase early next year as measures to shield consumers for price rises will expire. Only when inflation stabilizes and there is a projected decline in the next quarters, the NBP will be able to start discussing rate cuts. Glapinski indicated that such scenario might materialize after Q2 next year. In a positive scenario it might occur after the Mach CPI projections. In any case, he expects a cautious start (25 bps) and the NBP won’t announce an easing cycle already at the time. Glapinski also still sees the government budget as being loose, which is a risk for the disinflation process. EUR/PLN holds at tight range between 4.26 and 4.30.
July data on Japanese household spending published this morning disappointed. Real spending was only 0.1% higher compared to the same month last year. Markets expected a rebound to 1.2% Y/Y. Nominal spending rose 3.3% Y/Y. In a monthly perspective spending even declined 1.7%. Today’s data indicate that Japanese consumers are relucted to spend even as real wages are moving into positive territory. Yesterday, July labour cash earnings data materially surpassed market expectations. For now, we don’t think these data will change the BOJ’s intention to normalize policy further. The yen this morning remains well bid, with USD/JPY (142.55) closing in on the ‘spike’ levels reached at the risk-off early August.
Graphs
GE 10y yield
The ECB cut policy rates by 25 bps in June and will likely do so again in September. Stubborn inflation (core, services) warrants a cautious approach on follow-up moves. Markets price in two to three more cuts for 2024 as disappointing US and unconvincing EMU activity data rolled in, dragging the long end of the curve down. The levels set in the wake of the August market meltdown for the time being serves as support.
US 10y yield
The Fed in its July meeting paved the way for a first cut in September. It turned attentive to risks to the both sides of its dual mandate as the economy is moving to a better in to balance. The pivot weakened the technical picture in US yields. A string of weak eco data pushed and kept the 10-yr sub 4%. Markets increasingly add to 2024 cut bets with more than one jumbo-sized cut gaining traction.
EUR/USD
EUR/USD moved above the 1.09 resistance area as the dollar lost interest rate support at stealth pace. US recession risks and bets on fast and large (50 bps) rate cuts trump traditional safe haven (recessionary) flows into USD. EUR/USD 1.12 was tested but survived. A (technical) dollar comeback had no strong legs. The greenback looks vulnerable.
EUR/GBP
The BoE delivered a hawkish cut in August. Policy restrictiveness will be further unwound gradually on a pace determined by a broad range of data. The strategy similar to the ECB’s balances out EUR/GBP in a monetary perspective. Recent better UK activity data and a cautious assessment of BoE’s Bailey at Jackson Hole are pushing EUR/GBP lower in the 0.84/0.086 range.

Cliff Notes: Consumers on a Tightrope
Key insights from the week that was.
In Australia, Q2 GDP printed broadly as expected at 0.2%qtr (1.0%yr). The themes of recent quarters were once again on display. The consumer remained weak, a 0.2% decline in Q2 leaving aggregate consumption just 0.5% higher than a year ago at June, and 2.0%yr lower on a per capita basis. Elevated inflation, interest rates and a historically-high tax take are increasingly putting household savings in a precarious position; on our estimates, around half of the pandemic savings ‘buffer’ has now been drawn down, and the savings rate held at just 0.6% in Q2. In tandem with weak sentiment, the status quo for income and savings suggests any pick-up in household spending will be gradual at best.
Other parts of the domestic economy were also soft in Q2. Despite rapid population growth and an existing need for additional capacity, new business investment and housing construction only managed to eke out a gain of 0.1%. Public demand continues to provide strong support for GDP growth however, its share of the economy rose to a fresh record high of 27.3%, with further gains likely over coming quarters. In this week’s essay, Chief Economist Luci Ellis puts the latest data in context.
On trade, the current account deficit slid further to –$10.7bn in Q2, in line with Westpac’s bottom-of-the-range forecast. The main surprise was the strength of spending from foreign students, which drove a 6.0% lift in total service exports. Contributions from other areas of the trade account were broadly as expected, service imports consolidating as outbound tourism flows normalised whilst the goods trade surplus narrowed on falling commodity prices and flatlining resource export volumes – a theme still evident in the July data for Australia’s trade in goods.
Before moving offshore, a final note on housing. The latest CoreLogic data continues to highlight a varied picture by capital city, the smaller capital cities of Perth, Adelaide and Brisbane recording solid gains while Sydney remains subdued and Melbourne goes backwards. The lack of sustainable upward momentum in dwelling approvals points to risks for residential construction activity once existing projects are worked through. For more detail on the housing market, see our latest Housing Pulse on Westpac IQ.
Elsewhere, US data was the focus. The ISM manufacturing and non-manufacturing indexes rose by 0.4 and 0.1pts to 47.2 and 51.5 respectively, remaining below their 5-year pre-COVID averages. The market showed particular concern over the surveys’ price measures; however, these indexes are still in line with their 2015-2019 averages, a period when core PCE inflation averaged 1.6%yr and peaked at 2.0%yr. The ISMs meanwhile suggest employment is declining in manufacturing and only edging higher in the service sector. A similar view was provided by the latest Beige Book from the Federal Reserve, with employment assessed as steady overall, but with "isolated reports" of reduced hours and shifts as three districts reported slight activity growth and nine districts no or negative growth.
More constructive was the July JOLTS report. Though job openings fell to 7.673mn, their weakest print since January 2021, the hiring and separation rates were little changed at 3.5% and 3.4%, consistent with pre-pandemic rates – a robust period for job growth.
The shift in risks now openly being discussed by FOMC members has led some market participants to fear a disappointing read for August nonfarm payrolls tonight. Overall though, the labour market data points to a continued moderation in employment growth not a sustained decline. The best response to such a turn of events is steady, confident policy easing, 25bps at a time at successive meetings, all the while noting a willingness to do more if necessary. This is why we expect a 25bp cut at each FOMC meeting from September 2024 to March 2025 and, after that, another cut per quarter to year end, bringing cumulative easing over the cycle to 200bps.
This looks to be the approach being taken by the Bank of Canada in the north, another 25bp cut delivered this week at its September meeting along with clear guidance more easing will follow assuming current trends persist. While GDP growth surprised in Q2, the quarter is assessed to have ended on a weak note. The labour market also continues to slow as excess supply puts "downward pressure on inflation”, limiting the significance of persistence in shelter and some other service prices.
The Data that Could Tip Fed’s Hand
Risk appetite got another hit yesterday after the US ADP report printed a weaker-than-expected number. The data suggested that the US economy added only 99K new private jobs last month, significantly less than 144K pencilled in by analysts, and lower than last month as well, even after the downside revision of last month’s figure to 111K. Job cuts nearly tripled in August. Mini good news is that the labour productivity increased and the unit costs decreased significantly in Q2. All in all, the latest data supports the idea that it’s time for the Federal Reserve (Fed) to start cutting the interest rates. The question is: by how much? It will depend on today’s data – according to many. In the aftermath of soft job openings and ADP reports, the pricing of a 100bp cut for the remainder of the year remains unchanged. But the probability of a 50bp cut in September is gaining traction this week. That probability now stands near 43%, up from a third at the start of the week. The US yields continue to dive and the US dollar gave back two thirds of its latest rebound. The rising Fed cut expectations and the falling yields don’t cheer up stock investors. The S&P500 fell and closed near its 50-DMA, Nasdaq eked out a small gain but remained below its own 100-DMA at the close, while the Dow Jones and Russell 2000 underperformed. Crude oil jumped above the $70pb level on news that OPEC will not relax restrictions for two more months, but couldn’t hold ground at this level and is heading into the much important US jobs figures below this psychological mark.
Many investors believe that today’s job figures could be pivotal in determining whether the Fed will cut rates by 25 or 50 basis points at its meeting later this month. Why this data is so important? Above all, it is because the Fed Chair Jerome Powell said that a further weakness in the jobs market is undesired. That’s obviously a good reason for investors to put a lot of weight on the jobs data.
But from a theoretical perspective, there are two things that make this month’s jobs data more important than the others.
1. The famous Sahm’s rule – which suggests that the economy is already in a recession when the 3-month moving average of the unemployment rate rises by 0.50 percentage points or more above its low point over the previous 12 months - was triggered in July and suggests that the economy is already in a recession – maybe since 2-3 months already. The only time this rule wasn’t right was on Nov 1959 – but a recession arrived 5 month later anyway.
2. A research paper published by the Fed’s very own Chris Waller argues that once the job vacancy rate falls to the pre-pandemic level of 4.6%, the unemployment rate would rise to 4.5%. And that line was crossed on Wednesday, when the JOLTS report showed the vacancy rate declining to 4.56% in July.
If history is any indication, the US jobs market and the economy could be in trouble. Data-wise, there is evidence of slowing growth, but market mood swings between two extremes – optimism of soft-landing and pessimism of an ugly recession – very fast after important data. Therefore risks are two-sided.
In numbers, the US economy is expected to have added around 164K new nonfarm jobs last month, that’s not a great number but that would be better than the 114K printed a month earlier. The unemployment rate, on the other hand, is expected to improve from 4.3% to 4.2% and the wages may have grown slightly faster. Frankly, there is still a chance that the August data beats the soft market expectations, in which case we could see the US yields and the dollar rebound and equities, oil close the week on a positive note. But another month of disappointment will likely boost the pricing of a 50bp cut in September, further weigh on US yields, the dollar and probably on equities and oil as well.