Sample Category Title
Finally, It Is NFP Time
In focus today
The most important data release of the week and a pivotal reading ahead of the September rate decisions will be the US August Jobs Report, due for release 14.30 CET today. We expect nonfarm payrolls growth to rebound to +170k after a weaker reading in July (+114k), unemployment rate to remain steady at 4.3% and average hourly earnings growth to continue at +0.2% m/m SA. After the release, FOMC key figures Waller and Williams are scheduled to speak, providing a prompt update on the Fed's perspective following the report.
In the euro area, we receive wage growth data for Q2 2024, measured as compensation per employee. The data is key input for the ECB's assessment of underlying inflation pressure. We expect wage growth to come in lower than the ECB's staff projections from June as the previously received negotiated wages indicator saw a large decline to 3.6% y/y in Q2 from 4.7% in Q1.
Early Monday morning, China releases CPI and PPI inflation for August. CPI is expected to rise to 0.7% y/y from 0.5% y/y mainly driven by food prices, while core should remain around 0.5% y/y reflecting overall weak demand. We look for PPI inflation to fall below -1% y/y from -0.8% y/y in July following the latest decline in commodity prices.
Economic and market news
What happened overnight
In Japan, household spending for July was much weaker than expected at -1.7% m/m SA and 0.1% y/y (cons: -0.2% m/m SA, 1.2% y/y). This decline in consumption, which makes up over half of economic output, could likely complicate the Bank of Japan's plans to raise interest rates going forward.
What happened yesterday
In the US, the streak of weaker-than-expected labour market releases continued, as ADP came in below expectations at 99k (cons: 145k), driven by a 16k decline in "professional and business services". July figures were also revised down. The reading aligns with the Challenger report, which showed an uptick in August layoffs, largely attributed to the tech sector.
The ISM non-manufacturing PMI was little changed at 51.5 in July (prior: 51.4, cons: 51.1), spurred by new orders and prices paid. This suggests that growth in the services sector business activity has remained solid. The final PMI data, also released yesterday, supported a similar picture. Akin to the recent labour market cooling, the ISM employment PMI fell to 50.2 from 51.1.
In the presidential election, Democratic candidate, Kamala Harris, had raised USD 300m in August, double that of Republican Donald Trump, according to NBC news. With the election approaching, we published our first US election monitor highlighting some of the key development in the presidential race. Until the election on 5 November, we plan to frequently update the monitor. For more details, please see US Election Monitor - Latest data shows Harris in a narrow lead, 6 September.
In the euro area, retail sales increased 0.1% m/m SA in July after falling 0.4% in June, showcasing that consumers remain reluctant with spending despite high employment and rising real incomes. While weak confidence is still weighing on consumption growth, we expect to see gradual improvement towards next year.
In France, Michel Barnier has been appointed as new French prime minister (PM). Having represented the EU in the Brexit talks and previously served as EU Commissioner and in various French governments, his appointment is a step towards more stable French politics. That said, there is no guarantee of success, as Barnier still risks losing a no-confidence vote in the National Assembly. Additionally, the government coalition is yet to be formed, with a highly fragmented new parliament.
In commodities space, OPEC+ announced that eight members of the cartel will extend their voluntary output cuts by two months, after oil prices have slumped in recent days.
Equities: Global equities fell again yesterday. However, there was a notable change in sentiment and market rotation during the US session. Cyclicals performed best in the US, primarily driven by a further lift in Tesla, with consumer discretionary leading the advances. The heavyweight stock is up 12% over the last five trading days. In Europe, defensives still outperformed, though not to the same extent as seen in the previous two days. In the US yesterday, the Dow was down -0.5%, the S&P 500 was down -0.3%, Nasdaq was up +0.3%, and the Russell 2000 was down -0.6%. Asian markets are very mixed this morning, with South Korea and Taiwan moving in opposite directions. Futures in Europe and the US are mostly lower, with tech/growth sectors dragging down.
FI: Yields traded sideways through most of yesterday's session as markets held their breath for today's US jobs report. The German curve was marginally lower across tenors, with the bulk of the action occurring in the afternoon following a series of mixed signals from US data: The ADP job creation came out to the soft side in August (actual: 99k, consensus: 145k), while the Services ISM saw stronger-than-expected new orders (actual: 53.0, consensus: 51.9). President Macron's nomination of Michel Barnier as the next French Prime Minister led to a slight tightening in the 10Y OAT-Bund spread by a few basis points, now at 70bp. Barnier's first task will be to gather support for the budget, which will likely be very challenging task.
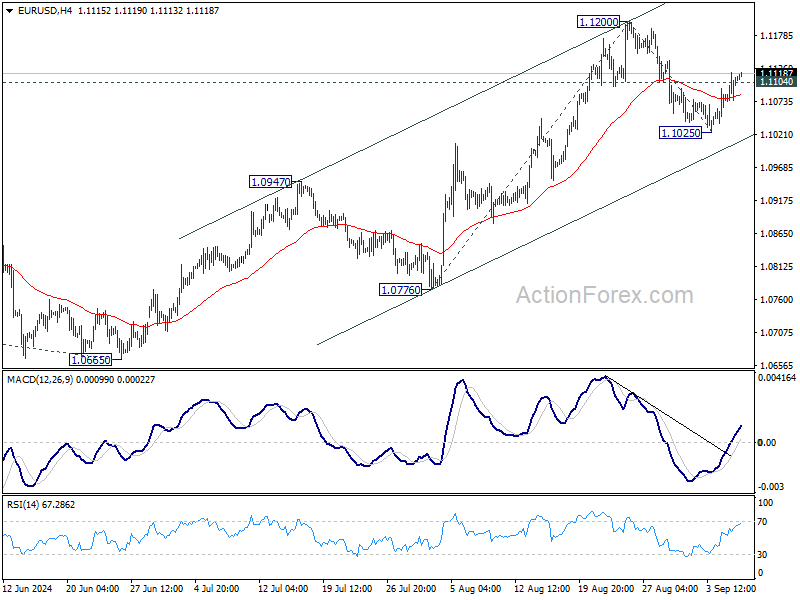
FX: EUR/USD rose towards 1.11 during yesterday's session with all eyes on the US jobs report released at 14:30 CET today. If our NFP forecast is correct, we could see the momentum of a stronger USD continue. However, the USD may face downward pressure in the coming month as the Fed initiates its cutting cycle, and risk sentiment could remain positive.
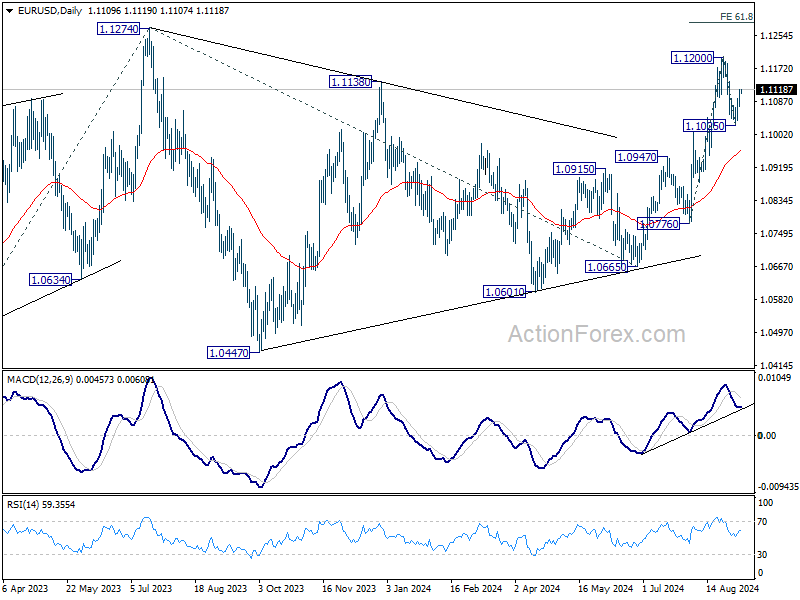
EUR/USD Daily Outlook
Daily Pivots: (S1) 1.1084; (P) 1.1102; (R1) 1.1129; More....
EUR/USD's break of 1.1104 minor resistance suggests that pullback from 1.1200 has completed at 1.1025 already. Intraday bias is back on the upside for retesting 1.1200 first. Firm break there will resume larger rally and target 61.8% projection of 1.0776 to 1.1200 from 1.1025 at 1.1287. However, break of 1.1025 support will resume the fall from 1.1200 instead.
In the bigger picture, prior break of 1.1138 resistance indicates that corrective pattern from 1.1274 has completed at 1.0665 already. Decisive break of 1.1274 (2023 high) will confirm whole up trend from 0.9534 (2022 low). Next target will be 61.8% projection of 0.9534 to 1.1274 from 1.0665 at 1.1740. This will now be the favored case as long as 1.0947 resistance turned support holds.
Markets Brace for NFP Impact as Yen Rally Gains Momentum
The financial markets are in a state of heightened anticipation as the much-awaited US non-farm payroll report is set to release today. This key data set will be critical in assessing whether the US economy is veering towards a recession, following the jump in the unemployment rate in July. For Fed, the NFP data will play a significant role in determining the size of the upcoming rate cut as the start of its policy easing cycle, which is expected at the FOMC meeting later this month. However, market reactions could be complex and volatile, as shifting dynamics between stocks, bond yields, and currencies may generate counteracting movements.
Dollar saw broad weakness overnight, but the selloff was tempered by ISM services PMI report, which indicated that the services sector remains in modest growth territory. As of now, Dollar and British Pound are positioned in the middle of the week's performance chart. On the other hand, Japanese Yen is staying as the strongest performer, supported by declining US and European benchmark yields. Yen also extended its rally during today's Asian trading session. Close behind are Swiss Franc and Euro. Meanwhile, Australian Dollar sits at the bottom of the performance ladder, followed by New Zealand Dollar and Canadian Dollar, signaling a cautious and risk-averse market atmosphere.
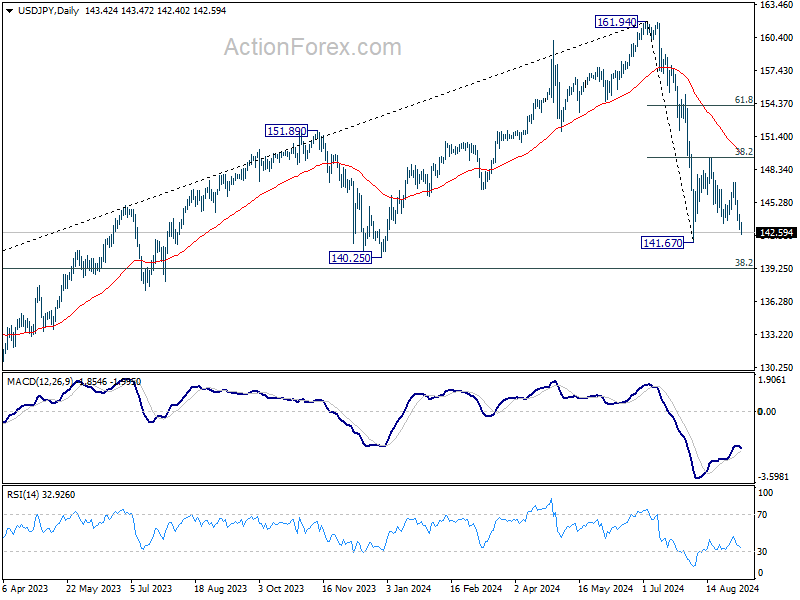
Technically, USD/JPY would be eyeing 141.67 support if current decline continues. Break there will resume whole decline from 161.94. But an important zone around 140 lies ahead with 140.25 support, as well as 38.2% retracement of 102.58 to 161.94 at 139.26. So, downside potential might be relatively limited. Yet, decisive break of 140 would risk deeper acceleration in the selloff.
In Asia, at the time of writing, Nikkei is down -0.07%. Hong Kong HSI is down -0.07%. China Shanghai SSE is down -0.44%. Singapore Strait Times is flat. Japan 10-year JGB yield is down -0.0173 at 0.858. Overnight, DOW fell -0.54%. S&P 500 fell -0.30%. NASDAQ rose 025%. 10-year yield fell -0.037 to 3.731.
Fed's Goolsbee signals multiple rate cuts as labor market weakens
In an interview with MarketWatch, Chicago Fed President Austan Goolsbee indicated that the current economic data justifies multiple interest rate cuts, with the process beginning soon.
Goolsbee pointed out that inflation is coming down "very significantly," while the unemployment rate is "rising faster," suggesting a cooling labor market.
He expressed concern that the persistent weakness in the job market could "turn into something worse" if the trend continues.
Given the balance of more favorable inflation data and deteriorating unemployment figures, Goolsbee suggested that the path forward is "not just rate cuts soon," hinting at a sustained easing cycle by Fed.
Japan's household spending rises only 0.1% in Jul, lagging expectations despite wage growth
Japan's household spending edged up by 0.1% yoy in July, falling well short of the expected 1.2% yoy increase. While this marked the first annual rise in three months, the modest growth suggests that households are still holding back on spending due to inflationary pressures.
The increase was driven by a 17.3% yoy surge in housing outlays, with more people undertaking home renovations such as installing new kitchens and bathtubs, according to the Ministry of Internal Affairs and Communications. Entertainment spending also grew by 5.6% yoy, supported by purchases of televisions for the Paris Olympics. Expenditures on domestic and overseas package tours saw significant jumps of 47.0% yoy and 62.6% yoy, respectively.
Despite the tepid spending growth, the average monthly income of salaried households with at least two people rose by 5.5% yoy in real terms, marking the third consecutive monthly increase after 3.1% yoy and 3.0% yoy gains in June and May.
A ministry official noted that "spending has not increased as much as wages grew," suggesting that some households might be saving part of their higher incomes. The ministry plans to continue monitoring how rising wages impact consumption going forward.
US NFP in focus as Fed's rate cut decision hangs in the balance
Today's US non-farm payroll report is crucial for all market participants, as it could determine the size of Fed's expected rate cut this month. Currently, fed fund futures are pricing in 43/57% chance of a 25/50 bps reduction. Market reaction to NFP will also likely set the trading tone for the remainder of the quarter.
Economists expect job growth of 163k in August, with the unemployment rate forecasted to tick down from 4.3% to 4.2%. Average hourly earnings are projected to increase by 0.3% mom, indicating solid wage growth.
Recent economic data offers a mixed outlook. ISM Manufacturing Employment rose to 46.0 from 43.4, but the ISM Services Employment fell to 50.2 from 51.1. Meanwhile, ADP Employment report showed a disappointing 99k new jobs, down from July's 111k. Initial unemployment claims averaged 230k over four weeks, down from last month's 240k.
A key data point to watch will be the unemployment rate. Last month's unexpected rise to 4.3% triggered the "Sahm Rule," a reliable recession indicator. If the unemployment rate doesn't fall as expected, or worse, increases further, it could signal deeper labor market troubles. This scenario might prompt Fed to take pre-emptive action with a 50 bps rate cut at the upcoming FOMC meeting. Yet, markets' bearish reaction could overwhelm Fed cut optimism.
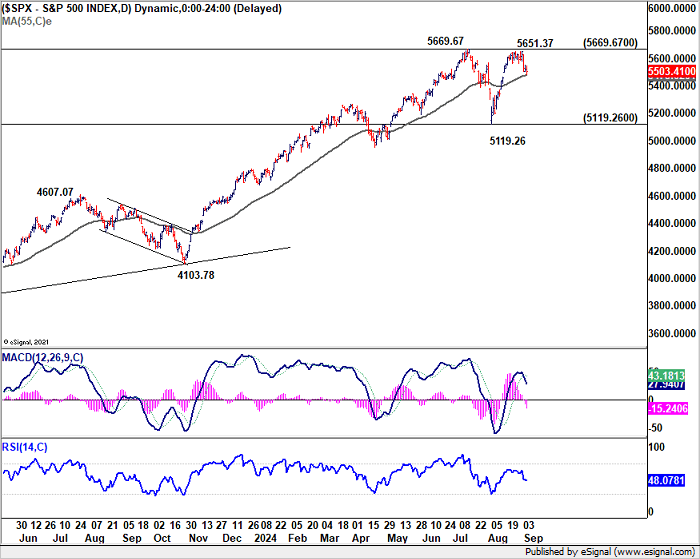
The stock markets' reaction to NFP today is worth high attention. S&P 500 top at 5651.37, just ahead of 5669.67 historical high. On the downside, decisive break of 55 D EMA (now at 5475.02) will argue that rebound from 5119.26 has completed. Corrective pattern from 5669.67 should have then started the third leg. In this case, deeper fall would be seen to wards 5119.26 support again.
But of course, strong bounce from 55 D EMA would set the stage for breaking through 5669.67 to resume the long term up trend, sooner rather than later.
Elsewhere
Germany industrial production and trade balance, France industrial production and trade balance; Swiss foreign currency reserves, and Eurozone GDP revision will be released in European session. Later in the day, Canada will also publish job data, along with US NFP.
EUR/USD Daily Outlook
Daily Pivots: (S1) 1.1084; (P) 1.1102; (R1) 1.1129; More....
EUR/USD's break of 1.1104 minor resistance suggests that pullback from 1.1200 has completed at 1.1025 already. Intraday bias is back on the upside for retesting 1.1200 first. Firm break there will resume larger rally and target 61.8% projection of 1.0776 to 1.1200 from 1.1025 at 1.1287. However, break of 1.1025 support will resume the fall from 1.1200 instead.
In the bigger picture, prior break of 1.1138 resistance indicates that corrective pattern from 1.1274 has completed at 1.0665 already. Decisive break of 1.1274 (2023 high) will confirm whole up trend from 0.9534 (2022 low). Next target will be 61.8% projection of 0.9534 to 1.1274 from 1.0665 at 1.1740. This will now be the favored case as long as 1.0947 resistance turned support holds.
Economic Indicators Update
| GMT | Ccy | Events | Actual | Forecast | Previous | Revised |
|---|---|---|---|---|---|---|
| 23:30 | JPY | Overall Household Spending Y/Y Jul | 0.10% | 1.20% | -1.40% | |
| 05:00 | JPY | Leading Economic Index Jul P | 109.5 | 109.4 | 109 | |
| 06:00 | EUR | Germany Industrial Production sM/M Jul | -0.20% | 1.40% | ||
| 06:00 | EUR | Germany Trade Balance (EUR) Jul | 21.2B | 20.4B | ||
| 06:45 | EUR | France Trade Balance (EUR) Jul | -5.7B | -6.1B | ||
| 06:45 | EUR | France Industrial Output M/M Jul | -0.20% | 0.80% | ||
| 07:00 | CHF | Foreign Currency Reserves (CHF) Aug | 704B | |||
| 09:00 | EUR | Eurozone GDP Q/Q Q2 | 0.30% | 0.30% | ||
| 12:30 | USD | Nonfarm Payrolls Aug | 163K | 114K | ||
| 12:30 | USD | Unemployment Rate Aug | 4.20% | 4.30% | ||
| 12:30 | USD | Average Hourly Earnings M/M Aug | 0.30% | 0.20% | ||
| 12:30 | CAD | Net Change in Employment Aug | 25.0K | -2.8K | ||
| 12:30 | CAD | Unemployment Rate Aug | 6.50% | 6.40% | ||
| 14:00 | CAD | Ivey PMI Aug | 55.3 | 57.6 |
US NFP in focus as Fed’s rate cut decision hangs in the balance
Today's US non-farm payroll report is crucial for all market participants, as it could determine the size of Fed's expected rate cut this month. Currently, fed fund futures are pricing in 43/57% chance of a 25/50 bps reduction. Market reaction to NFP will also likely set the trading tone for the remainder of the quarter.
Economists expect job growth of 163k in August, with the unemployment rate forecasted to tick down from 4.3% to 4.2%. Average hourly earnings are projected to increase by 0.3% mom, indicating solid wage growth.
Recent economic data offers a mixed outlook. ISM Manufacturing Employment rose to 46.0 from 43.4, but the ISM Services Employment fell to 50.2 from 51.1. Meanwhile, ADP Employment report showed a disappointing 99k new jobs, down from July's 111k. Initial unemployment claims averaged 230k over four weeks, down from last month's 240k.
A key data point to watch will be the unemployment rate. Last month's unexpected rise to 4.3% triggered the "Sahm Rule," a reliable recession indicator. If the unemployment rate doesn't fall as expected, or worse, increases further, it could signal deeper labor market troubles. This scenario might prompt Fed to take pre-emptive action with a 50 bps rate cut at the upcoming FOMC meeting. Yet, markets' bearish reaction could overwhelm Fed cut optimism.
The stock markets' reaction to NFP today is worth high attention. S&P 500 top at 5651.37, just ahead of 5669.67 historical high. On the downside, decisive break of 55 D EMA (now at 5475.02) will argue that rebound from 5119.26 has completed. Corrective pattern from 5669.67 should have then started the third leg. In this case, deeper fall would be seen to wards 5119.26 support again.
But of course, strong bounce from 55 D EMA would set the stage for breaking through 5669.67 to resume the long term up trend, sooner rather than later.
Japan’s household spending rises only 0.1% in Jul, lagging expectations despite wage growth
Japan’s household spending edged up by 0.1% yoy in July, falling well short of the expected 1.2% yoy increase. While this marked the first annual rise in three months, the modest growth suggests that households are still holding back on spending due to inflationary pressures.
The increase was driven by a 17.3% yoy surge in housing outlays, with more people undertaking home renovations such as installing new kitchens and bathtubs, according to the Ministry of Internal Affairs and Communications. Entertainment spending also grew by 5.6% yoy, supported by purchases of televisions for the Paris Olympics. Expenditures on domestic and overseas package tours saw significant jumps of 47.0% yoy and 62.6% yoy, respectively.
Despite the tepid spending growth, the average monthly income of salaried households with at least two people rose by 5.5% yoy in real terms, marking the third consecutive monthly increase after 3.1% yoy and 3.0% yoy gains in June and May.
A ministry official noted that "spending has not increased as much as wages grew," suggesting that some households might be saving part of their higher incomes. The ministry plans to continue monitoring how rising wages impact consumption going forward.
Fed’s Goolsbee signals multiple rate cuts as labor market weakens
In an interview with MarketWatch, Chicago Fed President Austan Goolsbee indicated that the current economic data justifies multiple interest rate cuts, with the process beginning soon.
Goolsbee pointed out that inflation is coming down "very significantly," while the unemployment rate is "rising faster," suggesting a cooling labor market.
He expressed concern that the persistent weakness in the job market could "turn into something worse" if the trend continues.
Given the balance of more favorable inflation data and deteriorating unemployment figures, Goolsbee suggested that the path forward is "not just rate cuts soon," hinting at a sustained easing cycle by Fed.
When the Rear-View Mirror is Foggy, Triangulate
Forecasting is hard when even the past does not stand still.
Local markets were heavily focused this week on the June quarter national accounts. Our note (PDF 712KB) on the subject highlighted the key points. Foremost amongst these is that despite strong population growth, private sector demand is stagnant. Household consumption went backwards in the quarter, which was weaker than even we expected. Public demand did all the heavy lifting on growth, as it has done for the past few quarters.
When all the detail is fully combed over, we can still take some overarching lessons. The first is the simple fact that these data are for the June quarter. We are now in the final month of the September quarter. This is the proverbial ‘rear-view mirror’. The data have information value, but much of the focus should be on what they tell us about the near-term outlook and economic behaviour more broadly.
The consumption data are a good illustration of that lesson. As noted, the outcome was weaker than even we expected. This is not because households had boosted their saving. The household saving ratio remained unusually low, at 0.6%. Rather, household incomes were still being squeezed to some extent. While real household disposable income is no longer declining in year-ended terms, it was still down 4.7% since the peak in September quarter 2021. In per capita terms, real incomes are down a whopping 10.3% over this period.
The implications for the future are that any tendency to catch up on consumption as tax cuts boost income will be tempered by some reversion in saving to rates more like those seen in the past. There is no iron law that the saving rate must revert to some centre of gravity, and in any case, it is prone to revisions. However, the arithmetic of compulsory (and rising) superannuation contributions and contractual repayments of principal on mortgages implies that saving rates cannot remain at ultra-low levels forever.
This is especially important given that the Stage 3 tax cuts took effect after the period recorded in the latest national accounts. Most observers (including us) are working on the assumption that the extra income will support a pick-up in consumption growth. Given the latest data, though, especially the renewed drag from tax, it looks as though the risks here are to the downside.
The second lesson is that even the past does not stand still. As highlighted in the team’s note on Wednesday, the latest national accounts included significant revisions to the profile for investment for previous quarters. And the hours worked data – so crucial to estimates of productivity – have been revised significantly, though the revisions have differed in the labour force survey (LFS) versus the national accounts.
The third lesson is to be mindful of noise, shifting seasonality and artefacts of measurement. The productivity data are a case in point. Never mind that productivity growth in the market sector was a not-too-shabby 1.1% over the year. Those minded to catastrophise about Australia’s productivity performance will focus on the quarterly fall, as hours worked was strong in the quarter despite weak GDP growth. Yet average earnings per hour worked was also weak, leaving growth in unit labour costs over the past couple of quarters at a less concerning annualised rate of 3.4% – in line with the outcomes recorded over 2019 when underlying inflation was below the target range. The resolution might be found by recalling the distinction between hours worked and hours paid. One area where seasonal patterns seem to have shifted in a lasting way post-pandemic has been the pattern of leave-taking. We note that June quarter outcomes for growth in hours worked have been systematically stronger than surrounding quarters over the post-pandemic years, even more so for the LFS than the national accounts.
Conventional methods of seasonal adjustment struggle in those situations. Looking at year-ended data smooths out these lingering seasonal issues to some extent, but if seasonal patterns are shifting, some noise remains. If shifting seasonality in leave-taking is indeed the culprit, though, then the noise in hours worked will be largely offset by surprises on average earnings per hour in the opposite direction.
What to do under these circumstances, when even the past is hard to predict?
One helpful approach is to triangulate across multiple data sets. A good example of the value of this approach comes from the large revisions to US payrolls data last month. This was less of a surprise to us than it was to some observers because we had already seen signs of fragility in other US labour market data, including the household survey and other business surveys.
Another helpful triangulation is to use the discrepancies between different data sources as information themselves. Since Australia’s international borders reopened, growth in hours worked in the national accounts has grown faster than the LFS measure. This is because temporary residents are counted in the former but not the latter. (So are defence personnel and the under-15s, but we do not think they are driving the result.)
We can use this fact to help shape our view of the outlook: given that much of the recent strength in population growth appears to be catch-up after the borders reopened, growth rates will eventually ease. And so too will the outsized contribution of additional temporary residents. Growth in national accounts hours worked will therefore likely converge back to its LFS counterpart.
This is yet another reason to believe that Australia is not unique. While there will be bumps along the way – including a drag from the expansion in the care economy – the recent past for productivity need not imply a stagnant future.
USD/JPY Extends Losses, US NFP Report Next
Key Highlights
- USD/JPY extended losses and traded below the 145.00 level.
- It traded below a key bullish trend line with support at 144.80 on the 4-hour chart.
- EUR/USD is attempting a fresh increase above the 1.1100 resistance.
- Oil prices are consolidating losses near the $69.50 level.
USD/JPY Technical Analysis
The US Dollar failed to climb above the 147.20 level against the Japanese Yen. USD/JPY started another decline below the 146.50 and 146.00 levels.
Looking at the 4-hour chart, the pair traded below a key bullish trend line with support at 144.80. There was a move below the 76.4% Fib retracement level of the upward move from the 143.44 swing low to the 147.20 high.
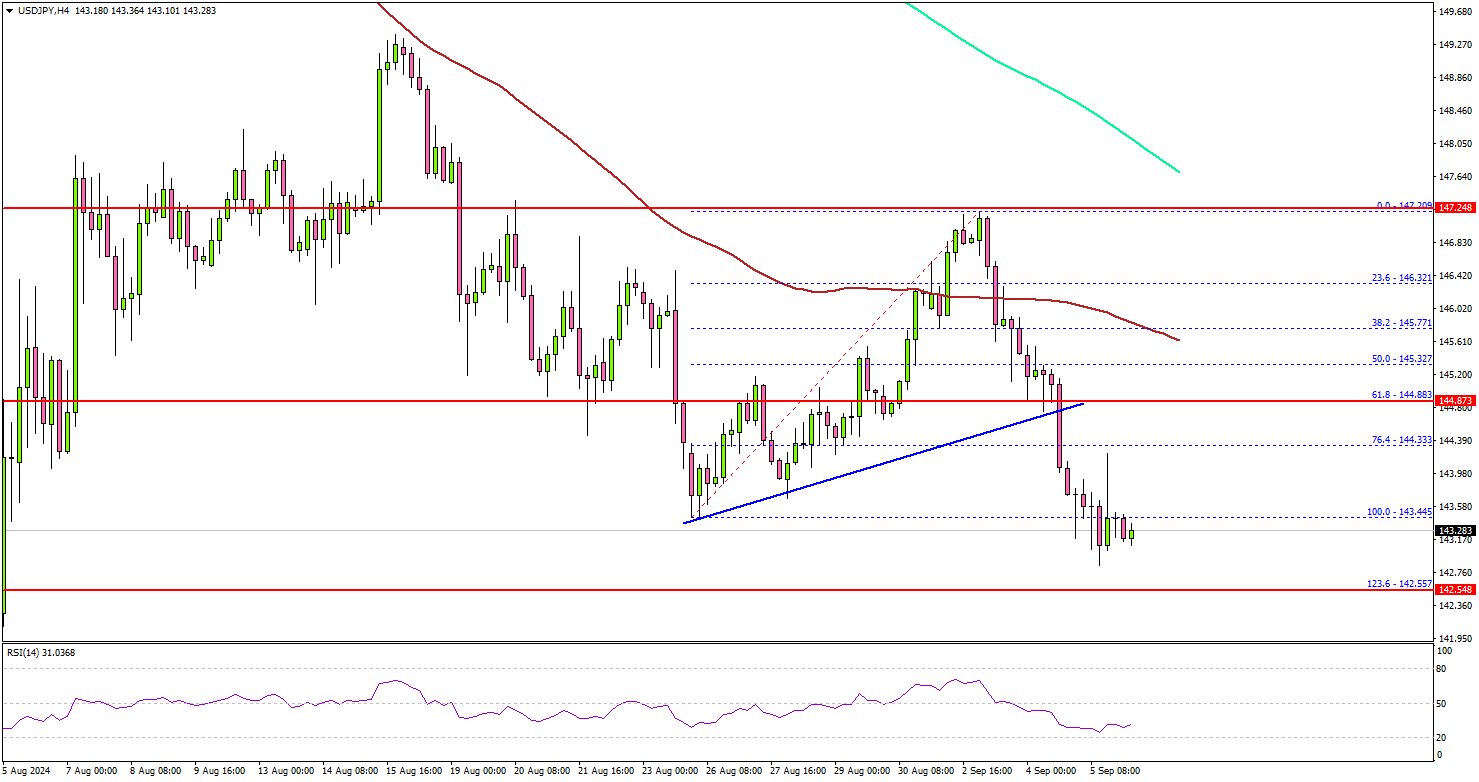
The pair is now trading well below the 100 simple moving average (red, 4-hour) and the 200 simple moving average (green, 4-hour). On the downside, immediate support sits near the 143.00 level.
The next key support sits near the 142.50 level. It is close to the 1.236 Fib extension level of the upward move from the 143.44 swing low to the 147.20 high. The main support is now forming near 142.00. A downside break below the 142.00 level could set the pace for a larger decline. The next major support is near the 140.00 level.
On the upside, the pair could face resistance near the 143.80 level. The next key resistance sits near the 144.80 level. A clear move above the 144.80 level could set the pace for a move toward the 100 simple moving average (red, 4-hour) at 145.50. Any more gains might call for a test of the 147.00 zone.
Looking at EUR/USD, the pair found support and recently started a fresh increase above the 1.1100 resistance zone.
Upcoming Economic Events:
- US nonfarm payrolls for August 2024 – Forecast 180K, versus 98K previous.
- US Unemployment Rate for August 2024 - Forecast 4.2%, versus 4.3% previous.
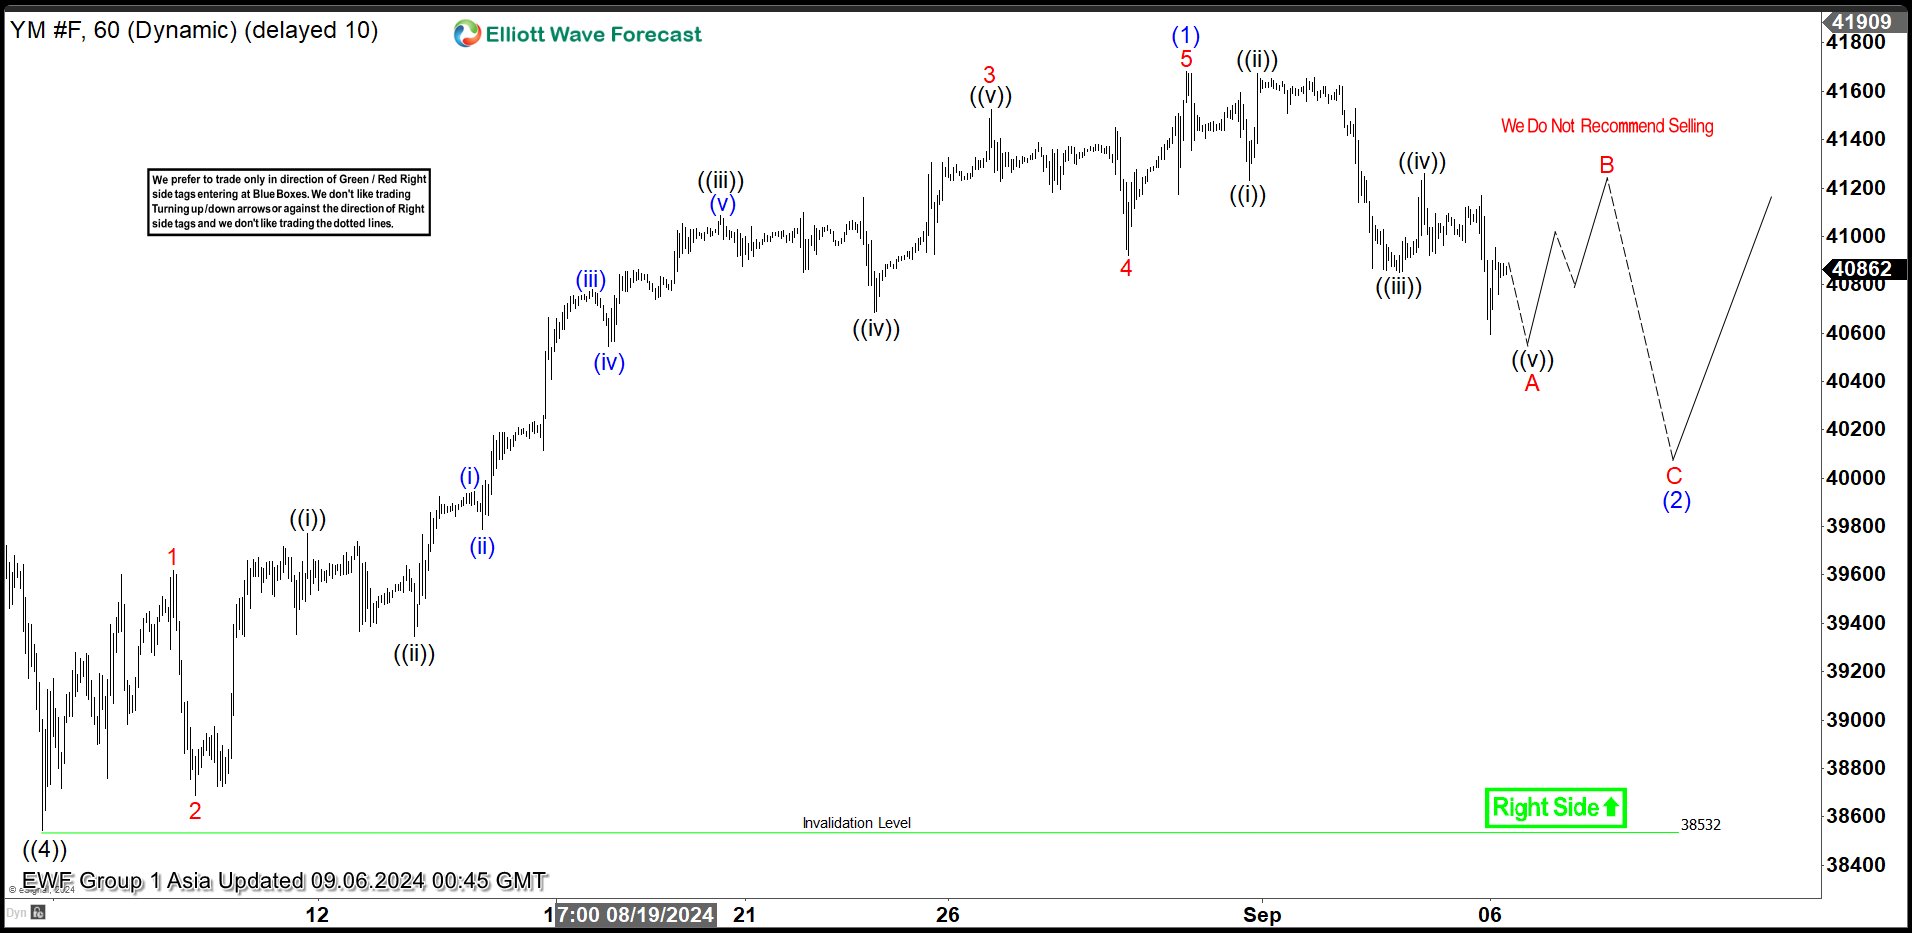
Intraday Elliott Wave Expects Further Correction in Dow Futures (YM)
Short Term Elliott Wave in Dow Futures (YM) suggests that pullback to 38532 low on 8.5.2024 ended wave ((4)). The Index then turned higher and made a new all-time high in wave ((5)) as an impulse. Up from wave ((4)), wave 1 ended at 39619 and wave 2 pullback ended at 38689. The Index then extended higher in a nesting impulse with wave ((i)) ended at 39770 and dips in wave ((ii)) ended at 39344. Wave ((iii)) higher ended at 41085 and pullback in wave ((iv)) ended at 40684. Last leg wave ((v)) ended at 41523 which completed wave 3. Pullback in wave 4 ended at 40920 and wave 5 higher ended at 41682. This completed wave (1) of ((5)).
Index is now correcting cycle from 8.5.2024 low in wave (2) of ((5)). Down from wave (1), wave ((i)) ended at 41231 and wave ((ii)) rally ended at 41674. Wave ((iii)) lower ended at 40854 and wave ((iv)) ended at 41260. Expect wave ((v)) of A to end soon, then it should rally in wave B to correct cycle from 8.30.2024 high before it turns lower again in wave C of (2). Near term, as far as pivot at 38532 low stays intact, expect pullback to find buyers in 3, 7, or 11 swing for further upside.
Dow Futures (YM) 60 Minutes Elliott Wave Chart
YM Elliott Wave Video
https://www.youtube.com/watch?v=tuV19WO969M
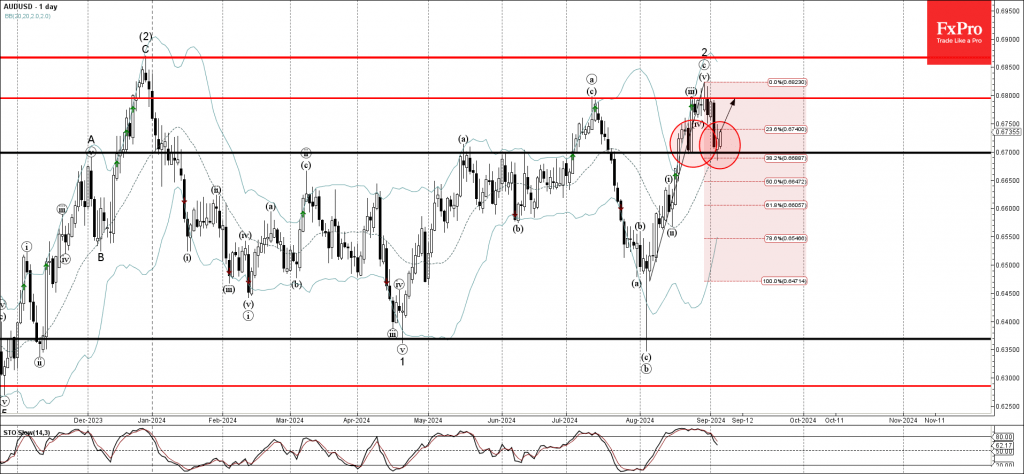
AUDUSD Wave Analysis
- AUDUSD reversed from support level 0.6700
- Likely to rise to resistance level 0.6800
AUDUSD currency pair recently reversed up from the support level 0.6700 (which also reversed the price at the end of August) standing near the 20-day moving average.
The support level 0.6700 was further strengthened by the 38.2% Fibonacci correction of the sharp upward impulse C from the start of August.
Given the strength of the support level 0.6700, AUDUSD currency pair can be expected to rise further to the next resistance level 0.6800 (which stopped the previous waves a, iii and 2).