Sample Category Title
USDCHF Eyes August’s Low as Bears Stay in Charge
- USDCHF trims latest rebound, holds bearish trend ahead of US data
- Short-term bias skewed to the downside; bears wait for a move below 0.8435
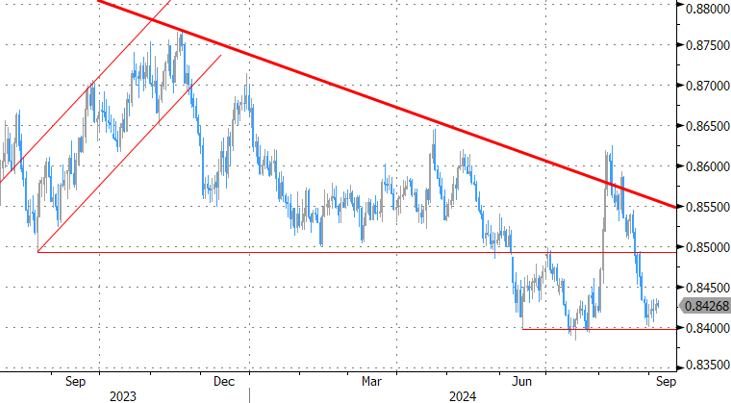
USDCHF has been stuck in a downward trend since April’s peak of 0.9223, unable to sustain any bullish corrections. More recently, following its bounce from an eight-month low of 0.8398, the price is once again subject to downward pressure.
With the RSI hovering well below its 50 neutral mark and the stochastic oscillator having peaked in the overbought zone, there is little hope for a meaningful rally.
A step below 0.8435 might re-examine the 0.8400 round level, which the bears could not successfully claim in August. If that base collapses this time, the price might next head for the December 2023 trough of 0.8330. A violation there could significantly worsen the broader outlook, opening the door for the 2015 bottom of 0.8200.
If the pair manages to drift higher, resistance could initially emerge between the 20-day simple moving average (SMA) and the 23.6% Fibonacci retracement of the April-August downtrend at 0.8593. A victory there could bolster buying appetite, lifting the price rapidly to the 38.2% Fibonacci number of 0.8713. Note that the 50-day SMA is within the neighborhood. Therefore, a breakthrough above it may result in a quick rally towards the 50% Fibonacci level of 0.8811 and the 200-day SMA.
Overall, USDCHF is in a bearish trend and could face additional losses if the 0.8435 region is breached.
Bitcoin Slides and Gits the 56,200 Support
- Bitcoin has been declining since August 26
- The bigger picture points to a broadening formation
- Oscillators imply further declines within the pattern
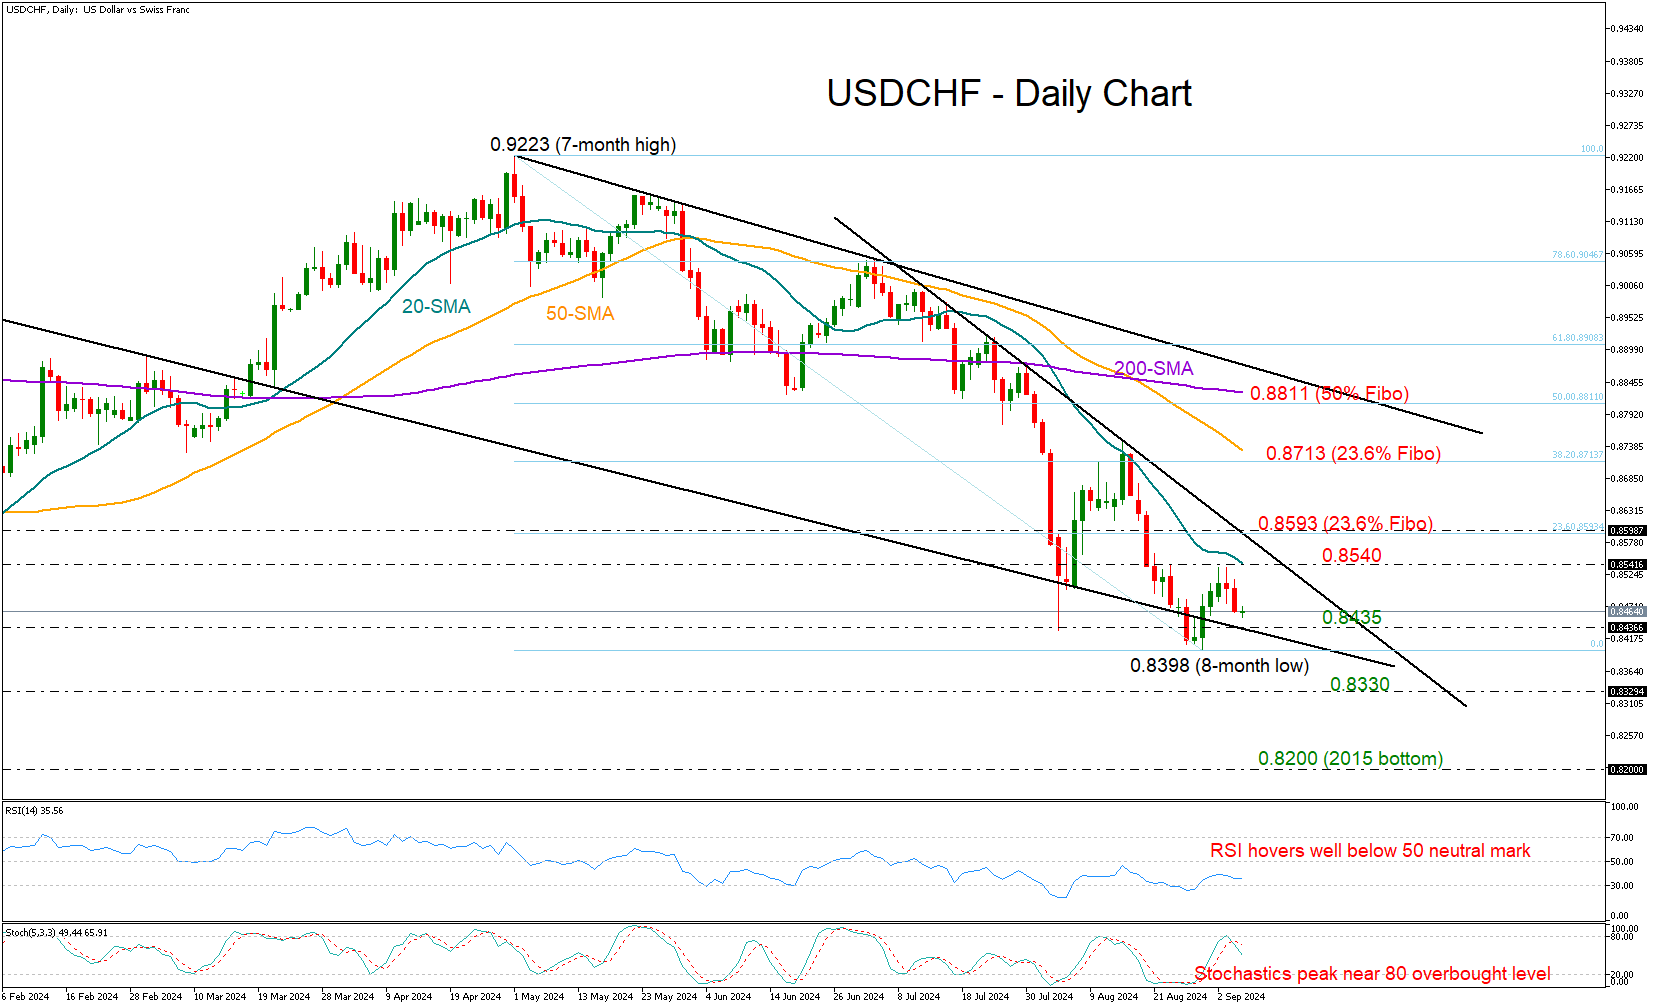
BTCUSD has been sliding lately, after hitting resistance near the 64,700 zone on August 24 and 26. The crypto king dropped below the key support (now turned into resistance) zone of 61,600 and found support slightly below 56,200 yesterday. In the bigger picture, bitcoin has been trading within a broadening formation since March 13, implying a neutral medium-term outlook.
The short-term oscillators are detecting bearish momentum, suggesting that some further declines may be possible. The RSI is lying below the 50 equilibrium line, pointing down, while the MACD is running below both its zero and trigger lines.
If the bears are willing to stay in the driver’s seat and push the action below 56,200, they may decide to take the battle all the way down to the 50,500 zone. However, there could still be a chance for a strong rebound from there, as the price would still be within the aforementioned broadening pattern.
On the upside, a return above 61,600 could aim for the 64,700 zone, where a break would confirm a higher high and pave the way towards the upper bound of the broadening formation or the 70,700 zone. If the bulls do not stop there, a break higher could see scope for extensions towards the record high of 73,803, hit on March 14.
To recap, bitcoin has been sliding lately, but with the price action remaining within a broadening pattern. Even if further declines occur, as long as the formation stays intact, the broader outlook could be considered neutral.
GBPJPY Continues Selling Interest Below 190.00
- GBPJPY stands beneath 200-day SMA
- Momentum oscillators look neutral-to-bearish
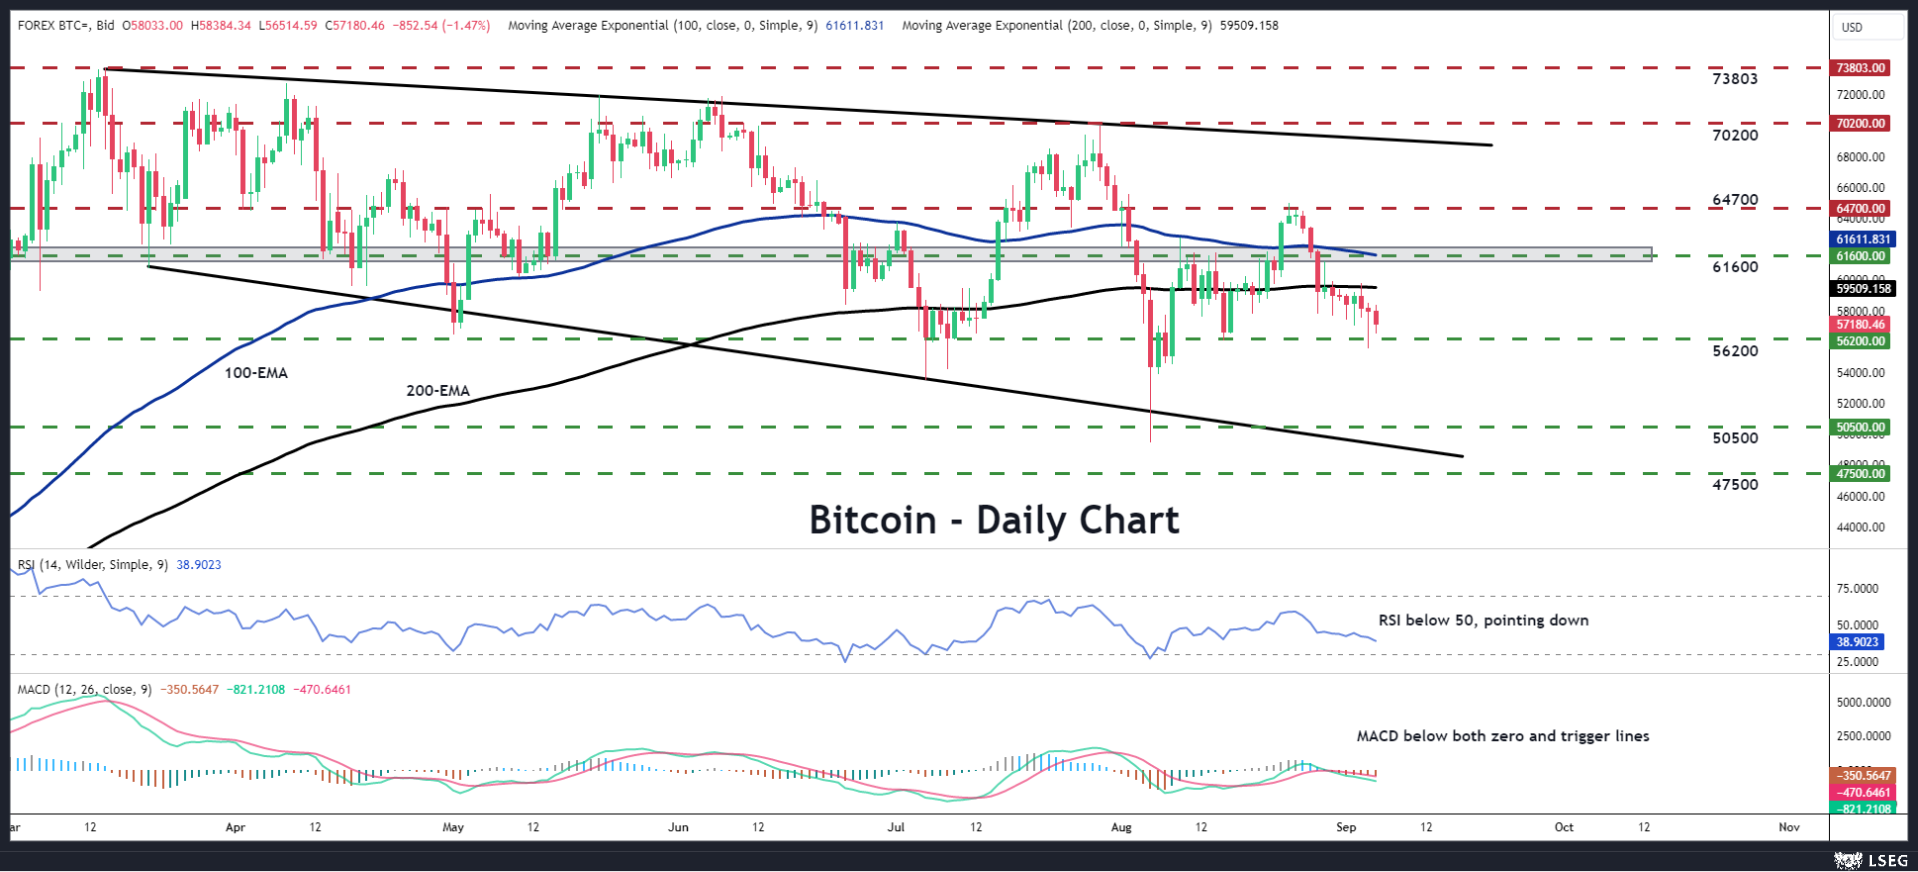
GBPJPY has been in a considerably descending movement, losing around 3% after it topped at 193.50. The market is currently testing the 188.00 round number with the technical oscillator confirming strong bearish tendency in the short-to-medium-term view. The stochastic plunged into the oversold territory with strong momentum, while the RSI is sloping down below the neutral threshold of 50.
Steeper declines could open the way towards the next support level, which comes from the 180.00 psychological level but first the price may fight with the previous round numbers such as 185.00, 182.00.
On the flip side, a rally above the 190.00 mark and the 20-day simple moving average (SMA) may drive the market towards the 200-day SMA at 192.20. More advances could see the 193.50 top ahead of 195.00.
All in all, GBPJPY is easing again after the notable correction from the eight-month trough of 180.00, remaining in a negative structure.
EUR/USD Eyes Fresh Increase, USD/JPY Trims Gains
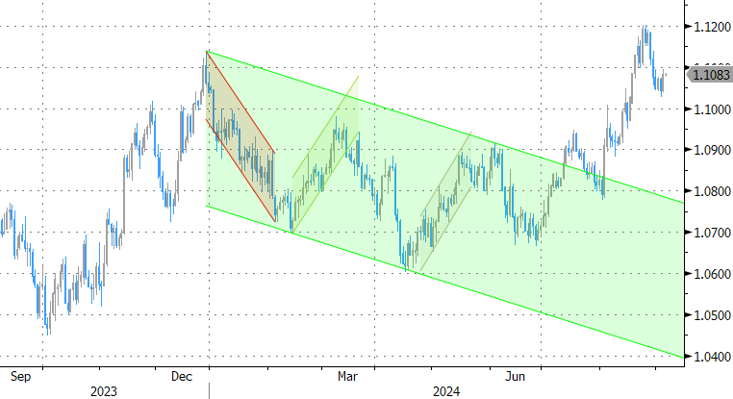
EUR/USD started a fresh decline from 1.1200. USD/JPY is correcting gains and might test the 144.15 support in the near term.
Important Takeaways for EUR/USD and USD/JPY Analysis Today
- The Euro started a fresh decline below the 1.1150 support.
- There is a key bearish trend line forming with resistance at 1.1055 on the hourly chart of EUR/USD at FXOpen.
- USD/JPY struggled near 147.20 and recently started a downside correction.
- There was a break below a major bullish trend line with support at 145.80 on the hourly chart at FXOpen.
EUR/USD Technical Analysis
On the hourly chart of EUR/USD at FXOpen, the pair started a fresh decline from the 1.1200 zone. The Euro declined below the 1.1150 support zone to enter a bearish zone against the US Dollar.
The pair even settled below the 1.1110 zone and the 50-hour simple moving average. A low was formed near 1.1026 and the pair is now correcting losses. It is now approaching the 23.6% Fib retracement level of the recent decline from the 1.1190 swing high to the 1.1026 low.
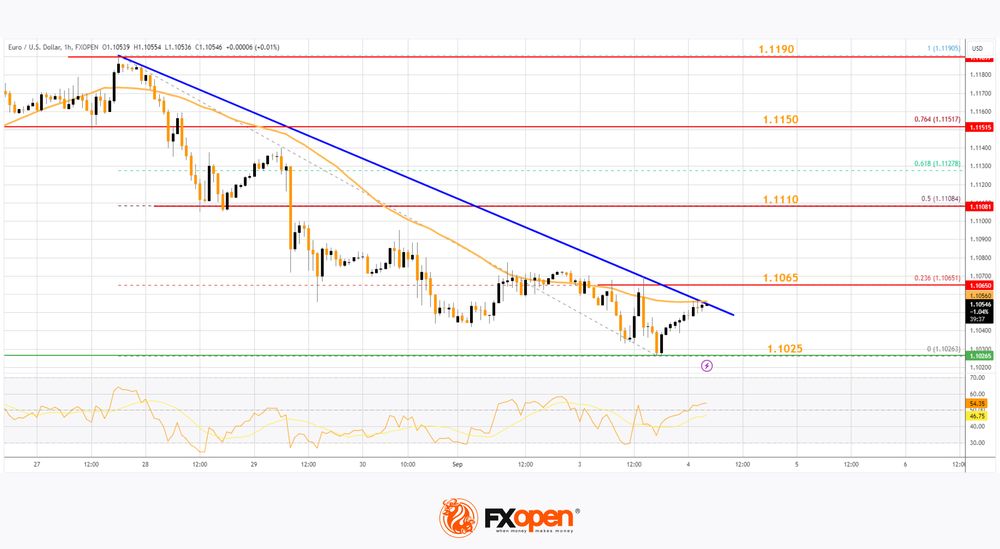
On the upside, the pair is now facing resistance near the 50-hour simple moving average at 1.1055. There is also a key bearish trend line forming with resistance at 1.1055.
The next major resistance is near 1.1065. The main resistance is now near 1.1110 and the 50% Fib retracement level of the recent decline from the 1.1190 swing high to the 1.1026 low. An upside break above 1.1110 could set the pace for another increase. In the stated case, the pair might rise toward 1.1150.
If not, the pair might resume its decline. The first major support on the EUR/USD chart is near 1.1025. The next key support is near 1.1000. If there is a downside break below 1.1000, the pair could drop toward 1.0965. The next support is near 1.0950, below which the pair could start a major decline.
USD/JPY Technical Analysis
On the hourly chart of USD/JPY at FXOpen, the pair started a decent increase from the 144.00 zone. The US Dollar gained bullish momentum above 145.50 against the Japanese Yen.
The pair even climbed above 147.00 before the bears appeared near 147.20. As a result, the pair started a downside correction below the 50-hour simple moving average and 146.00. There was a break below a major bullish trend line with support at 145.80.
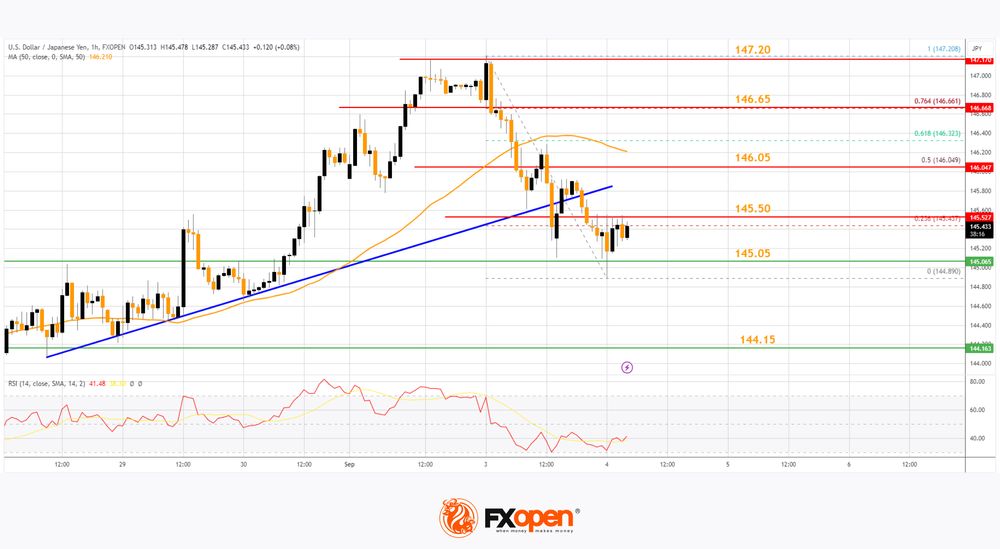
The pair tested the 145.00 zone. A low was formed at 144.89 and the pair is now consolidating losses. Immediate resistance on the USD/JPY chartis near the 23.6% Fib retracement level of the downward move from the 147.20 swing high to the 144.89 low.
The first major resistance is near the 50% Fib retracement level of the downward move from the 147.20 swing high to the 144.89 low at 146.05. If there is a close above the 146.05 level and the RSI moves above 50, the pair could rise toward 146.65.
The next major resistance is near 147.20, above which the pair could test 148.00 in the coming days. On the downside, the first major support is near the 145.05 level.
A downside break below the 145.05 support might spark strong bearish moves. The next major support is near 144.15. If there is a close below 144.15, the pair could decline steadily. In the stated case, the pair might drop toward 143.20. The next stop for the bears may perhaps be near the 142.50 zone.
Trade over 50 forex markets 24 hours a day with FXOpen. Take advantage of low commissions, deep liquidity, and spreads from 0.0 pips. Open your FXOpen account now or learn more about trading forex with FXOpen.
This article represents the opinion of the Companies operating under the FXOpen brand only. It is not to be construed as an offer, solicitation, or recommendation with respect to products and services provided by the Companies operating under the FXOpen brand, nor is it to be considered financial advice.
GBP/JPY Daily Outlook
Daily Pivots: (S1) 188.30; (P) 189.64; (R1) 190.32; More...
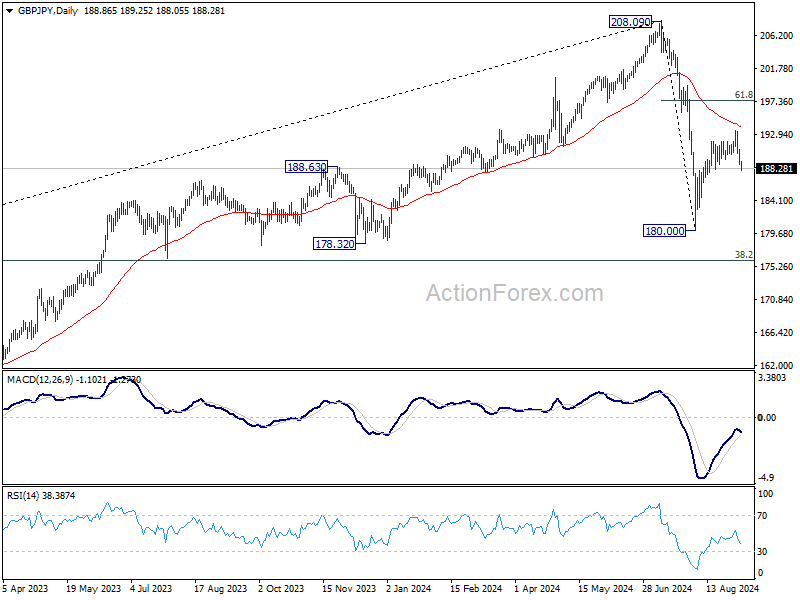
Immediate focus is no won 188.23 support in GBP/JPY with current decline. Firm break there will indicate that rebound from 180.00 has completed at 193.45. Intraday bias will be turn back to the downside for retesting 180.00. Nevertheless, strong rebound from current level will keep the rise from 180.00 alive for rising through 193.45 later.
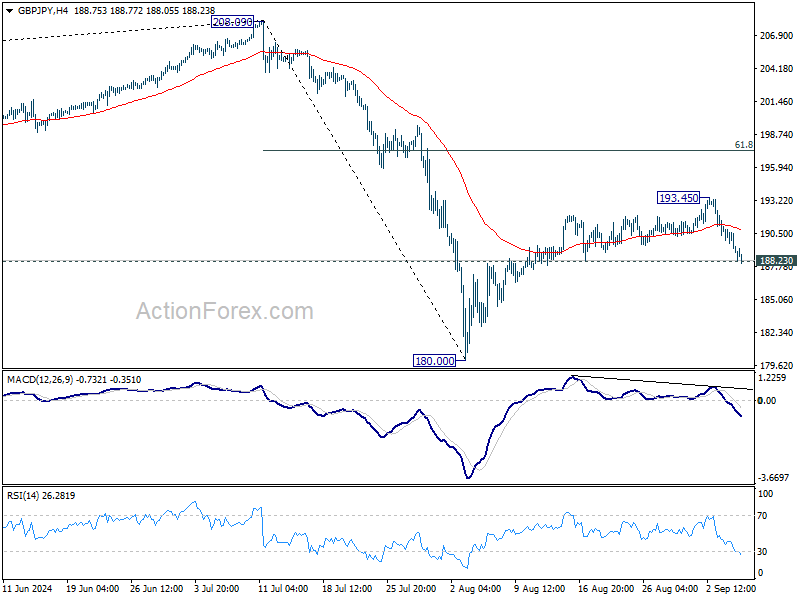
In the bigger picture, price actions from 208.09 are seen as a correction to whole rally from 123.94 (2020 low). Current development suggests that the first leg has completed and the range of medium term consolidation should be set between 38.2% retracement of 123.94 to 208.09 at 175.94 and 208.09.
EUR/JPY Daily Outlook
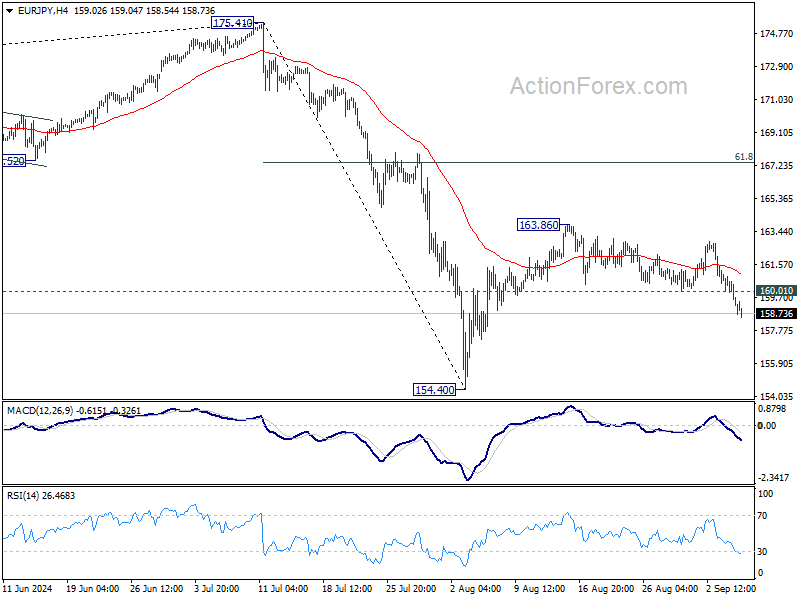
Daily Pivots: (S1) 158.74; (P) 159.83; (R1) 160.39; More....
Current decline suggests that rebound from 154.40 has completed at 163.86. Intraday bias in EUR/JPY is back on the downside for retesting 154.40 low first. Firm break there will resume whole fall from 175.41. On the upside, above 160.01 support turned resistance will turn intraday bias neutral first.
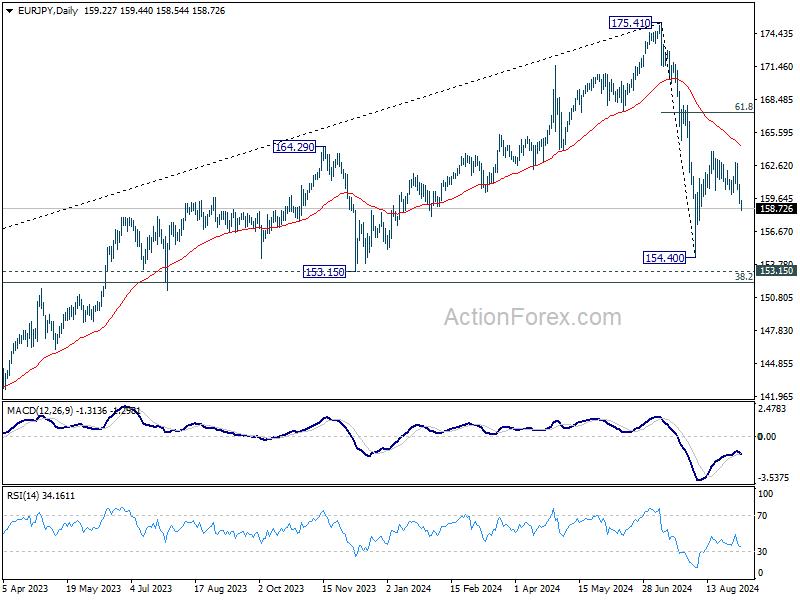
In the bigger picture, price actions from 175.41 are seen as correction to rally from 114.42 (2020 low). Current development suggests that the first leg has completed. The range of consolidation should be seen between 38.2% retracement of 114.42 to 175.41 at 152.11 and 175.41 high.
EUR/GBP Daily Outlook
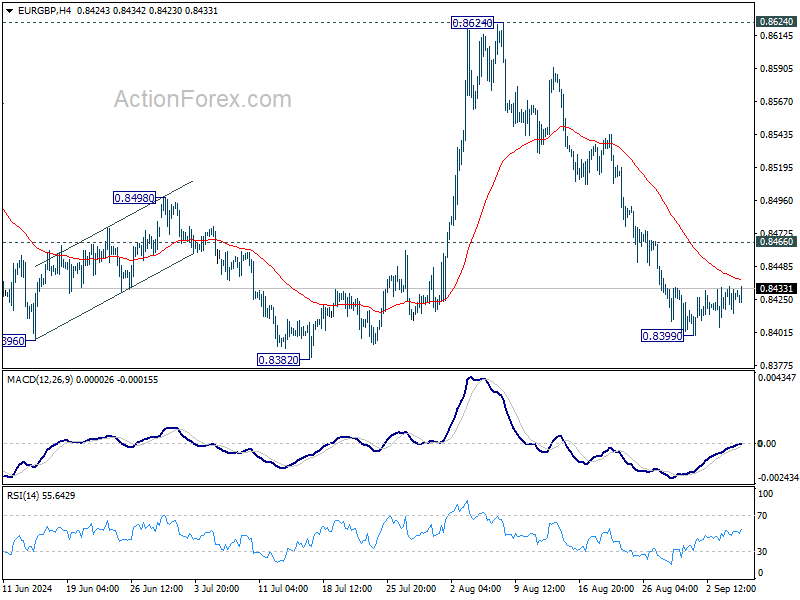
Daily Pivots: (S1) 0.8418; (P) 0.8427; (R1) 0.8437; More...
Intraday bias in EUR/GBP remains neutral for the moment and outlook is unchanged. While stronger recovery cannot be ruled out, further decline is expected as long as 0.8466 minor resistance holds. Below 0.8399 will resume the fall from 0.8624 and target 0.8382 support. Firm break there will resume larger down trend.
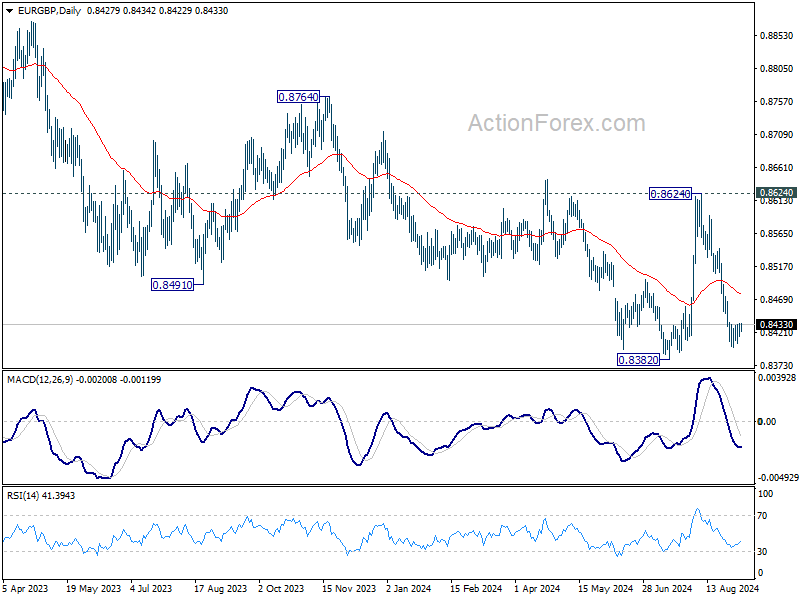
In the bigger picture, as long as 0.8624 resistance holds, down trend from 0.9267 is expected to continue. Firm break of 0.8382 will target 0.8201 (2022 low). However, decisive break of 0.8624 will indicate that such down trend has completed, and turn outlook bullish for 0.8764 resistance next.
EUR/AUD Daily Outlook
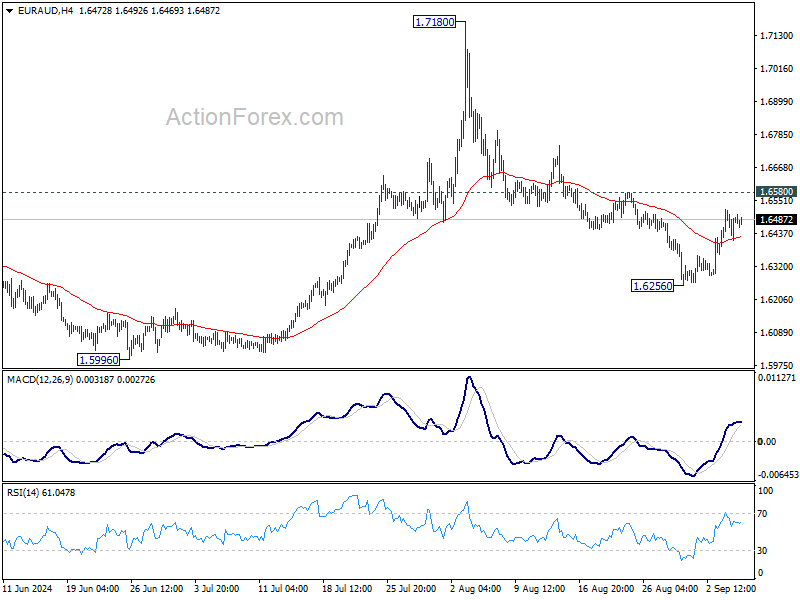
Daily Pivots: (S1) 1.6422; (P) 1.6473; (R1) 1.6531; More...
Intraday bias in EUR/AUD stays neutral for the moment. With 1.6580 resistance intact, fall from 1.7180 is still in favor to continue. On the downside, break of 1.6256 support will target 1.5996 key support level next. However, decisive break of 1.6580 will turn bias back to the upside for stronger rebound.
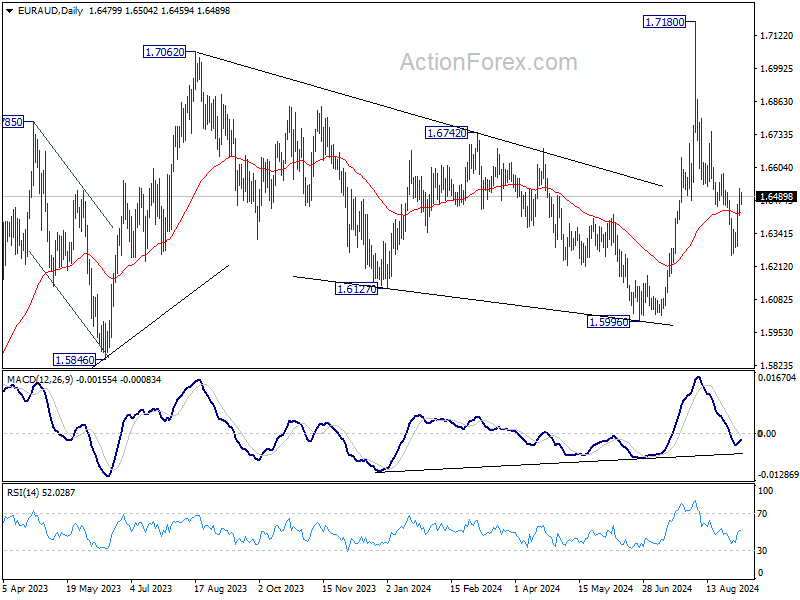
In the bigger picture, outlook is mixed up by the deeper than expected fall from 1.7180. Yet as long as 1.5996 support holds, up trend from 1.4281 (2022 low) is still expected to resume at a later stage. Firm break of 1.7180 will pave the way to 61.8% projection of 1.4281 to 1.7062 from 1.5996 at 1.7715.
EUR/CHF Daily Outlook
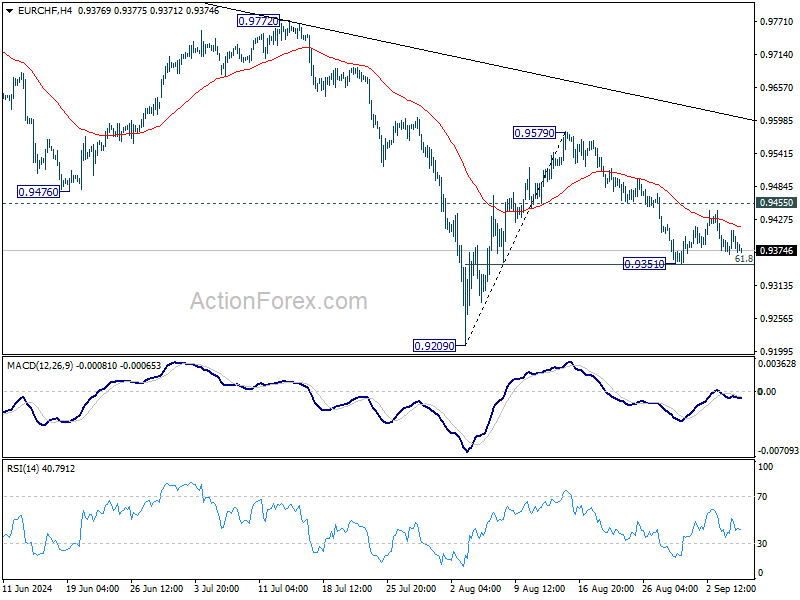
Daily Pivots: (S1) 0.9364; (P) 0.9387; (R1) 0.9406; More....
Intraday bias in EUR/CHF stays neutral and further decline is expected with 0.9455 resistance intact. On the downside, break of 0.9351 will resume the fall from 0.9579 to retest 0.9209 low. However, break of 0.9497 will turn bias back to the upside for 0.9579 resistance instead.
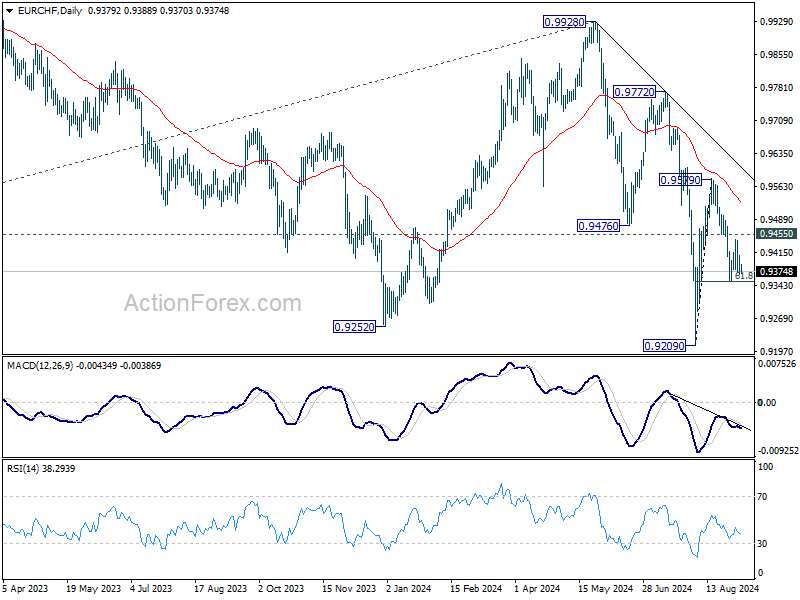
In the bigger picture, medium term corrective pattern from 0.9407 (2022 low) might have completed with three waves to 0.9928. Decisive break of 0.9252 (2023 low) will confirm long term down trend resumption. Next target will be 61.8% projection of 1.1149 to 0.9407 from 0.9928 at 0.8851. For now, outlook will stay bearish as long as 0.9928 resistance holds, even in case of strong rebound.
Loss of Interest Rate Support Weighed on Dollar
Markets
Yesterday’s JOLTS report was yet another perfect illustration of market’s high sensitivity to the labour market since Fed chair Powell bombarded it to the single most important theme for policy. July Job openings in the US tumbled from a downwardly revised 7.94 mln to 7.67 mln, undershooting consensus by about 400k. Resisting the urge for a “jolt(s)”-related pun, it triggered a shock reaction in markets. US yields added to previous losses to the tune of 2 bps to end the day significantly lower: from -6.5 (30-yr) to 10.9 (2-yr) bps. Front-end outperformance resulted from money markets adding to 2024 easing bets. A cumulative 110 bps on the remaining three meetings means that investors are increasingly considering more than one jumbo-sized (50 bps) rate cut. US stock markets hit their intraday highs in the hour after the JOLTS report before paring gains to trade only little changed. The loss of interest rate support weighed on the US dollar. EUR/USD bounced from 1.104 towards 1.108 and the trade-weighted index dropped to 101.36 (from 101.7 at the open). USD/JPY revisited the August sell-off lows around 143.7 on both dollar weakness and JPY strength. The latter extends into Asian dealings this morning after data showed wages in July growing faster than expected. The Bank of Japan’s preferred gauge came in at 4.8% y/y in July. That’s barely slower than June’s 5.1% - which was already boosted by back-pay reflecting this year’s wage negotiations – and significantly more than the 3.2% estimate.
Front-end US yields decisively broke through the recent August lows (eg. 2-yr sub 3.8%). Their technical picture deteriorated significantly as a result. There’s little in the way for a return towards the March 2023 lows seen in the wake of the regional banking crisis in the US (3.55% in the 2-yr yield). A possibly unconvincing ADP job report and/or US August services ISM (expected at 51.4, same as in July) today will undoubtedly add further downward pressure going into tomorrow’s key payrolls release. Longer maturities such as the 10-yr are at a crossroads with the similar August lows barely surviving for the time being. A break lower depends on whether the data is weak enough to reignite recessionary fears. The dollar looks vulnerable nevertheless. EUR/USD 1.1139 serves as a first dollar support.
News & Views
The Bank of Canada yesterday reduced its policy rate for the third consecutive meeting by 25 bps to 4.25%. Q2 growth (2.1%) was slightly stronger than forecast, but preliminary indicators suggest that recent activity was soft. The labour market slows, but wage growth remains elevated relative to productivity growth. Inflation, including underlying measures, declined further in July (2.5%). This allowed for a further easing, with excess supply putting r downward pressure on inflation. High prices for shelter and some services still give some counterweight. At the press conference, Governor Tiff Macklem still advocated data-dependent approach, but also kept the option open for bigger rate cut steps. With inflation getting closer to the target, the BoC needs to increasingly guard against the risk that the economy is too weak and inflation falls too much. The Canada 2-y bond yields yesterday declined 7 bps, but his was also supported by broader (US-driven) market momentum. The market currently fully discounts two additional 25 bps cuts at the October and December meetings and about 30% chance of one bigger move. The Loonie strengthened (USD/CAD 1.35 from 1.355) but this was partially due to overall US weakness.
The Reserve Bank of Australia (RBA) doesn’t join the broader positioning toward (faster) policy easing. In a speech this morning, RBA Governor Michele Bullock reconfirmed bringing inflation to the 2-3% target as the RBA’s priority. "If the economy evolves broadly as anticipated, the board does not expect that it will be in a position to cut rates in the near term," Bullock said. Inflation cooled to 3.5% but especially domestic inflation from housing and services remains too high. Bullock warned that if high inflation became entrenched in expectations, the RBA would have to slow the economy even more to bring prices back in check, with ultimately a larger rise in unemployment and higher risk of a recession. If circumstances change, the RBA will respond accordingly. The Aussie this morning trades little changed (AUD/USD 0.6725) after having declined earlier this week on lower commodity prices. Markets still see a first RBA rate cut by the turn of the year (December or February meeting).
Graphs
GE 10y yield
The ECB cut policy rates by 25 bps in June and will likely do so again in September. Stubborn inflation (core, services) warrants a cautious approach on follow-up moves. Markets price in two to three more cuts for 2024 as disappointing US and unconvincing EMU activity data rolled in, dragging the long end of the curve down. Yields meanwhile bottomed in the wake of the August market meltdown, preluding a technical correction higher.
US 10y yield
The Fed in its July meeting paved the way for a first cut in September. It turned attentive to risks to the both sides of its dual mandate as the economy is moving to a better in to balance. The pivot weakened the technical picture in US yields. A string of weak eco data pushed and kept the 10-yr sub 4%. Markets increasingly add to 2024 cut bets with more than one jumbo-sized cut gaining traction.
EUR/USD
EUR/USD moved above the 1.09 resistance area as the dollar lost interest rate support at stealth pace. US recession risks and bets on fast and large (50 bps) rate cuts trump traditional safe haven (recessionary) flows into USD. EUR/USD 1.12 was tested but survived. A (technical) dollar comeback had no strong legs. The greenback looks vulnerable.
EUR/GBP
The BoE delivered a hawkish cut in August. Policy restrictiveness will be further unwound gradually on a pace determined by a broad range of data. The strategy similar to the ECB’s balances out EUR/GBP in a monetary perspective. Recent better UK activity data and a cautious assessment of BoE’s Bailey at Jackson Hole are pushing EUR/GBP lower in the 0.84/0.086 range.