
Sample Category Title
Will the NFP Take a September Double Fed Cut Off the Table?
- Fed fund futures suggest a 40% chance of a 50bps September cut
- Powell’s Jackson Hole speech adds importance to jobs data
- US employment report scheduled for Friday at 13:30 GMT
Investors see increasing chance of 50bps cut
The dollar had a rough time in August, underperforming against all its major counterparts as market participants remained convinced that the Fed will cut interest rates by around 105 basis points by the end of the year. This translates to a rate reduction at each of the remaining decisions for 2024, with one of them being a double 50bps cut.
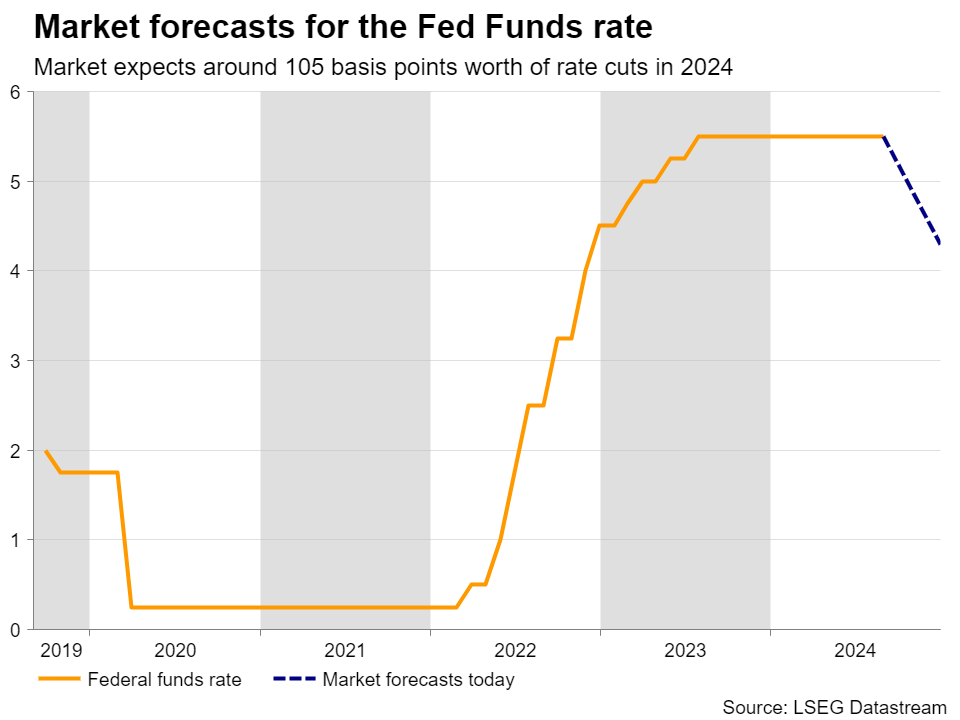
Given that Fed Chair Powell appeared more dovish than expected at Jackson Hole, investors are currently assigning a 40% probability for that 50bps cut to be delivered at the upcoming meeting, on September 18. During his speech, Powell highlighted the importance of the labor market, noting that they will not tolerate further weakness, and thus, investors may be sitting on the edge of their seats in anticipation of Friday’s employment report for August.
Forecasts point to some improvement
Expectations are for nonfarm payrolls to have accelerated to 164k from 114k in July and for the unemployment rate to have ticked down to 4.2% from 4.3%. Average hourly earnings are also expected to have accelerated in monthly terms, to 0.3% from 0.2%.
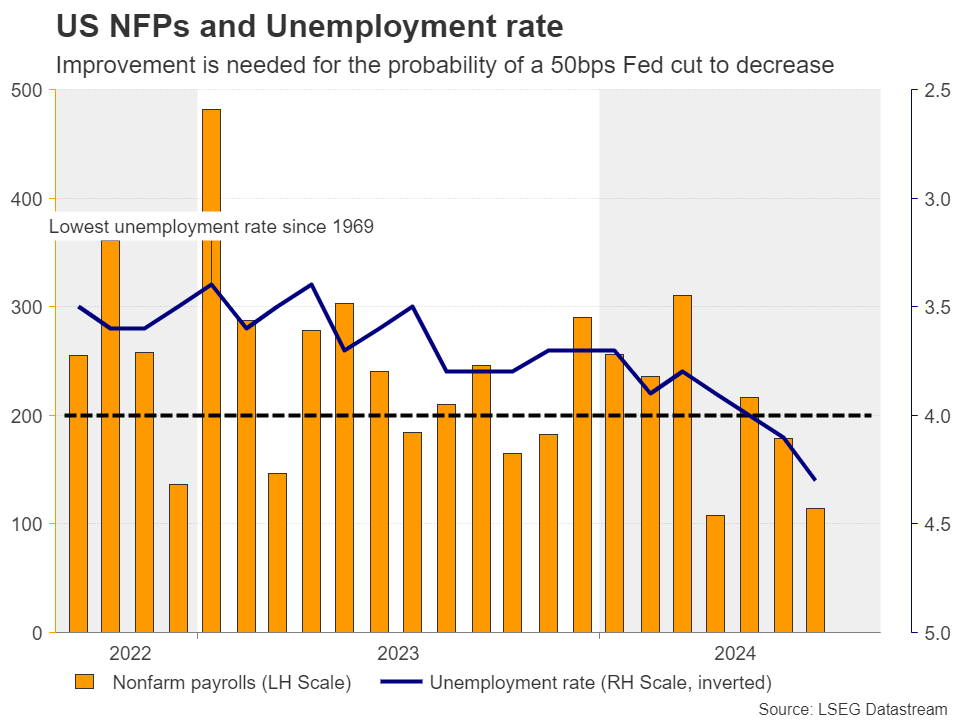
Following the upward revision of Q2 GDP and taking into account that the Atlanta Fed GDPNow model points to a 2.0% growth rate for Q3, some improvement in the jobs data may prompt traders to lean more towards a 25bps reduction at the upcoming Fed decision. This may allow the dollar to further strengthen as Treasury yields extend their recovery.
But PMI surveys pose downside risks
Having said all that though, the preliminary S&P Global PMIs revealed that employment fell in August, while the employment subindex of the ISM manufacturing PMI for the month, although it rose somewhat, remained below the boom-or-bust zone of 50 that separates expansion from contraction.
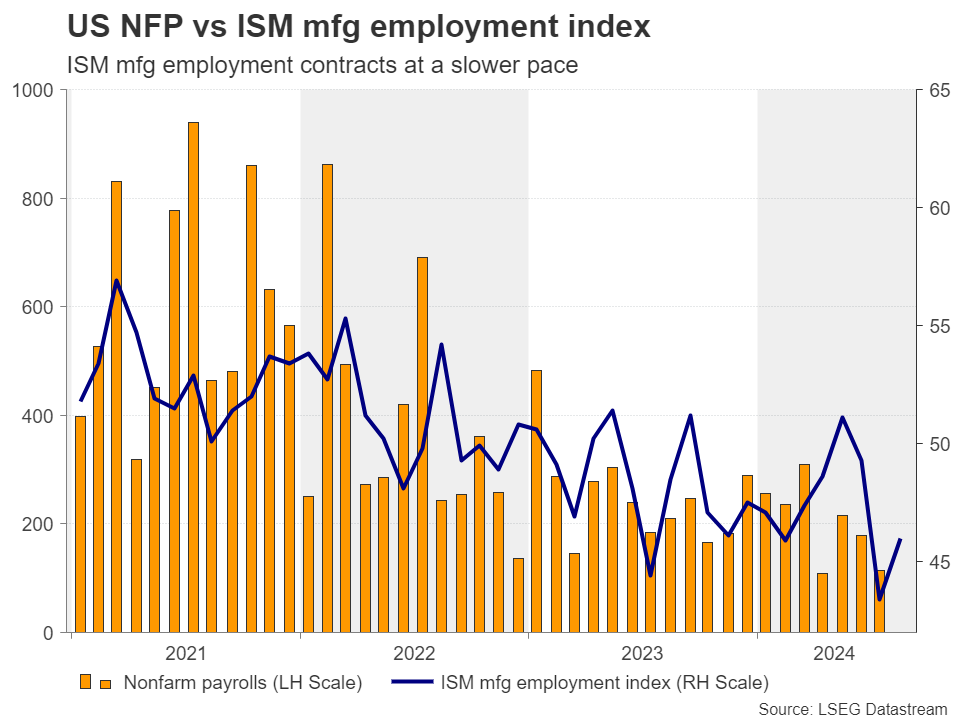
This imposes some downside risks to Friday’s report, which if materialized, could rekindle market panic, with the US dollar coming under pressure again. Equities could also slip as renewed recession fears may not allow investors to celebrate the prospect of lower borrowing costs.
Euro/dollar pulls back, but rebound still likely
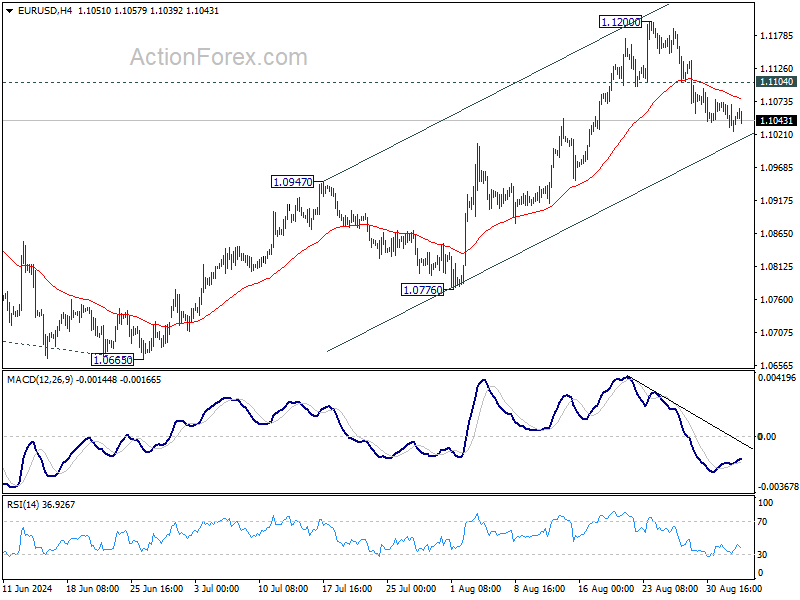
From a technical standpoint, euro/dollar has been correcting lower lately, after hitting resistance at 1.1200 on August 23 and 26. Currently, the bears seem to be pushing for a break below the 1.1040 barrier, a move that may see scope for declines towards the 1.0950 barrier, marked by the low of August 15. A decent jobs report could add fuel to the slide.
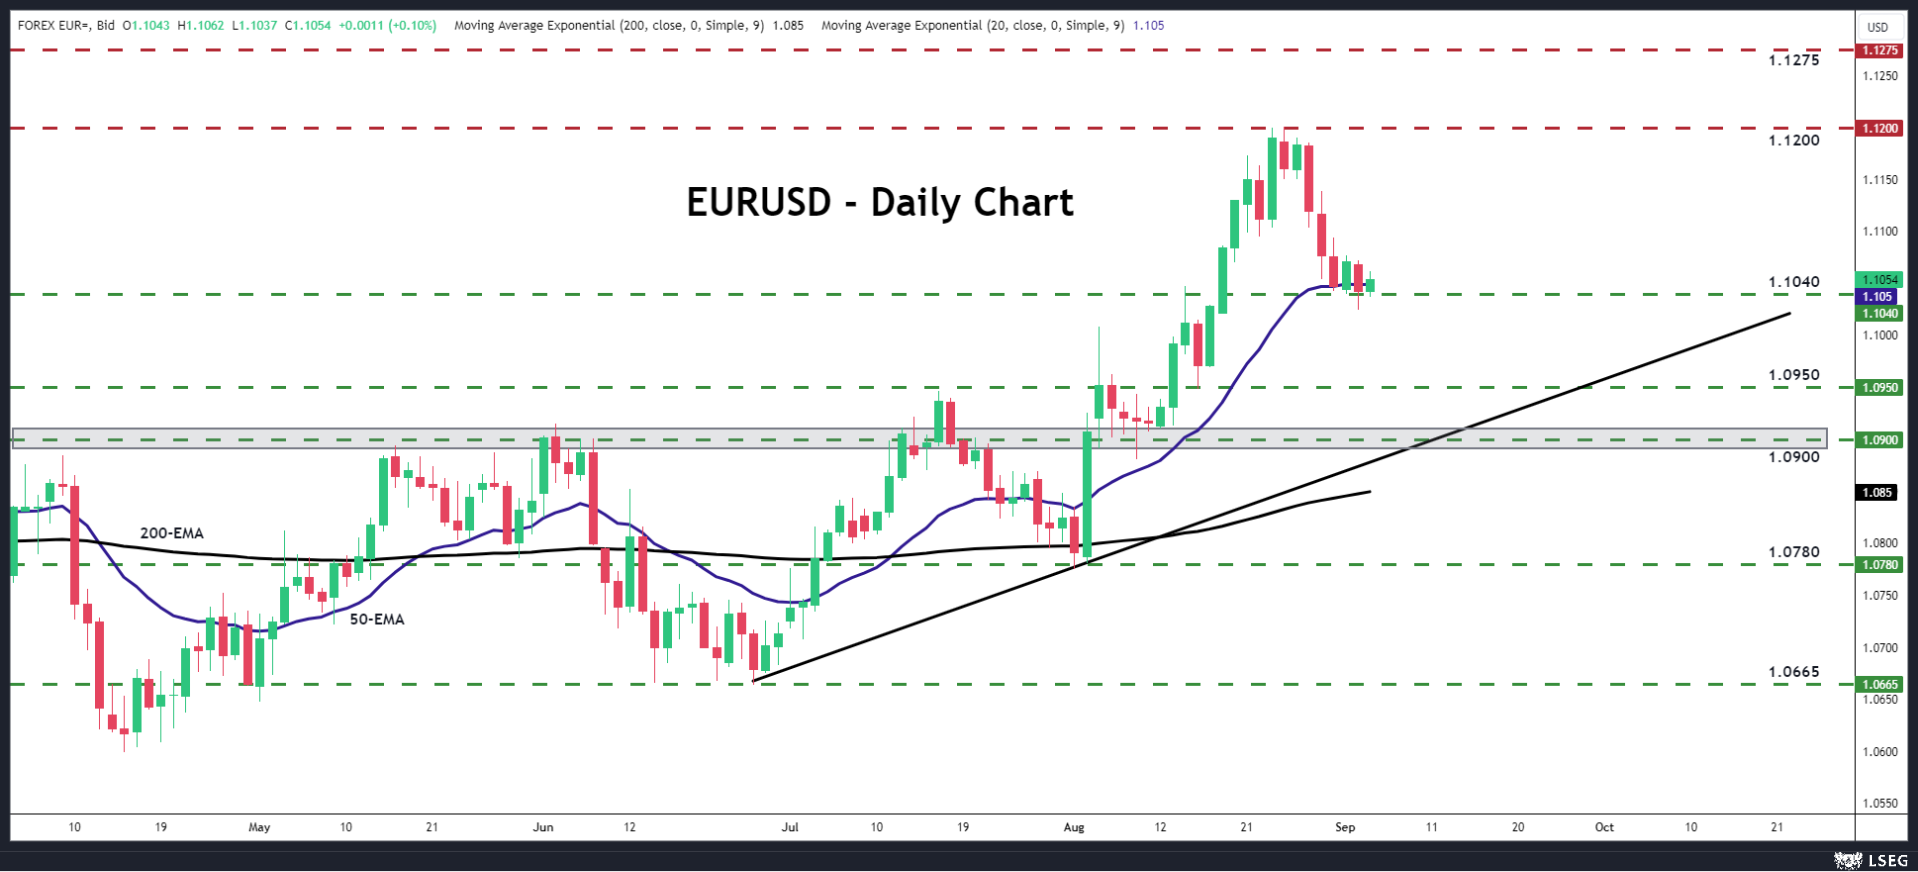
That said, even if this is the case, euro/dollar would still be trading above the crossroads of the key 1.0900 area and the upward sloping line drawn from the low of June 26. This may allow the bulls to take the reins again at some point in the foreseeable future.
Now, if the report comes in softer than expected, the pair may shoot up without correcting lower, which could encourage the bulls to revisit and even breach the 1.1200 zone. Their next stop may be the high of July 18, 2023, at 1.1275.
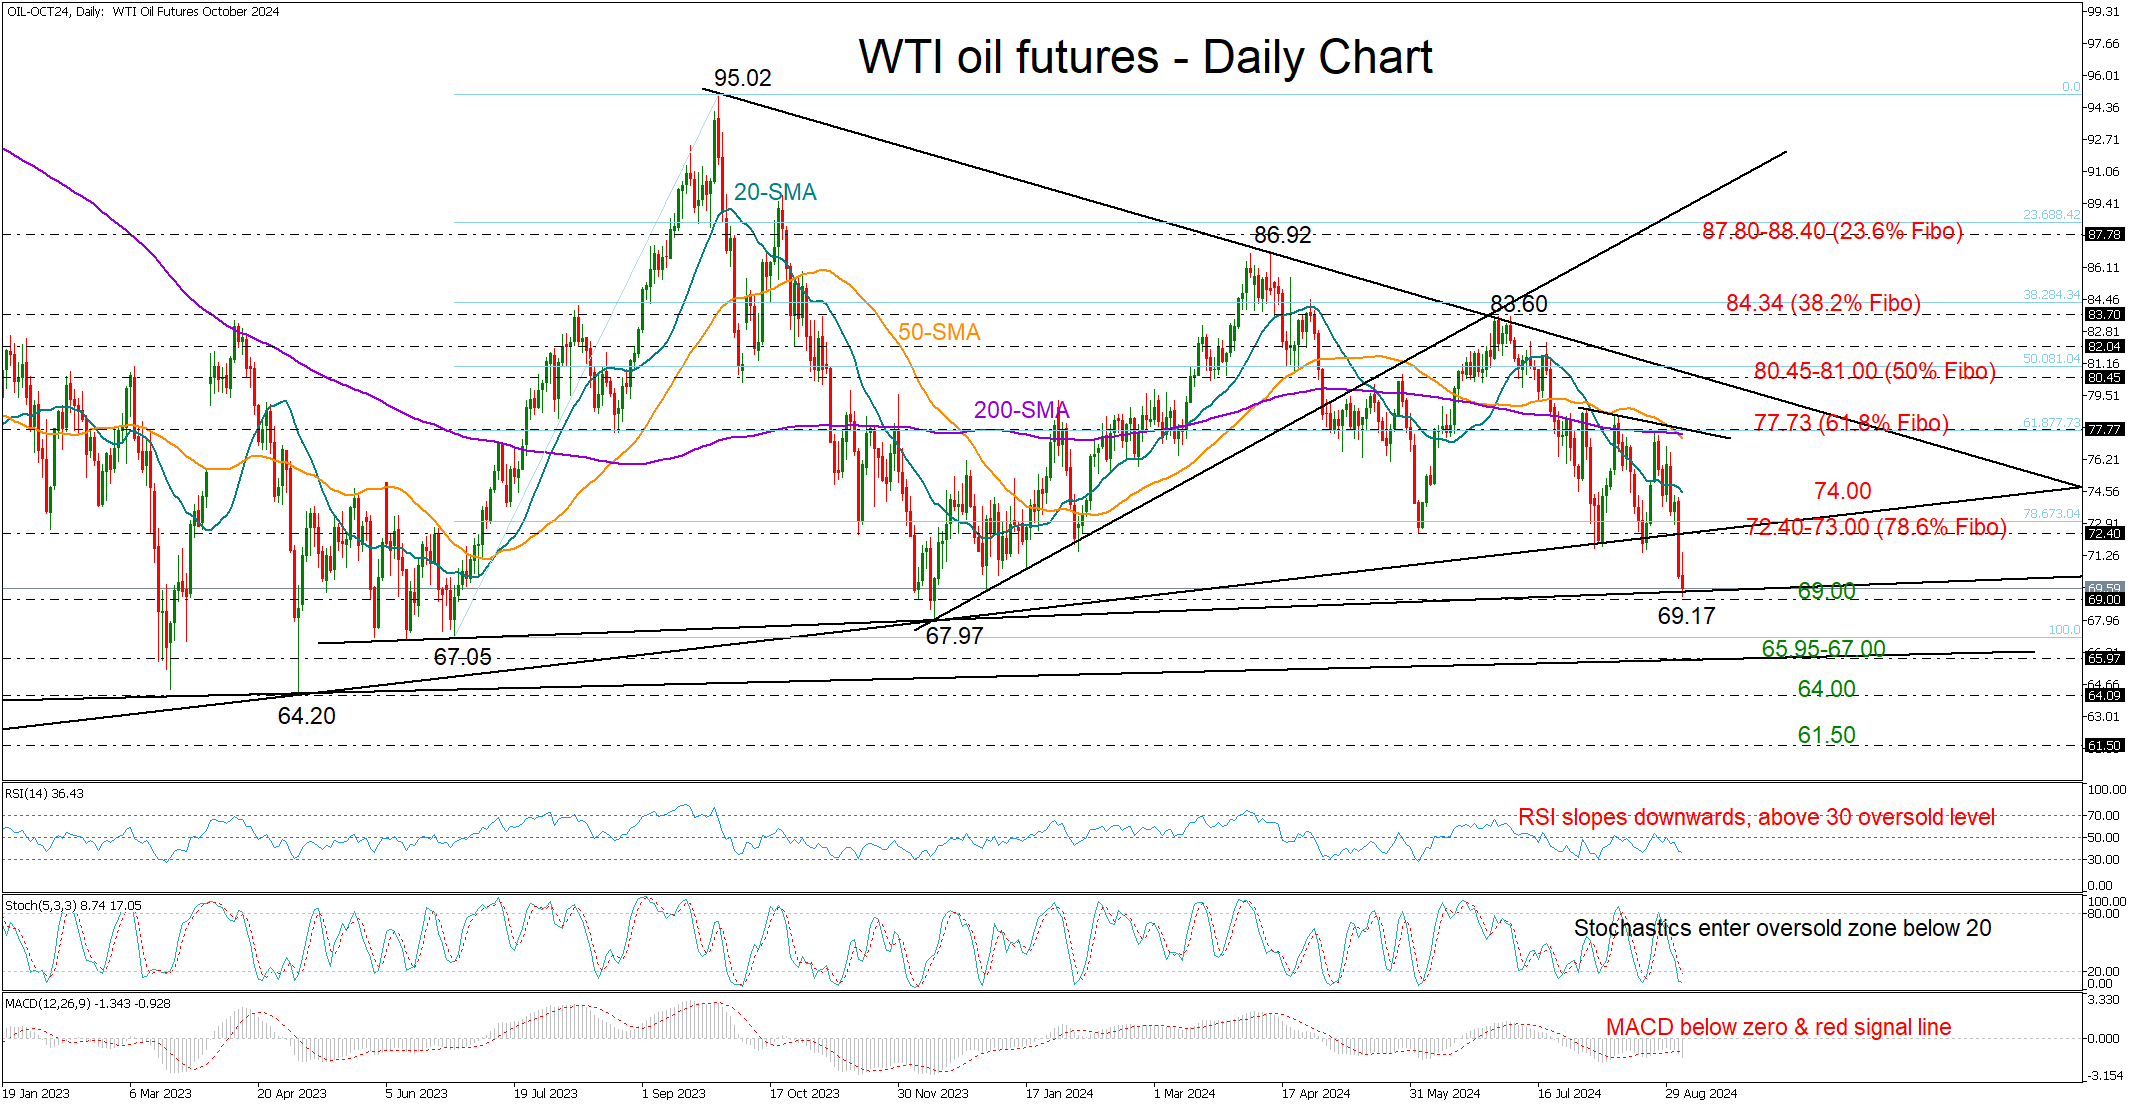
WTI Oil Futures Test Critical Support
- WTI oil futures seek buyers around strong support trendline near 69.00
- Short-term bias remains bearish; a bounce above 74.00 is needed
WTI oil futures edged up to 71.44 on news that OPEC members are discussing a potential delay in a planned output hike in October.
Technically, the price rotated higher after marking a nine-month low of 69.17, near the important support trendline, which joins the lows from the end of May 2023. Recall that oil set a strong footing near that line to stage an impressive rally in June and December 2023. Hence, although it missed the opportunity to pivot near the 72.40 level, it would be interesting to see if the bulls will manage to come into full force again near 69.00.
The stochastic oscillator is already near its 20 oversold level, suggesting downside pressures may soon fade, though some caution is necessary as the RSI has yet to reach its 30 level. Adding to the negative risks is the death cross between the 50- and 200-day simple moving averages (SMAs), which is also in progress in the weekly chart.
Should the 69.00 floor crack, the sell-off could intensify towards the 65.95-67.00 zone, where the flat support trendline from 2021 is located. A drop below it could take a breather somewhere between the April 2023 low of 64.20 and the 64.00 psychological mark, while lower, the price could sink towards the 61.50 region last seen in spring 2021. A break of the latter could significantly worsen the broader outlook.
On the upside, a bounce above 72.40-73.00 could immediately stall near 74.00. Another close higher will be needed for an acceleration towards the 200-day SMA and the 61.8% Fibonacci retracement of the June-September upleg at 77.73. If there are more gains, the spotlight will fall on the critical resistance trendline at 80.45 and the 50% Fibonacci of 81.00.
In brief, WTI oil futures might have another chance to get on its feet near the 69.00 level. Otherwise, selling interest could pick up pace.
USDX and AUDUSD at Critical Levels: Key Supply and Demand Zones to Watch
Fundamental Analysis
The USD has been strengthening this week, driven by mixed U.S. economic data and increased demand for safe-haven assets amid global uncertainty. Against the AUD, the dollar has gained due to the weakness of the Australian dollar, which has been affected by falling commodity prices and the weak Australian GDP report.
Australia's Q2 2024 GDP showed sluggish growth of just 0.1%, in line with market expectations. This reflects ongoing economic challenges, including low domestic demand, increasing the likelihood of a rate cut by the Reserve Bank of Australia (RBA) later this year.
Technical Analysis
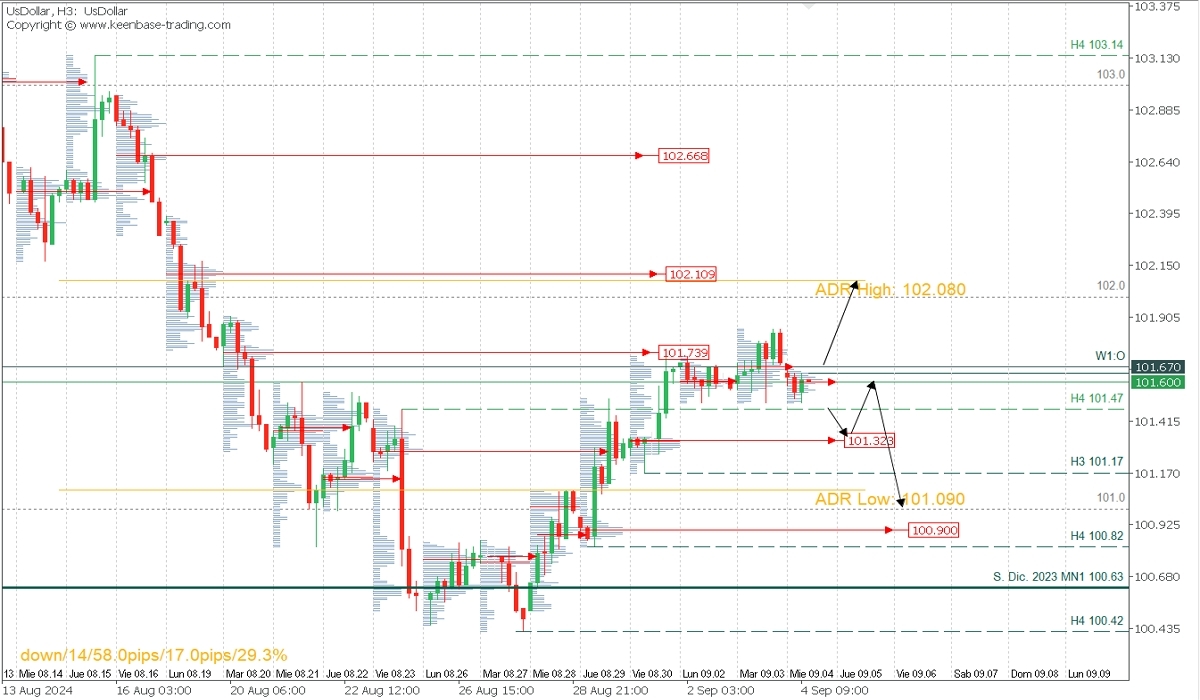
Dollar Index (USDX), H3
- Supply Zones (Sells): 101.73, 102.109, and 102.649
- Demand Zones (Buys): 101.319 and 100.90
The USD’s recovery and the confirmed breakout above the last validated resistance at 101.47 suggest an intraday upward trend reversal. After reaching the closest supply zone around 101.73 and a moderate pullback, an additional rally towards the next supply zone near 102.10 and 102.65 is expected. This bullish scenario remains valid as long as the current support at 101.17 holds. If breached, the bearish trend will resume, targeting the weekly support at 100.42.
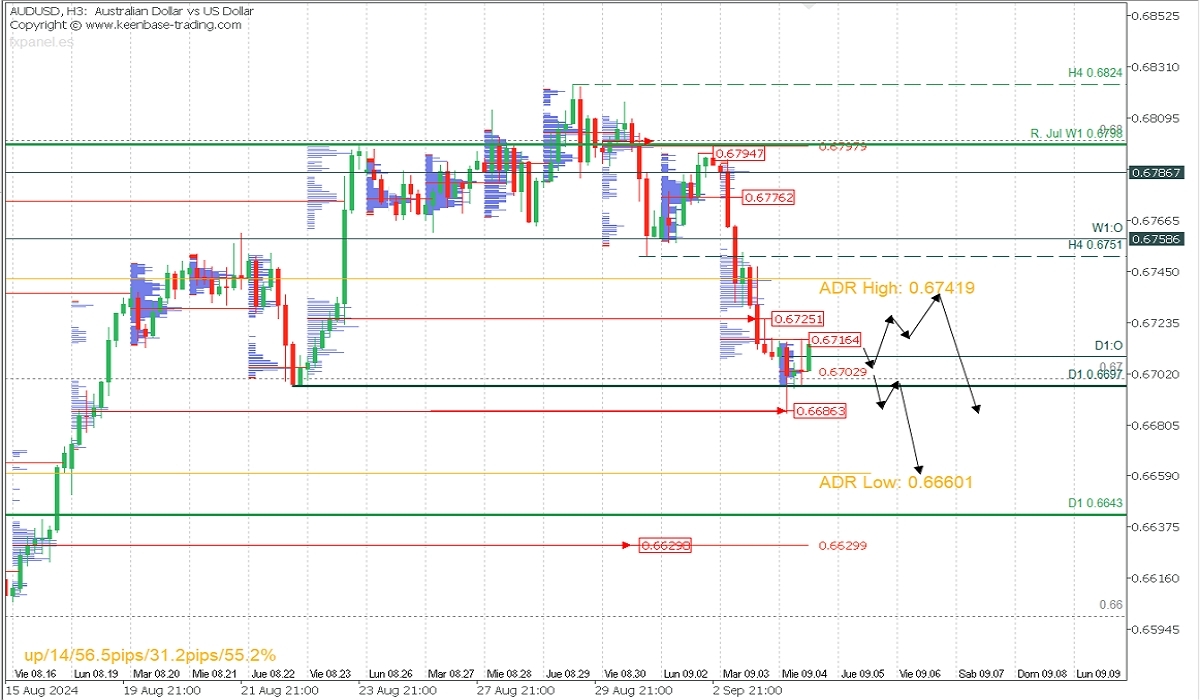
AUDUSD, H3
- Supply Zones (Sells): 0.6716, 0.6725, 0.6741, and 0.6776.
- Demand Zones (Buys): 0.6702, 0.6686, 0.6661, and 0.6630.
The pair faces a range between 0.6686 and 0.6725. As long as the price stays above the early session demand zone around 0.6702, the pair will seek to sell liquidity between 0.6716 and 0.6725. If surpassed, a further extension towards 0.6740/41 is possible, where new sell opportunities should be considered. Bearish targets are below 0.6686, towards the average bearish range at 0.6660, extending to the uncovered Point of Control (POC) at 0.6629. This bearish scenario is valid as long as the last validated resistance at 0.6794 is not breached.
A Jump in Eurozone PPI Won’t Stop ECB Easing
Perhaps disinflationary trends in the eurozone are giving way to pro-inflationary ones. The eurozone’s producer price index rose 0.8% in July after rising 0.6% in the previous month. Prices are still lower year-on-year for the fifteenth month, with a reading of -2.1% after -3.3% the previous month. Nevertheless, the jump over the past two months is worth watching as it promises to be a leading indicator of a turnaround in consumer inflation.

Although the ECB only talks about consumer inflation and wages, the sharp reversal in PPI promises to complicate the picture for forecasting inflation trends in the coming months.
At the same time, business activity (excluding France) did not shine last month. The final composite PMI reading was revised down to 51.0, with the services sector driving growth, while manufacturing activity has been below the waterline for 26 months.
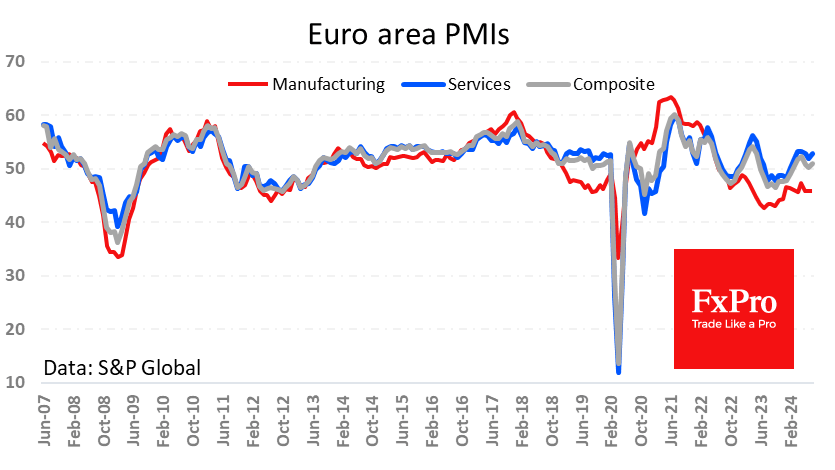
The decline in manufacturing has been attributed to tariff disputes with China, something we last saw in 2019. Tariffs may also be behind the momentum in producer prices. If so, this is no reason for the ECB to refrain from easing monetary policy, as loose monetary conditions and a low exchange rate could help manufacturing.
Bank of Canada Cuts Rates Again, Signals More to Come
The Bank of Canada (BoC) cut its overnight rate by 25 basis points, to 4.25%, while stating that it will continue with Quantitative Tightening (QT).
The Bank noted the recent softening in economic data, affirming that "preliminary indicators suggest that economic activity was soft through June and July" and that "the labour market continues to slow, with little change in employment in recent months."
The BoC seemed to view that inflation was under greater control, commenting that "as expected, inflation slowed further to 2.5% in July. The Bank's preferred measures of core inflation averaged around 2 ½% and the share of components of the consumer price index growing above 3% is roughly at its historical norm."
On the future path of policy, the bank has maintained its balanced rhetoric, stating "excess supply in the economy continues to put downward pressure on inflation, while price increases in shelter and some other services are holding inflation up. Governing Council is carefully assessing these opposing forces on inflation."
Key Implications
Another meeting, another cut. With inflation seemingly under control, the BoC can continue to cut rates as it focuses more on weakening trends in economic growth and the labour market. The unemployment rate has steadily moved higher over the last year, and layoffs are starting to take hold. And now that the central bank’s growth outlook for 2024 Q3 looks like a fantasy following last week’s GDP print, risks are mounting that the BoC is behind the curve.
Canadians should expect further rate cuts as the central bank’s policy stance is still at significantly restrictive levels (see our recent report). This is why we have another 175 bps in cuts cued up through next year. While the pace of cuts (25 bps per meeting) seems entrenched at the moment, the BoC has a long way to go to get monetary policy in line with the state of the economy.
Fed’s Bostic signals shift in focus as inflation eases and labor market cools
In an essay published today, Atlanta Fed President Raphael Bostic emphasized Fed's dual mandate of price stability and maximum employment.
While he has been "intensely focused" on controlling inflation for the past three years, "that's changing" as eroding pricing power and a cooling labor market come into play.
"I've rebalanced my focus toward both sides of the dual mandate for the first time since early 2021," he wrote.
Bostic emphasized that while inflation is not yet fully under control, saying "I am not quite prepared to declare victory over inflation," Fed must also avoid keeping monetary policy too restrictive for too long.
He stressed the importance of not waiting until inflation reaches the 2% target to begin easing, as maintaining high interest rates for too long could cause "labor market disruptions that could inflict unnecessary pain and suffering."
Sunset Market Commentary
Markets
Equities continue to take center stage on markets. European stocks underperformed in a catch-up move with the US. The EuroStoxx50 loses another 1.2%. Wall Street was granted some relief after yesterday’s violent sell-off with stocks trading currently only marginally lower (Nasdaq -0.3%). Tuesday’s sell-off took place against the backdrop of lofty (tech) valuations & a weaker than expected manufacturing ISM that reignited growth fears ahead of other important data releases this week. The US JOLTS job openings scheduled for release after wrapping up this report could add to that sentiment should they disappoint. The Fed’s Beige Book is to be published a bit later and kicks off the September monetary policy cycle. That Sep 18 meeting is growing into a very important one with a string of weaker (?) labour market data potentially paving the way for not just one inaugural but several jumbo cuts in 2024. US money markets stick to about 100 bps of cuts this year for the time being but yesterday’s sharp moves illustrate what little is needed for a dovish tilt. That would have important technical ramifications for (especially short term) US yields, where support around the August lows are under heavy attack. Moves vary 1-2.3 bps across the curve. German Bunds outperform with rates dropping between 3.8 (30-yr) and 5.4 bps (5-yr) with the picture looking increasingly risky as well. Commodity prices take a breather after some difficult days. Iron still dropped sharply but rebounded intraday. Oil (Brent $73.6/b) erased previous losses to trade unchanged on reports that OPEC+ is considering a delay to the planned output hike. Currency markets trade extremely stoic with most major currencies including USD, EUR and GBP hovering around opening levels. The Japanese yen has a minor upper hand against G10 peers, pushing USD/JPY just south of 145. The Swissie backtracks slightly with EUR/CHF hovering around 0.94.
News & Views
In its autumn economic forecast, the Kiel Institute for the world economy (IFW), expects the German economy to shrink again in 2024 by -0.1% after it had already fallen 0.3% last year. According to IFW, positive signals in the middle of the year have not been confirmed. The head of forecasting comments that "While public and quasi-public services have been upward trending most private activities performed poorly. Overall and looking forward, the German economy is stuttering into an anemic recovery, partly because economic policy is unable to set a reliable course”. For this year, weak private consumption (+0.4%) is weighing on the outlook, as households are holding spending back despite rising real incomes. In addition, manufacturing (-2.7%) and construction (-4.3%) are drifting deeper into recessionary territory. Investment expenditure is suffering from pronounced economic policy uncertainty. IFW still expects a weak recovery in 2025 (0.5%) and 2026 (1.1%). Aside from a cyclical crisis IFW increasingly sees a structural crisis developing. ‘The Budget cuts of the government coalition are an additional burden here and the ECB's interest rate turnaround is coming too late for Germany. What's more, old core industries have been resistant to change for far too long and the asylum debate is poisoning the dialog about the economic need to attract skilled workers from abroad. As long as this remains the case, we can watch our growth opportunities dwindle.’ IFW president Schularick analyses in the press release.
In comments after a speech in Stockholm covered by Bloomberg, Riksbank (RB) Deputy Governor Per Jansson indicated that a gradual move toward low interest rates could reduce the risk of krona volatility. In this respect, Jansson indicated he had no preference between the options of two or three rate cuts before the end of the year that the RB communicated as a likely path for policy. “Having some exchange-rate stability makes it easier for companies, so if we can contribute to that by implementing this idea about a gradual monetary policy, I think we should”, the deputy governor was quoted by Bloomberg. The debate on the pace of further rate cuts isn’t finished yet within the MPC. Yesterday governor Thedeen indicated that as the economy is treading water and as the bank is increasingly confident that inflation will remain near its target, there will be arguments for the RB to do something. He sees three rate cuts as the most likely scenario. The potential loss of further interest rate support and an global risk-off scenario, yesterday and today triggered renewed SEK-selling with EUR/SEK currently trading near 11.41 compared to levels near 11.33 last week.
Graphs
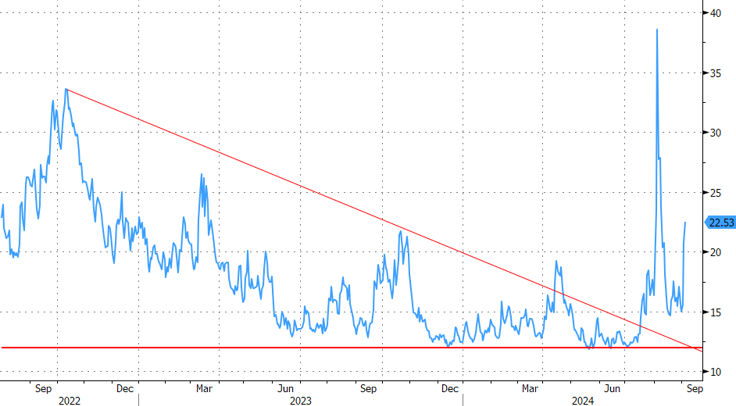
Vix volatility index hits highest level since the early August market tremors
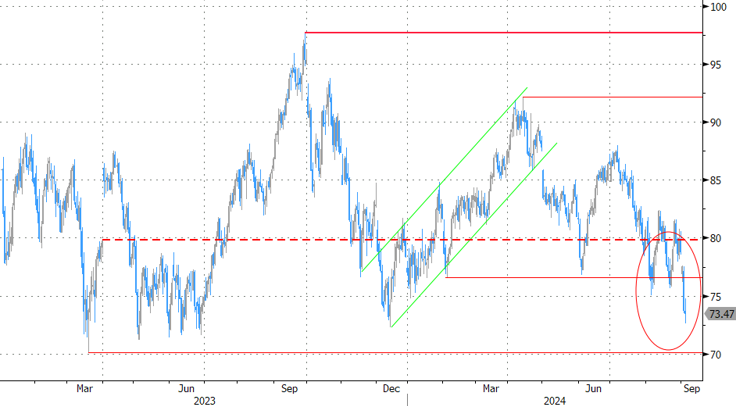
Brent oil finds some (but not much) support in OPEC+ reported to delay planned output hike
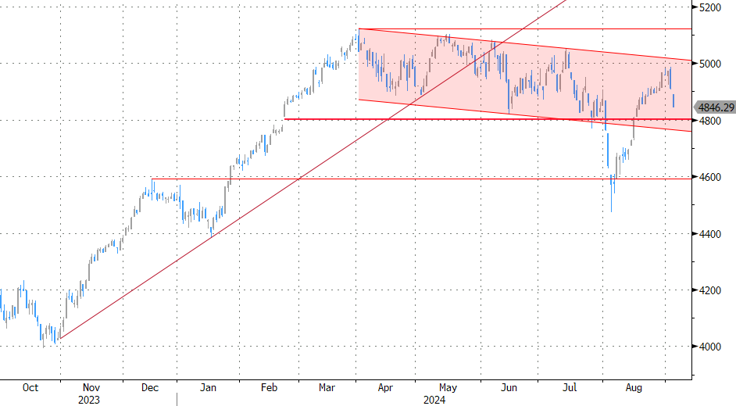
EuroStoxx50 extends drop after painting the perfect bearish engulfer yesterday. Support at 4800 to be tested soon?
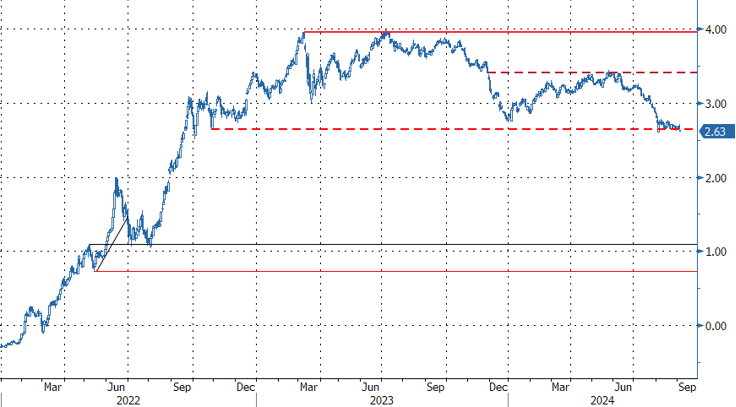
European 2-yr swap yield struggles to leave the recent lows/support area behind
BoC cuts rates to 4.25%, continues to monitor opposing inflationary forces
BoC reduced its overnight rate by 25bps to 4.25%, as widely anticipated. In its statement, the central bank highlighted the "opposing forces" at play on inflation. On one hand, excess supply is pushing inflation lower, while rising costs in the shelter and services sectors are keeping inflationary pressures elevated. BoC reaffirmed that future policy decisions will be data-dependent, guided by the evolving inflation outlook.
While Q2 GDP growth came in at 2.1%, "slightly stronger than forecast," the central bank noted that economic activity softened in June and July based on preliminary indicators. The labor market, though slowing, continues to see wage growth at elevated levels.
Inflation has slowed to 2.5%, in line with BoC's expectations, and core inflation remains around 2.5%. The share of CPI components growing above 3% has returned to its "historical norm."
High shelter price inflation remains the largest contributor to overall inflation, although it is beginning to cool. However, inflation in other services remains persistently elevated, keeping upward pressure on prices.
(BOC) Bank of Canada reduces policy rate by 25 basis points to 4¼%
The Bank of Canada today reduced its target for the overnight rate to 4¼%, with the Bank Rate at 4½% and the deposit rate at 4¼%. The Bank is continuing its policy of balance sheet normalization.
The global economy expanded by about 2½% in the second quarter, consistent with projections in the Bank’s July Monetary Policy Report (MPR). In the United States, economic growth was stronger than expected, led by consumption, but the labour market has slowed. Euro-area growth has been boosted by tourism and other services, while manufacturing has been soft. Inflation in both regions continues to moderate. In China, weak domestic demand weighed on economic growth. Global financial conditions have eased further since July, with declines in bond yields. The Canadian dollar has appreciated modestly, largely reflecting a lower US dollar. Oil prices are lower than assumed in the July MPR.
In Canada, the economy grew by 2.1% in the second quarter, led by government spending and business investment. This was slightly stronger than forecast in July, but preliminary indicators suggest that economic activity was soft through June and July. The labour market continues to slow, with little change in employment in recent months. Wage growth, however, remains elevated relative to productivity.
As expected, inflation slowed further to 2.5% in July. The Bank’s preferred measures of core inflation averaged around 2 ½% and the share of components of the consumer price index growing above 3% is roughly at its historical norm. High shelter price inflation is still the biggest contributor to total inflation but is starting to slow. Inflation also remains elevated in some other services.
With continued easing in broad inflationary pressures, Governing Council decided to reduce the policy interest rate by a further 25 basis points. Excess supply in the economy continues to put downward pressure on inflation, while price increases in shelter and some other services are holding inflation up. Governing Council is carefully assessing these opposing forces on inflation. Monetary policy decisions will be guided by incoming information and our assessment of their implications for the inflation outlook. The Bank remains resolute in its commitment to restoring price stability for Canadians.
Information note
The next scheduled date for announcing the overnight rate target is October 23, 2024. The Bank will publish its next full outlook for the economy and inflation, including risks to the projection, in the MPR at the same time.
Cautious Sentiment Limits Market Moves Despite Risk Aversion
Risk aversion continues to dominate the global financial markets today, although the weakness in US futures has been relatively contained. While some volatility could arise from the US JOLTS labor market data, traders would largely be holding off for tomorrow's ISM services data and Friday’s non-farm payroll report. As a result, market movements are expected to be relative limited as caution remains the prevailing sentiment.
Canadian Dollar is among the weaker performers today as traders await BoC's rate cut decision. A key focus will be whether BoC provides any guidance on the extent of the current easing cycle or if it will reserve further details for the October Monetary Policy Report, which will include updated economic forecasts.
So far this week, Yen has emerged as the strongest currency, followed by Dollar and then Euro. On the other end, New Zealand Dollar is the weakest, followed by Australian Dollar and Canadian Dollar. Swiss Franc and British Pound are trading in the middle, with the Franc giving back some of its earlier gains.
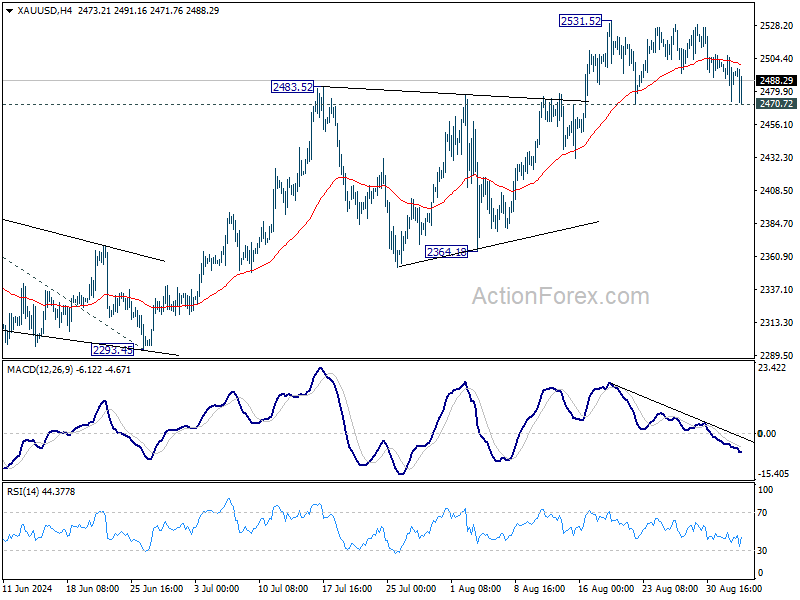
Technically, while Gold dipped notably earlier today it's continuing to draw support from 2470.72. Price actions from 2531.52 are viewed as sideway consolidation, which might be near to completing a three wave pattern. Strong rebound from current level, followed by break of 2531.62 resistance will confirm long term up trend resumption. However, decisive break of 2470.72 will complete a double top pattern, and bring deeper pull back, with risk of falling further towards 2364.18 support.
In Europe, at the time of writing, FTSE is down -0.56%. DAX is down -0.88% CAC is down -1.13%. UK 10-year yield is up 0.013 at 3.982. Germany 10-year yield is down -0.036 at 2.242. Earlier in Asia, Nikkei fell -4.24%. Hong Kong HSI fell -1.10%. China Shanghai SSE fell -0.67%. Singapore Strait Times fell -1.12%. Japan 10-year JGB yield fell -0.0362 to 0.890.
Eurozone PPI rises 0.8% in Jul, driven by energy costs
In July, Eurozone PPI rose 0.8% mom, surpassing expectations of 0.3% mom increase. On a yearly basis, however, PPI was down by -2.1% yoy, though better than the expected -2.5% yoy decline. Energy costs were the primary driver, with prices surging by 2.8% mom during the month, while other sectors showed more modest or negative price movements. Intermediate goods fell by -0.1% mom, durable consumer goods rose 0.1% mom, and non-durable consumer goods dipped by -0.1% mom. Prices for capital goods remained unchanged.
EU-wide PPI also saw significant movement, falling -0.8% mom and -19% yoy. The biggest monthly price increases were recorded in Bulgaria (+3.6%), Greece (+2.9%), and Romania (+2.7%), while the largest decreases occurred in Sweden (-0.9%), Finland (-0.7%), and Austria (-0.2%).
Eurozone PMI services finalized at 52.9, cost pressures ease
Eurozone's services sector showed improved growth in August, with PMI Services index rising to 52.9 from July’s 51.9, while the PMI Composite increased to 51.0 from 50.2. Both readings marked three-month highs, signaling a strengthening in overall economic activity. According to HCOB, input cost inflation eased to its lowest point in 2024, though the rate of increase in output charges ticked up slightly.
Country-specific data revealed a mixed picture, with Spain leading the pack with a Composite PMI of 53.5, a two-month high, followed by France at 53.1, a 27-month high. Ireland's Composite PMI hit 52.6, its highest in five months, while Italy recorded a two-month high at 50.8. On the other hand, Germany saw its Composite PMI fall to 48.4, a five-month low.
Cyrus de la Rubia, Chief Economist at Hamburg Commercial Bank, pointed to the "Olympic effect" as a key factor ensuring GDP growth in Eurozone for Q3. While services sector is performing well across all major Eurozone economies, the manufacturing sector remains in recession, with worsening conditions in key countries like Germany and France.
On the inflation front, service providers slightly increased their prices in August, but cost pressures, particularly those driven by wages, have eased. This will likely be a positive signal for ECB, which may "breathe a small sigh of relief" as it weighs its policy decisions. Combined with favorable inflation data from Eurostat, these factors could provide the ECB with further justification to cut interest rates at its upcoming meeting on September 12.
UK PMI services finalized at 53.7, inflation pressures ease
UK services sector continued its expansion in August, with the PMI Services index finalized at 53.7, up from 52.5 in July, marking the 10th consecutive month of growth. PMI Composite also showed improvement, climbing to 53.8 from 52.8, indicating the fastest pace of overall economic growth since April.
Tim Moore, Economics Director at S&P Global Market Intelligence, noted that "August data highlighted a recovery in UK service sector performance" as improving economic conditions and domestic political stability supported customer demand. New business saw a robust increase after a summer slowdown in decision-making, fueling the strongest service sector activity in months.
Service providers responded to this uptick by increasing staff levels, with job creation outpacing the first half of 2024. However, businesses still faced challenges from shortage of candidates and rising wage pressures. Despite higher salary payments, the rate of input price inflation continued to fall, reaching its lowest level since January 2021. In addition, prices charged by service providers rose at the slowest pace in three-and-a-half years, further indicating easing inflationary pressures in the sector.
Japan's PMI services finalized at 53.7, expansion continues
Japan's services sector continued its expansion in August, with PMI Services index finalized at 53.7, unchanged from July's figure. This marks the 23rd month of growth out of the past 24. PMI Composite, which includes both services and manufacturing, rose to 52.9 from 52.5 in July, reflecting the strongest overall growth since May 2023.
The services sector showed solid performance, while manufacturing output posted its most significant increase since May 2022. According to Usamah Bhatti, economist at S&P Global Market Intelligence, August saw ongoing growth in activity, new business, and employment in the service sector. However, the pace of employment growth and business optimism slowed to seven- and 19-month lows, respectively.
Australia's GDP grows 0.2% qoq in Q2, per capita down for sixth quarter
Australia's GDP grew by 0.2% qoq in Q2, aligning with market expectations. However, GDP per capita declined for the sixth consecutive quarter, falling by -0.4% qoq. For the 2023-24 financial year, the economy expanded by 1.5%.
Katherine Keenan, head of national accounts at the Australian Bureau of Statistics, noted, "The Australian economy grew for the eleventh consecutive quarter, although growth slowed over the 2023-24 financial year."
Keenan also pointed out that excluding the pandemic period, annual financial year growth was the lowest since 1991-92, a year marked by the recovery from the 1991 recession.
China's Caixin PMI services falls to 51.6, composite unchanged at 51.2
China's Caixin PMI Services fell to 51.6 in August, down from 52.1 in July and below expectations of 52.2. While this marked the continuation of an expansion that began in January 2023, the rate of growth is among the slowest seen this year. PMI Composite remained steady at 51.2, indicating ten consecutive months of expansion.
According to Wang Zhe, Senior Economist at Caixin Insight Group, the services sector experienced a slight slowdown in supply and demand growth, in contrast to a recovery in manufacturing. One key concern was the services sector’s shrinking labor market, which pulled the composite employment indicator below the 50.0 mark, signaling a marginal contraction in employment.
On the pricing front, while input costs increased in both sectors, prices charged by manufacturers and service providers fell, adding pressure to business profitability. This combination of slower services growth and declining prices suggests increasing challenges for Chinese businesses as they contend with rising costs and shrinking profit margins.
EUR/USD Mid-Day Outlook
Daily Pivots: (S1) 1.1018; (P) 1.1051; (R1) 1.1075; More....
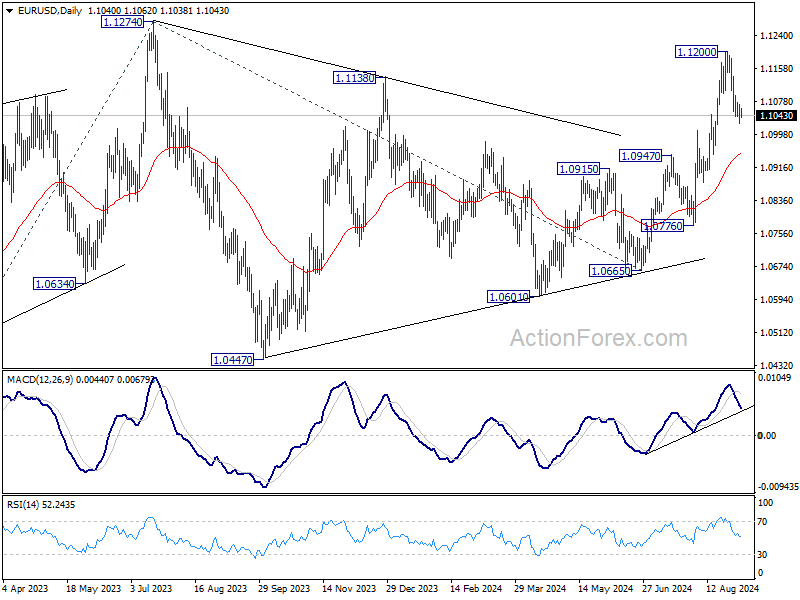
Intraday bias in EUR/USD stays neutral at this point. While retreat from 1.1200 might extend lower, rally from 1.0665 is in favor to continue as long as 1.0947 resistance turned support holds. Above 1.1104 minor resistance will bring retest of 1.1200 first. Break there will target 1.1274 high next. However, firm break of 1.0947 will indicate reversal and turn bias back to the downside.
In the bigger picture, prior break of 1.1138 resistance indicates that corrective pattern from 1.1274 has completed at 1.0665 already. Decisive break of 1.1274 (2023 high) will confirm whole up trend from 0.9534 (2022 low). Next target will be 61.8% projection of 0.9534 to 1.1274 from 1.0665 at 1.1740. This will now be the favored case as long as 1.0947 resistance turned support holds.
Economic Indicators Update
| GMT | Ccy | Events | Actual | Forecast | Previous | Revised |
|---|---|---|---|---|---|---|
| 01:30 | AUD | GDP Q/Q Q2 | 0.20% | 0.20% | 0.10% | |
| 01:45 | CNY | Caixin Services PMI Aug | 51.6 | 52.2 | 52.1 | |
| 07:50 | EUR | France Services PMI Aug F | 55 | 55 | 55 | |
| 07:55 | EUR | Germany Services PMI Aug F | 51.2 | 51.4 | 51.4 | |
| 08:00 | EUR | EurozoneServices PMI Aug F | 52.9 | 53.3 | 53.3 | |
| 08:30 | GBP | Services PMI Aug F | 53.7 | 53.3 | 53.3 | |
| 09:00 | EUR | Eurozone PPI M/M Jul | 0.80% | 0.30% | 0.50% | 0.60% |
| 09:00 | EUR | Eurozone PPI Y/Y Jul | -2.10% | -2.50% | -3.20% | -3.30% |
| 12:30 | USD | Trade Balance (USD) Jul | -78.8B | -76.4B | -73.1B | -73.0B |
| 12:30 | CAD | Trade Balance (CAD) Jul | 0.7B | -0.3B | 0.6B | -0.2B |
| 13:45 | CAD | BoC Interest Rate Decision | 4.25% | 4.50% | ||
| 14:30 | CAD | BoC Press Conference | ||||
| 18:00 | USD | Fed's Beige Book |