
Sample Category Title
RBA’s Bullock reiterates no rate cuts soon, stresses vigilance on inflation risks
In a speech today, RBA Governor Michele Bullock reaffirmed that the central bank is unlikely to cut interest rates in the near term, provided the economy evolves as anticipated.
Bullock emphasized that the Board remains "vigilant to upside risks to inflation" and that monetary policy will need to stay "sufficiently restrictive" until there is clear evidence that inflation is moving sustainably towards the target range.
Although inflation has fallen significantly from its peak, it remains above the midpoint of RBA's 2–3% target range, with underlying inflation, as measured by the trimmed mean, still at 3.9% in June.
RBA aims to bring inflation back to target without jeopardizing the labor market gains made in recent years, navigating what Bullock described as the "narrow path."
The central bank’s August forecast anticipates underlying inflation returning to the target range by the end of 2025, a "slightly slower" timeline than previously projected. While the labor market remains relatively tight, Bullock noted that it is expected to "ease gradually" over the next few years as the economy adjusts.
Crude Oil Prices Plunge: Can $68 Hold Withstand Pressure?
Key Highlights
- Crude oil prices gained bearish momentum and declined below $72.00.
- A major bearish trend line is forming with resistance at $76.00 on the 4-hour chart.
- Gold could correct lower if it stays below $2,500 for a long time.
- The US ADP employment could change by 145K in August 2024.
Crude Oil Price Technical Analysis
Crude oil prices failed to gain pace above the $75.00 and $76.00 levels. As a result, there was a fresh decline below the $73.50 support.
Looking at the 4-hour chart of XTI/USD, the price declined below the $72.50 support, the 100 simple moving average (red, 4-hour), and the 200 simple moving average (green, 4-hour). It even spiked below the $70.00 support.

The first major support sits near the $68.00 level. A daily close below $68.00 could open the doors for a larger decline. The next major support is $62.00. Any more losses might send oil prices toward $60.00 in the coming sessions.
If there is another increase, the price might face resistance near the $71.50 level. The next major resistance is near the $72.65 zone, above which the price may perhaps accelerate higher.
In the stated case, it could even visit the $75.00 resistance. There is also a major bearish trend line forming with resistance at $76.00 on the same chart.
Looking at Gold, the price is consolidating below the $2,500 pivot level and there are chances of a downside correction toward $2,450.
Economic Releases to Watch Today
- US Initial Jobless Claims - Forecast 230K, versus 231K previous.
- US ISM Services Index for August 2024 – Forecast 51.1, versus 51.4 previous.
- US ADP Employment Change for August 2024 - Forecast 145K, versus 122K previous.
BoJ’s Takata: Additional rate increases on the table if economy aligns with forecasts
BoJ board member Hajime Takata indicated in a speech today that the central bank may need to "adjust the degree of monetary easing further" if inflation trends align with forecasts and companies continue increasing spending, wages, and passing on costs through price hikes.
Takata also pointed out the challenges posed by the differing monetary policies of the US and European central banks, which are now moving toward rate cuts. He cautioned that the delayed effects of their aggressive tightening could still impact Japan's economy. "We must carefully monitor domestic and overseas developments," Takata added.
Market turbulence, particularly in stocks and currencies, has been significant since early August, and Takata acknowledged that "the fallout continues." He stressed the need for the BoJ to scrutinize market developments and their impact on Japan's economy.
Real wages rise for second month in Japan, boosted by summer bonuses
Japan’s real wages rose by 0.4% yoy in July, down from June’s 1.1% yoy, but still marking the second consecutive month of growth after 27 months of decline.
Nominal wages increased by 3.6% yoy, surpassing expectations of 3.1%, but slowing from June’s 4.5% yoy. Regular pay, which rose 2.7% yoy, achieved its fastest growth in nearly 32 years. However, overtime pay, often seen as a gauge of corporate strength, dipped slightly by -0.1% yoy.
Special payments, such as bonuses, played a significant role in lifting wage growth during the summer, with a 6.2% yoy increase in July, following a 7.8% yoy rise in June.
A labor ministry official noted, “From August and thereafter, monthly wages will be a deciding factor” in sustaining real wage growth, as the contribution from special payments will diminish in the coming months.
Fed’s Daly to assess upcoming data before finalizing rate cut size
In an interview with Reuters, San Francisco Fed President Mary Daly acknowledged that a rate cut is widely expected this month, but emphasized that the exact size of the cut remains uncertain.
"We don't know yet, right?" Daly said, noting that key data such as the upcoming labor market and CPI reports will play a critical role in the decision-making process. She added, "I want more time to do all the work that's needed to make the best decision."
Daly also warned of the risks of over-tightening, particularly as inflation eases while the economy slows. "As inflation falls, we've got a real rate of interest that's rising into a slowing economy; that's a basic recipe for over-tightening," she explained.
Highlighting the importance of protecting the labor market, she stressed that further slowing would be "unwelcome" and a key factor in shaping future policy decisions.
Fed’s Beige Book signals slowdown with widespread stagnation across districts
Fed's latest Beige Book report highlights a growing economic slowdown across the US. While economic activity grew slightly in three Districts, the number of Districts reporting flat or declining activity increased from five in the previous period to nine in the current period, indicating broader stagnation.
Employment levels were generally "flat to up slightly", with five Districts noting modest increases in headcounts. However, some Districts reported that firms are reducing shifts, leaving positions unfilled, or trimming headcounts through attrition, though layoffs remain uncommon. Wage growth continues at a modest pace, consistent with the recent trend of slowing wage increases.
Overall, prices increased modestly during the reporting period, but three Districts saw only slight rises in selling prices. Nonlabor input costs were mostly described as modest to moderate and generally easing, though one District reported a slight uptick in input cost increases.
Stocks Could Suffer After the September Fed Rate Cut
- US labour market data to determine the size of the first Fed rate cut
- History points to an increased possibility of a 50bps move
- Analysis reveals sizeable equities’ weakness after the initial cut
Following Fed Chairman Powell's appearance at the Jackson Hole Symposium and this indirect announcement of the much-discussed Fed rate cut, the market is counting down to the September 18 meeting. This week's labour market data could play a role in the size of this rate move with a negative set of prints potentially keeping the door open to a 50bps decrease.
This rate cut will be the first interest rate reduction since the 150bps of easing announced during March 2020 amidst the COVID pandemic outbreak. One must go back to 2019 for the first "normal" monetary policy easing with three consecutive 25bps cuts announced back then. Powell called these rate cuts “mid-cycle adjustment" as inflation was below the 2% level and the trade war between the US and China was in full swing.
Six initial rate cuts since 2000
Scrolling through the Fed’s actions since 2000, six easing cycles can be identified. Table 1 below shows the details of the initial interest rate cuts with both the 2002 and 2008 reductions featuring in the list. Both moves came after extensive Fed pauses and are hence each treated as the start of a new easing cycle.
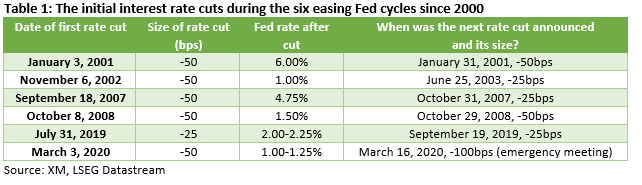
The market is currently pricing in a 39% possibility of a 50bps rate move in two weeks’ time. This looks low considering that on five out of the six occasions examined, the Fed commenced its rate cut cycle with a 50bps move. However, such a move might be more difficult this time around since the US data on the whole are satisfactory, and the US presidential election is just around the corner.
Additionally, the market is currently expecting around 103bps of easing until year-end. As there are just three meetings left in 2024, the Fed is expected to announce rate cuts at every gathering, including the November 7 one. Historically, the Fed announced back-to-back cuts on four of the six periods examined.
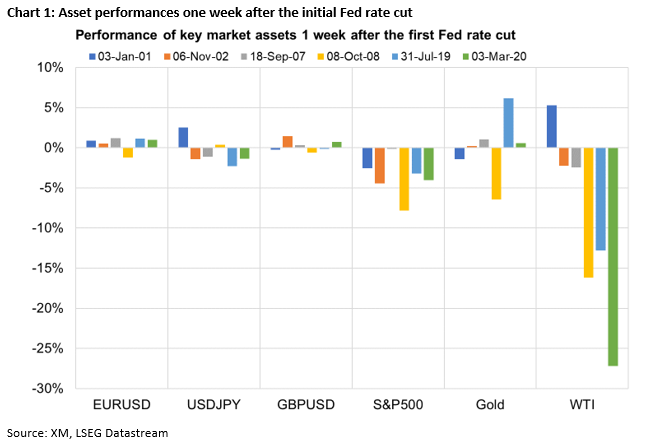
How did the market perform one week after the initial Fed rate cut?
Chart 1 below presents the performance of key market assets one week after the initial Fed rate cut. Digging through the data, some interesting trends can be identified. Specifically, the S&P 500 stock index dropped by an average of 3.7% in the six periods examined, reflecting the market’s concerns about the overall economic outlook.
Interestingly, the US dollar tends to suffer in the aftermath of the initial Fed rate cut with euro/dollar rallying in five out of the six periods examined. Additionally, with the exception of 2001, WTI oil futures usually fall by 2.3%-27.2%, potentially reflecting the market’s concerns about a significant economic slowdown, and even recession.
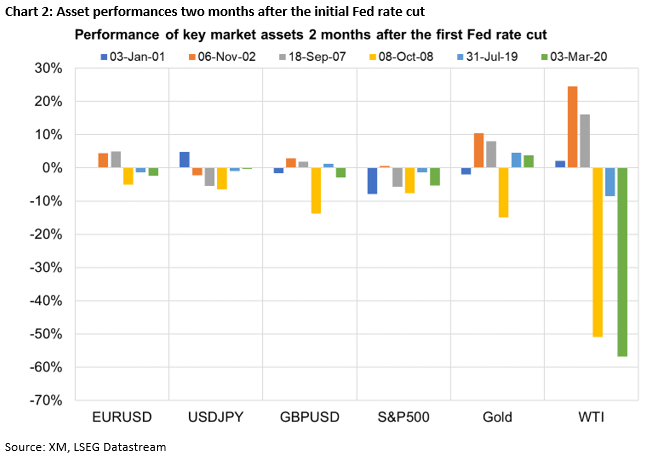
Asset performances two months after the first rate cut
The picture becomes less clear when analyzing the market’s performance two months after the first Fed rate cut. However, this timeframe is rather important as it encompasses the November 5 US presidential election and the subsequent Fed meeting (November 7).
As seen in Chart 2 below, WTI oil futures suffered in 2008, 2019 and 2020, while the US dollar had a more mixed performance in the two months after the initial rate cut. On the flip side, based on the analysis’ findings, the 10-year US treasury yield tends to fall by an average of 38bps in the examined timeframe.
Additionally, the S&P 500 index was under pressure in five of the six periods examined as market participants were quite anxious about the state of the US economy. Interestingly, this equities’ weakness was one of the key findings in an earlier special report analyzing the performance of key assets two months ahead of the US presidential election.
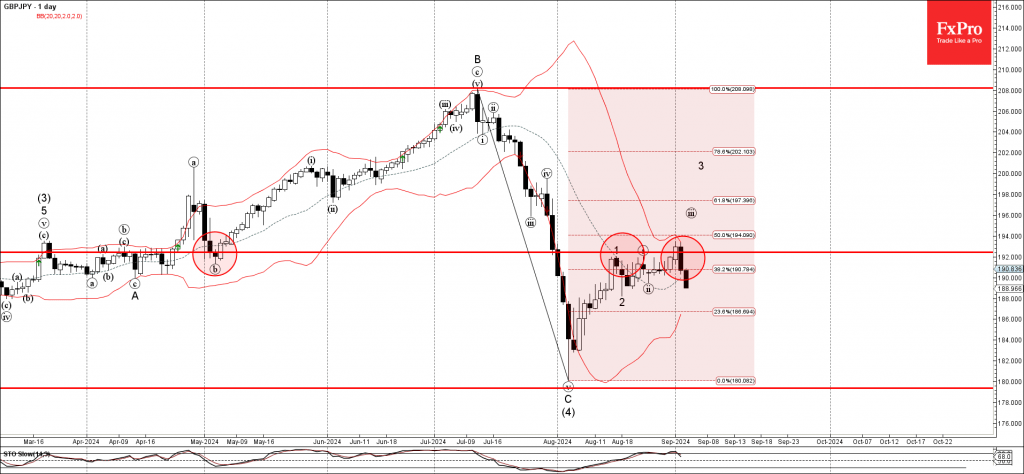
GBPJPY Wave Analysis
- GBPJPY reversed from resistance level 192.40
- Likely to fall to support level 188.00
GBPJPY currency pair recently reversed down from the key resistance level 192.40 (which has been reversing the price from the middle of April) standing near the upper daily Bollinger Band.
The resistance level 192.40 was further strengthened by the 50% Fibonacci correction of the sharp downward impulse C from the start of July.
Given the strength of the resistance level 192.40, GBPJPY currency pair can be expected to fall further to the next support level 188.00, low of the previous correction 2.
WTI Crude Oil Wave Analysis
- WTI crude oil broke key support level 71.40
- Likely to fall to support level 68.00
WTI crude oil recently broke sharply below the key support level 71.40 (which has been repeatedly reversing the price from the start of February).
The breakout of the support level 71.40 accelerated the active impulse wave c of the medium-term ABC correction 2 from April.
WTI crude oil can be expected to fall to the next support level 68.00, low of the previous correction (2) from December – from where the price is likely to correct up.
