
Sample Category Title
EUR/USD Mid-Day Outlook
Daily Pivots: (S1) 1.1018; (P) 1.1051; (R1) 1.1075; More....
Intraday bias in EUR/USD stays neutral at this point. While retreat from 1.1200 might extend lower, rally from 1.0665 is in favor to continue as long as 1.0947 resistance turned support holds. Above 1.1104 minor resistance will bring retest of 1.1200 first. Break there will target 1.1274 high next. However, firm break of 1.0947 will indicate reversal and turn bias back to the downside.
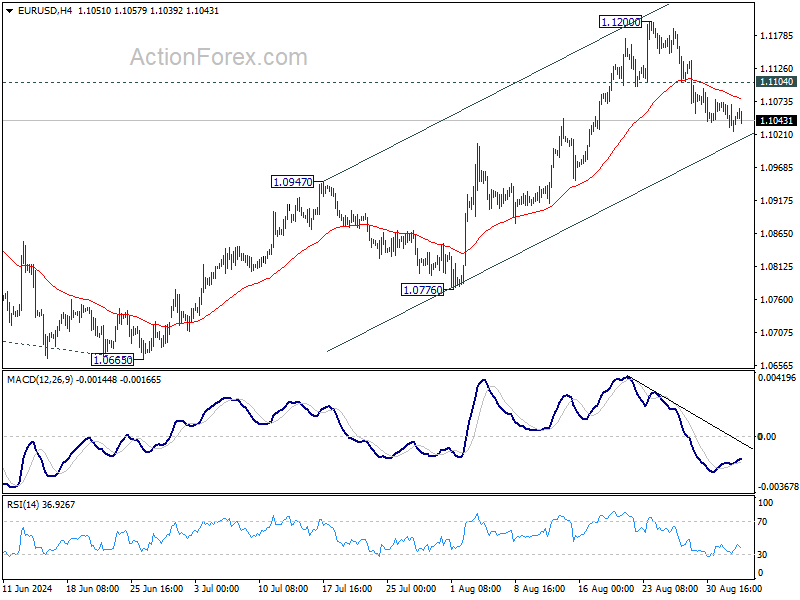
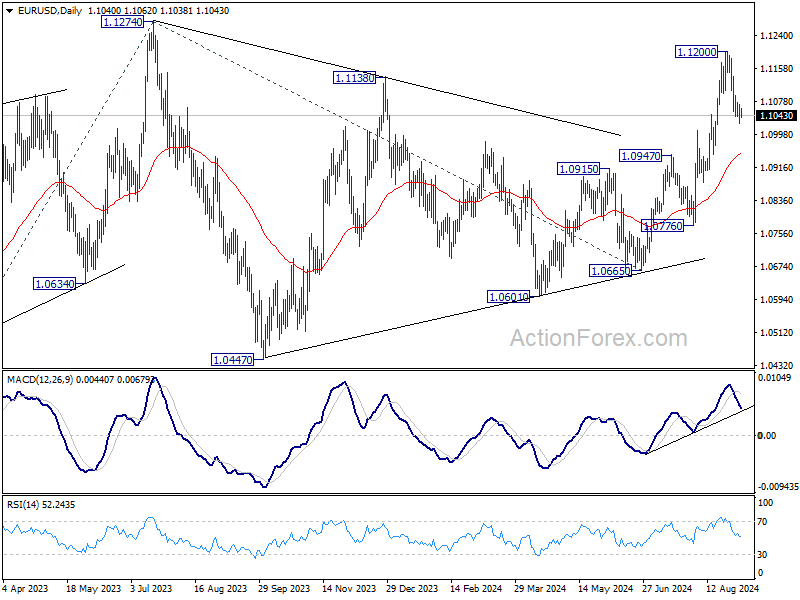
In the bigger picture, prior break of 1.1138 resistance indicates that corrective pattern from 1.1274 has completed at 1.0665 already. Decisive break of 1.1274 (2023 high) will confirm whole up trend from 0.9534 (2022 low). Next target will be 61.8% projection of 0.9534 to 1.1274 from 1.0665 at 1.1740. This will now be the favored case as long as 1.0947 resistance turned support holds.
GBP/USD Mid-Day Outlook
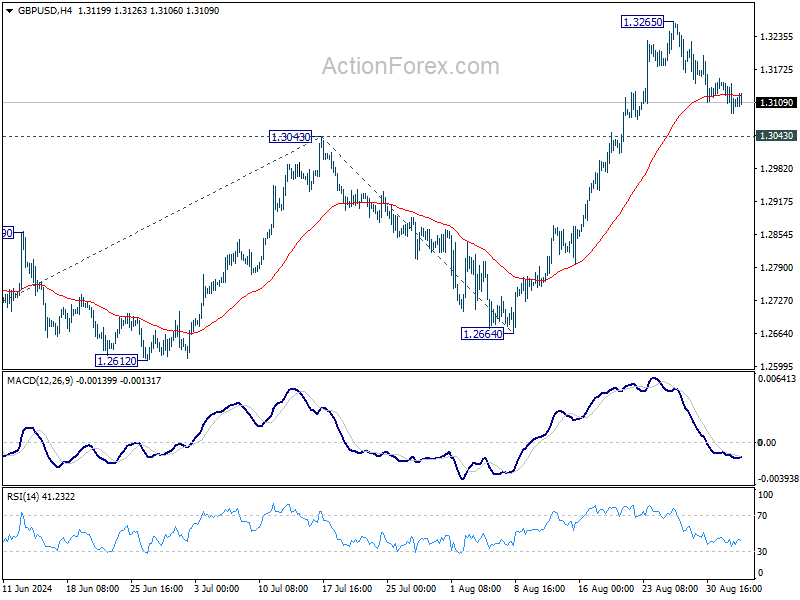
Daily Pivots: (S1) 1.3084; (P) 1.3119; (R1) 1.3150; More...
No change in GBP/USD's outlook as consolidation from 1.3265 is still in progress. Intraday bias remains neutral for the moment. While deeper retreat cannot be ruled out, downside should be contained well above 1.3043 resistance turned support to bring rebound. On the upside, above 1.3265 will resume larger up trend to 100% projection of 1.2298 to 1.3043 from 1.2664 at 1.3409. However, firm break of 1.3043 will indicate short term topping and turn bias back to the downside for deeper pullback.
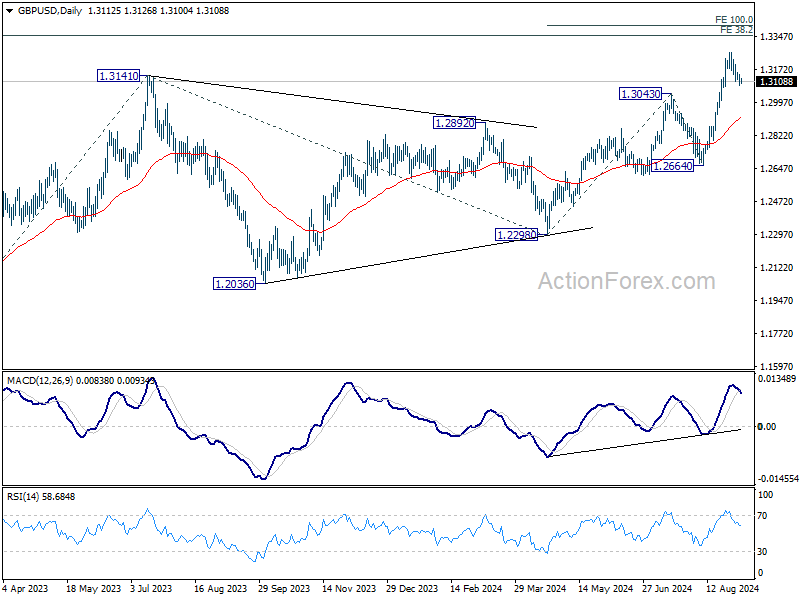
In the bigger picture, up trend from 1.0351 (2022 low) is resuming. Next target is 38.2% projection of 1.0351 to 1.3141 from 1.2298 at 1.3364. For now, outlook will stay bullish as long as 1.2664 support holds, even in case of deep pullback.
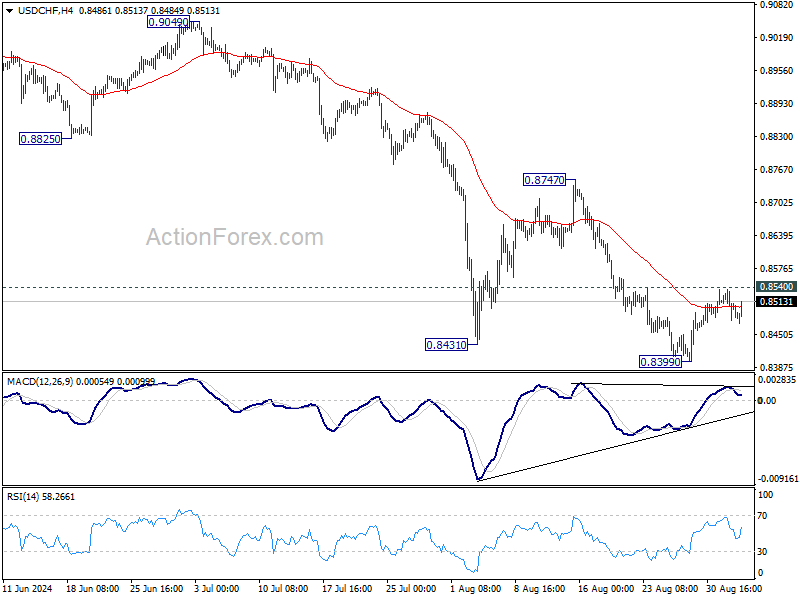
USD/CHF Mid-Day Outlook
Daily Pivots: (S1) 0.8474; (P) 0.8506; (R1) 0.8534; More…
Intraday bias in USD/CHF remains neutral at is point. Further decline is expected as long as 0.8540 resistance holds. Break of 0.8339 will resume the fall from 0.9223 and target 0.8332 low. However, considering bullish convergence condition in 4H MACD, firm break of 0.8540 will confirm short term bottoming, and turn bias back to the upside for 0.8747 resistance instead.
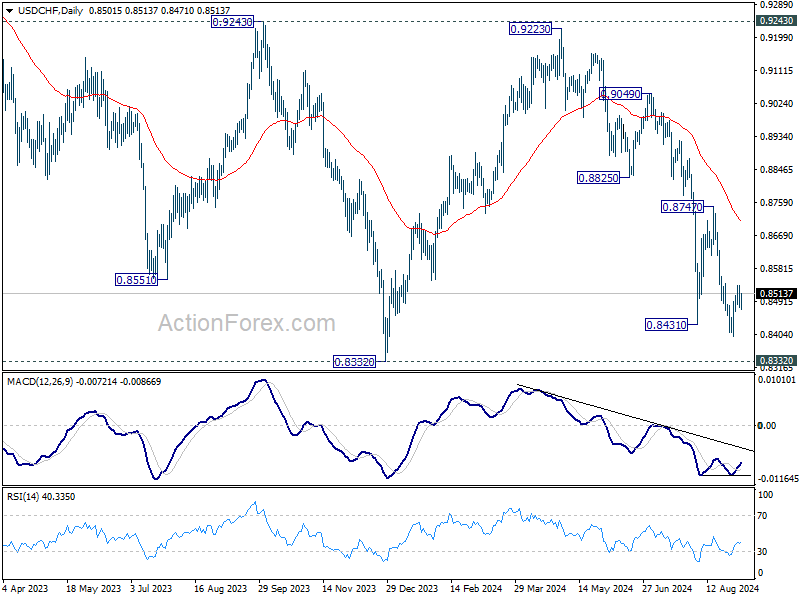
In the bigger picture, price actions from 0.8332 (2023 low) are currently seen as a medium term corrective pattern, with fall from 0.9223 as the second leg. Strong support could be seen from 0.8332 to bring rebound. Yet, overall outlook will continue to stay bearish as long as 0.9243 resistance holds. Firm break of 0.8332, however, will resume larger down trend from 1.0146 (2022 high).
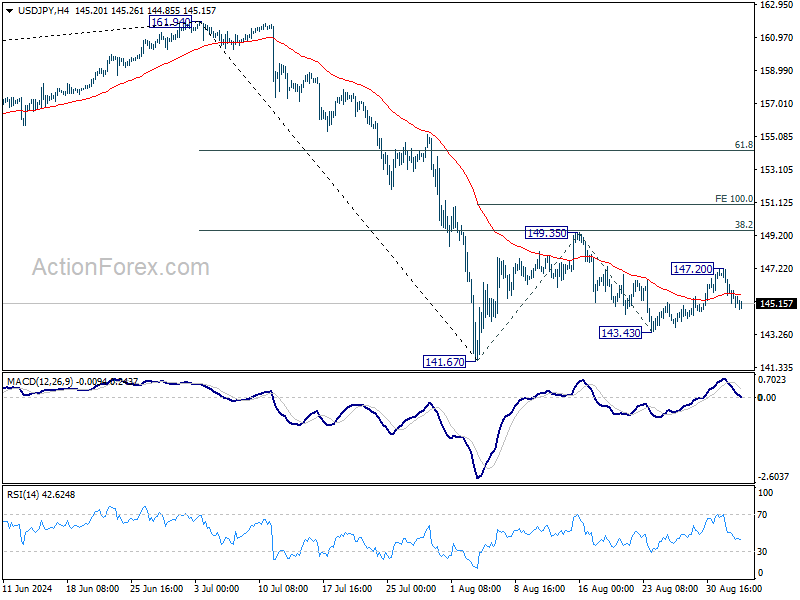
USD/JPY Mid-Day Outlook
Daily Pivots: (S1) 144.68; (P) 145.94; (R1) 146.73; More...
Range trading continues in USD/JPY in 143.43/147.20 and intraday bias remains neutral. Further rally will remain in favor as long as 143.43 support holds. Above 147.20 will target 149.35 resistance first. Firm break there will resume the rebound from 141.67 to 100% projection of 141.67 to 149.35 from 143.43 at 151.11, as the second leg of the corrective pattern from 161.94 high. However, break of 143.43 will bring retest of 141.67 low instead.
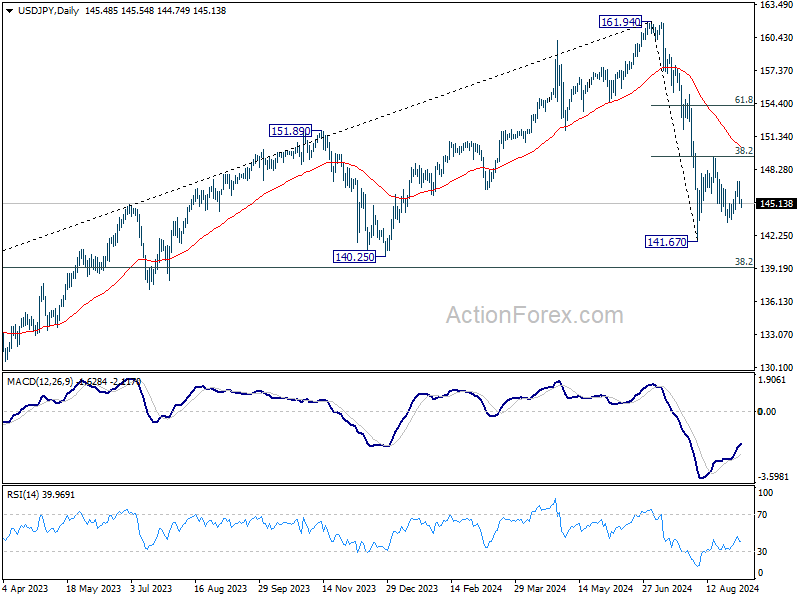
In the bigger picture, fall from 161.94 medium term top is seen as correcting whole up trend from 102.58 (2021 low). Deeper decline could be seen to 38.2% retracement of 102.58 to 161.94 at 139.26, which is close to 140.25 support. In any case, risk will stay on the downside as long as 55 W EMA (now at 149.47) holds. Nevertheless, firm break of 55 W EMA will suggest that the range for medium term corrective pattern is already set.
Gold (XAU/USD) Under Pressure as Precious Metal Fails to Attract Haven Bids
- Gold prices are trending down due to a lack of safe-haven bids and a strong US Dollar.
- Upcoming US jobs data and interest rate decisions will significantly impact gold’s future performance.
- September is historically a challenging month for gold, which could further influence its trajectory.
In the early European session, gold prices continued their downward trend as the precious metal struggled to attract haven bids. Known for its challenges during September, gold faces a potentially rocky path, especially with high prices inviting profit taking.
Additionally, looming rate cuts, which might already be factored into market expectations, could further influence gold’s trajectory. As we navigate this month, investors should remain vigilant of these trends in the precious metals market.
Recent Chinese data has reignited concerns about demand, putting pressure on the metals market. Despite expectations that recession fears would boost safe haven demand for precious metals, akin to the Japanese Yen, gold has struggled. This difficulty is compounded by the strength of the US Dollar, which continues to exert downward pressure on gold prices.
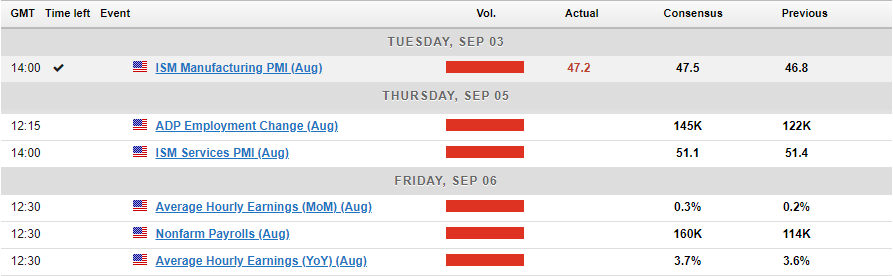
As markets brace for a potentially strong jobs report, ongoing recession concerns linger. Economists surveyed by Reuters predict that the US economy added 160,000 jobs in August, rebounding from July’s figure of 114,000. A solid report could ease recession fears and support a 25 basis point rate cut by the Federal Reserve on September 18.
Conversely, a weaker jobs report and rising unemployment could amplify recession worries, potentially boosting gold prices. However, any upside for gold might be limited, as much of the anticipated 25 basis point rate cut seems already priced in. This raises the question of whether the prospect of a 50 basis point cut could drive gold to new highs. As the jobs report date approaches, market expectations for a larger rate cut are gradually increasing, reflecting the shifting sentiment.
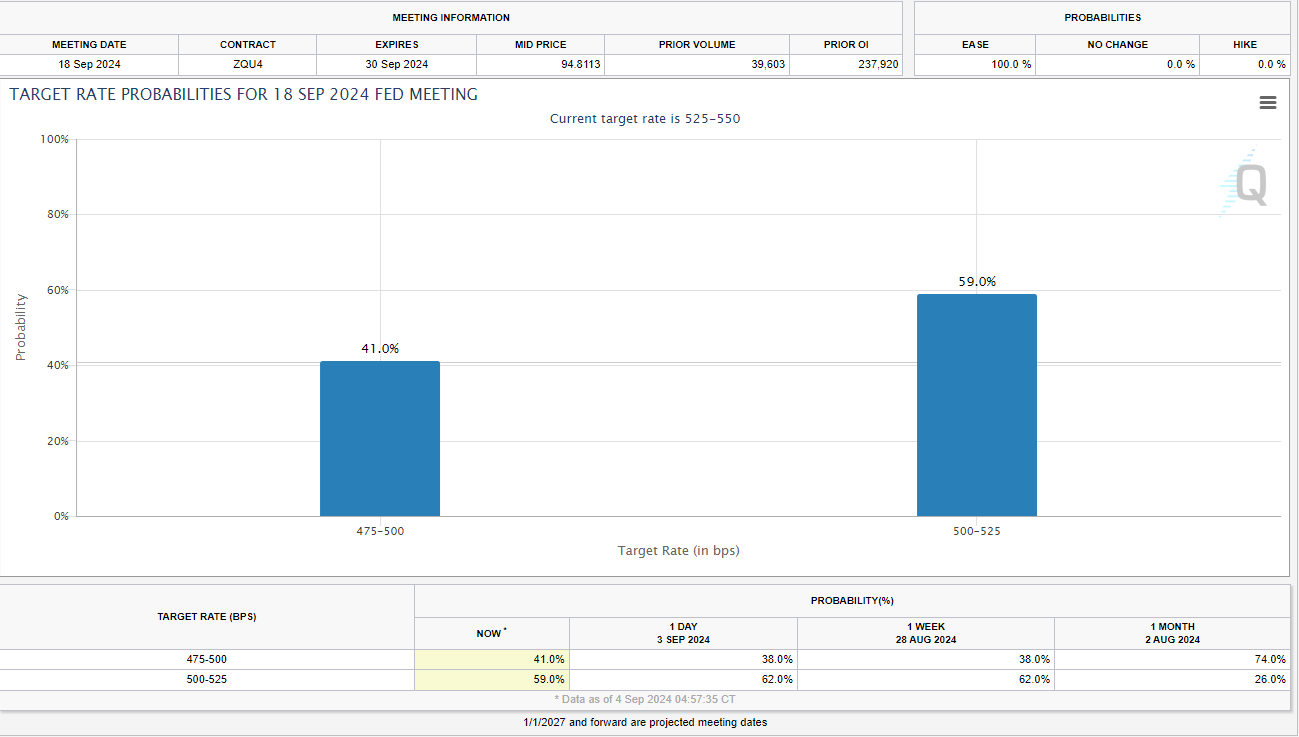
Source: CME FedWatch Tool
September has historically been a challenging month for gold, often coinciding with strength in the US Dollar, which could pressure gold prices in the medium term. Should the Federal Reserve implement a 25 basis point rate cut, we might see market participants engaging in the classic strategy of ‘buy the rumor, sell the fact’ during the Fed’s September meeting.
In the lead-up to Friday’s Non-Farm Payrolls (NFP) and jobs report, several other US economic indicators are poised to influence the dollar and recessionary concerns. Today, JOLTS job openings and US factory orders will be released, potentially offering further insights into the manufacturing sector after a disappointing PMI figure.
Thursday promises an even more impactful release with the ISM Services PMI, crucial for the US, which has largely transitioned to a service-oriented economy. This data is expected to set the stage for Friday’s much-anticipated jobs report, which will be closely watched by market participants.
Technical Analysis Gold (XAU/USD)
From a technical analysis standpoint, the four-hour gold chart presents some intriguing developments. It appears a double bottom pattern may have formed, suggesting potential upside movement. However, there’s an immediate challenge in the form of the 100-day moving average at 2495.85, which needs to be surpassed to confirm further gains.
Breaking above 2500.00 will be crucial, yet it must sustain these gains, especially with the upcoming jobs report, as any upward movement could trigger profit-taking and repositioning by traders.
Last week’s triangle pattern breakout, detailed in my previous gold analysis, has reached 2472, a previously identified target. This supports the possibility of an upward retracement, although the extent of this retracement remains uncertain.
On the downside, a decline would first need to breach the 2472 mark before the 200-day moving average and the psychological level of 2450 become pivotal points of focus.
GOLD (XAU/USD) Four-Hour (H4) Chart, August 23, 2024
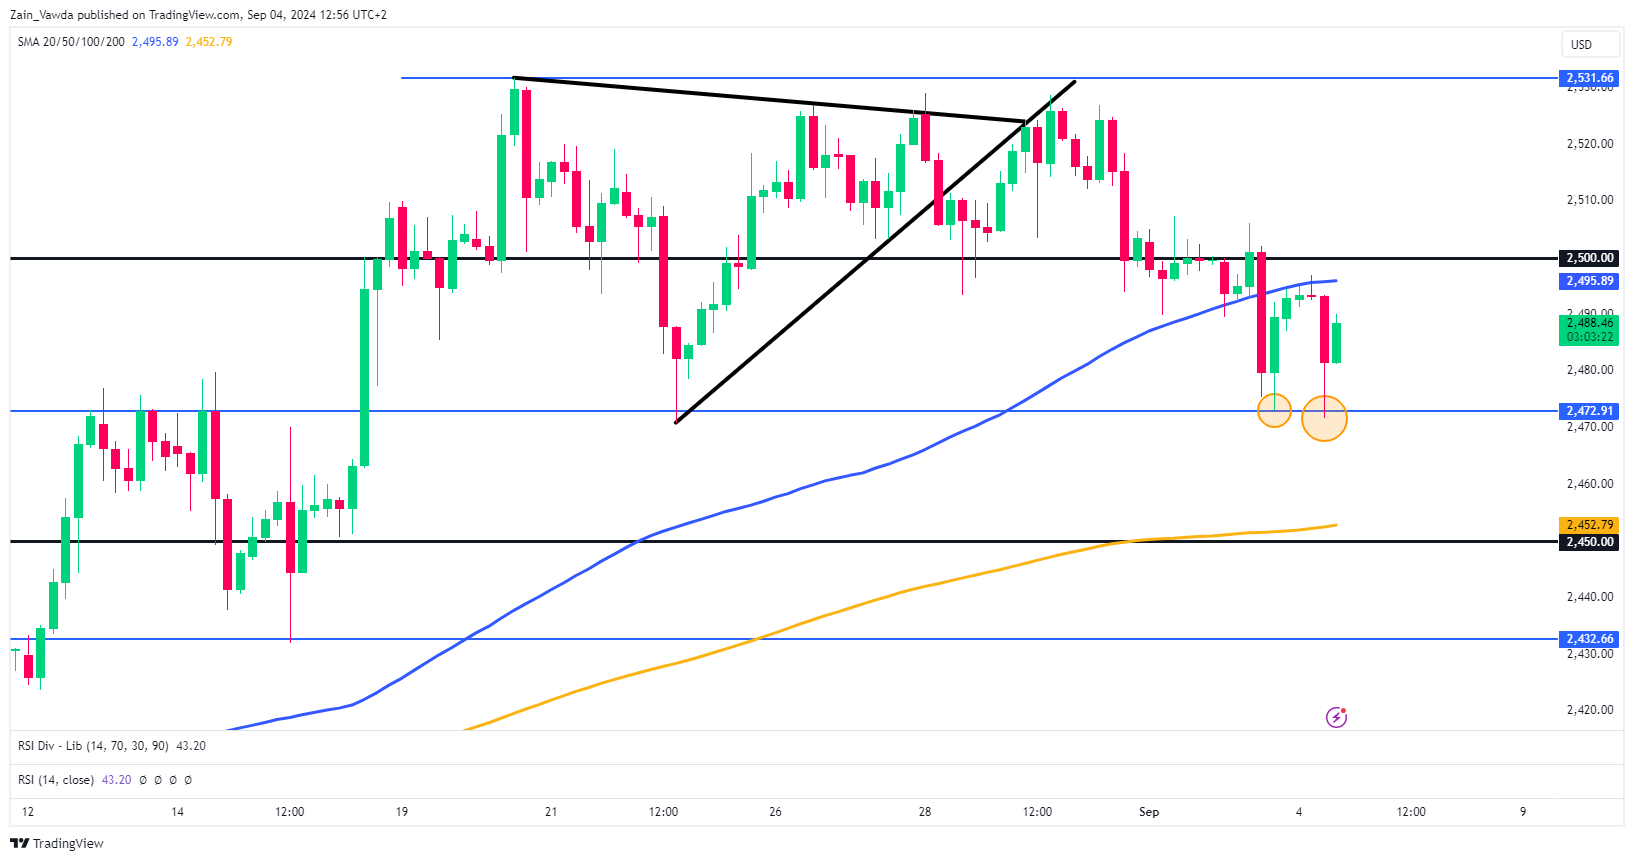
Source: TradingView (click to enlarge)
Support
- 2472
- 2450
- 2432
Resistance
- 2495
- 2513
- 2531
Canadian Dollar Steady Ahead of BoC Decision
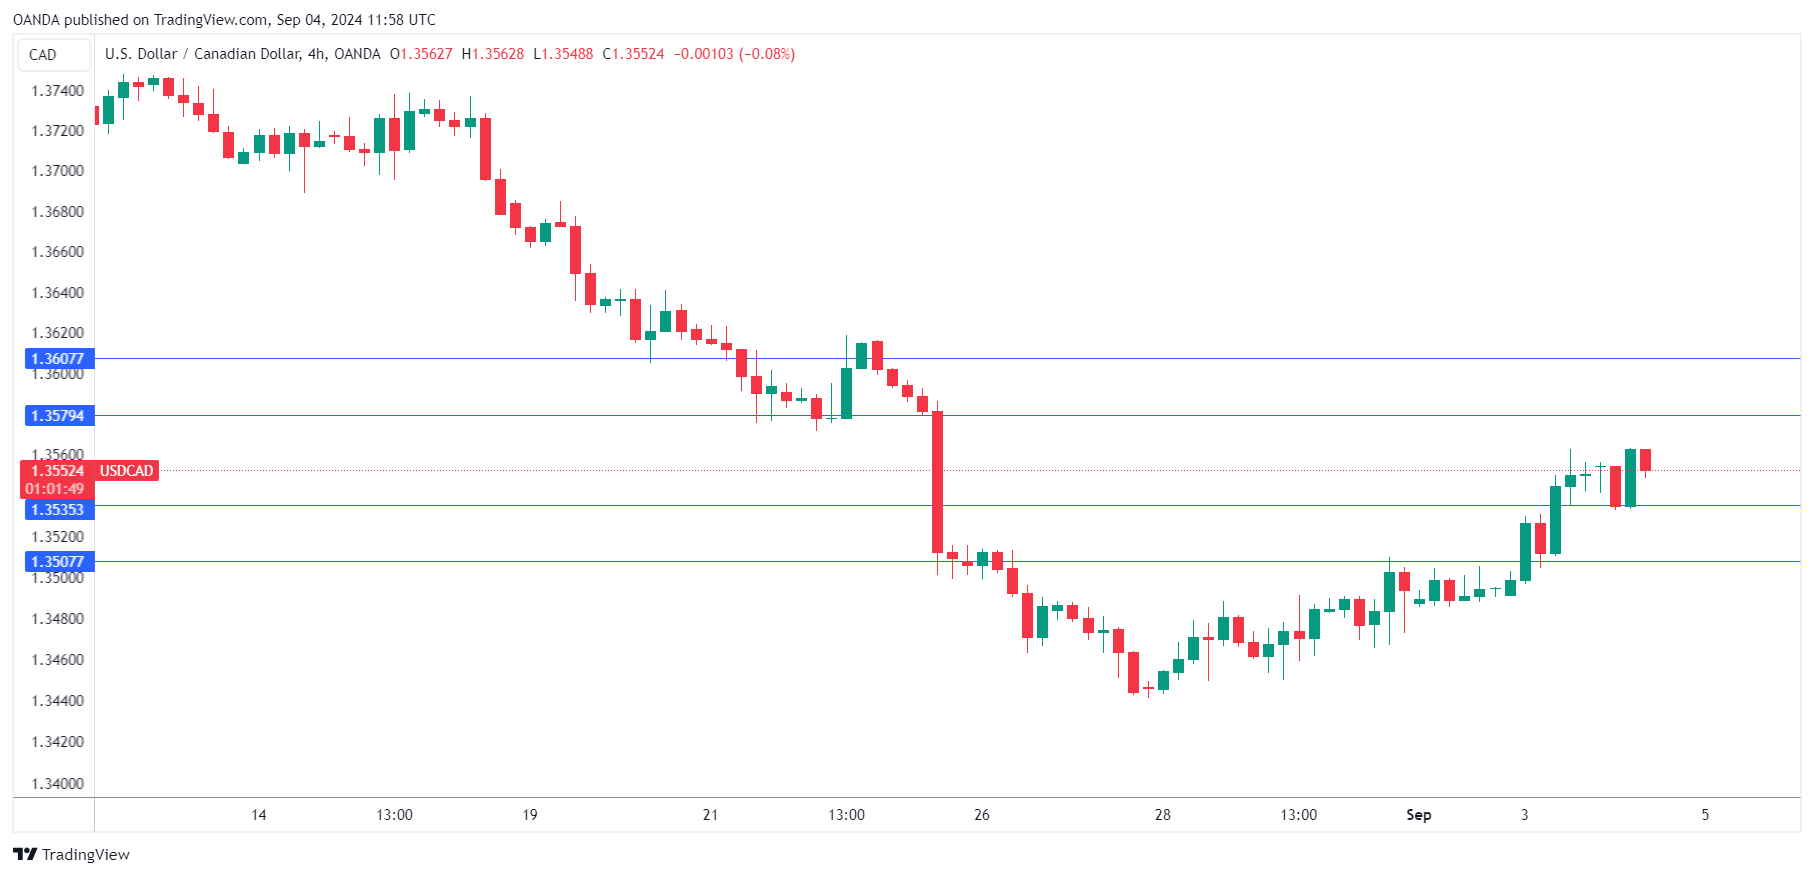
The Canadian dollar is showing limited movement on Wednesday. In the European session, USD/CAD is trading at 1.3555 at the time of writing, down 0.08%.
BoC expected to cut for third consecutive time
All eyes are on the Bank of Canada, which will announce its rate decision later today. The BoC is expected to lower rates by 25 basis points for the third successive time, the most cuts by any major central bank. The BoC is expected to continue cutting rates for the remainder of the year and into 2025 in order to boost Canada’s listless economy.
The fact that the Federal Reserve is widely expected to lower rates at this month’s meeting and possibly later in the year makes it easier for the BoC to continue trimming rates without diverging too widely from the Fed. As well, the Canadian dollar gained 2.2% against the greenback in August, which means that the BoC doesn’t have to worry as much about downward pressure on the Canadian dollar due to rate cuts.
Investors are prepared for a rate cut today but will be looking for insights about the new cutting cycle. Inflation has abated and has hovered within the BoC’s target range of between 1% and 3% for seven straight months. As with the Federal Reserve, policy makers are shifting focus from inflation to the labor market, which has been weakening. The BoC is aiming for a soft landing in which inflation falls without the labor market crashing and the economy tipping into a recession.
US employment data key to Fed decision
The US releases a host of employment data for the remainder of the week, which will determine the size of the Fed’s expected rate cut. The probability of a quarter-point cut has fallen from 70% last week to 59%, with the likelihood of a half-point cut rising from 30% to 41%, according to CME’s FedWatch. Later today, the US releases JOLT job openings, which is expected to ease to 8.10 million, compared to 8.18 million in July.
USD/CAD Technical
- There is resistance at 1.3579 and 1.3607
- 1.3535 and 1.3507 are the next support levels
Can Gold Prices Surge to New All-Time Highs by Year End?
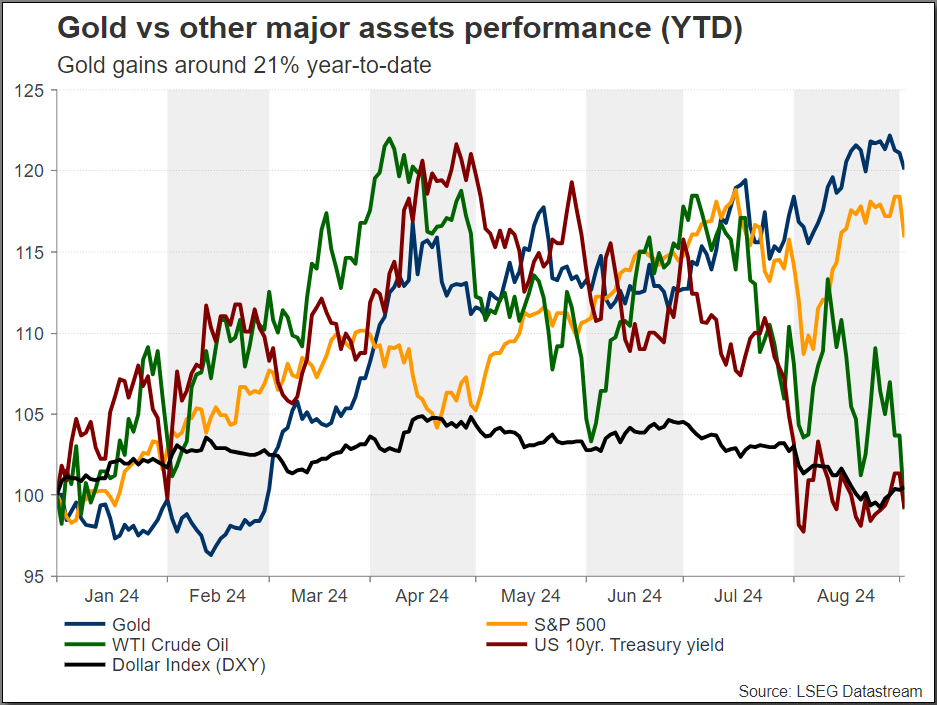
- Gold increases 21% so far this year
- US data and geopolitical tensions are driving gold
- Bigger picture remains strongly positive
Gold still soaring in long-term view
Gold has been performing remarkably well so far this year, with a gain of 21% and a record high of $2,531 on August 20. The impending release of US economic data, increased geopolitical tensions, and hints of nearing rate cuts from the Federal Reserve are the main driving forces behind this rise. When interest rates are low, noninterest-bearing gold is generally more appealing to investors.
Gold prices have been fluctuating within a restricted range over the last few days. Investors are primarily anticipating the first interest rate cut on September 18, with markets fully pricing in a 25-basis point reduction. This had contributed to the subdued volatility until worries about a slowdown in the US prompted investors to price in around a 40% probability of a larger 50-bps cut. Nevertheless, volatility might remain somewhat muted for bullion until investors can determine the Fed's potential future course.
Gold gains support from a dovish Powell
Fed Chair Powell's recent speech at the Jackson Hole symposium has had a significant impact on the recent increase in gold prices. Powell suggested that the Federal Reserve may reduce interest rates in the near future due to indications of a weakening labor market. This dovish posture has resulted in a decrease in US government bond yields, which has increased the appeal of non-yielding assets such as gold.
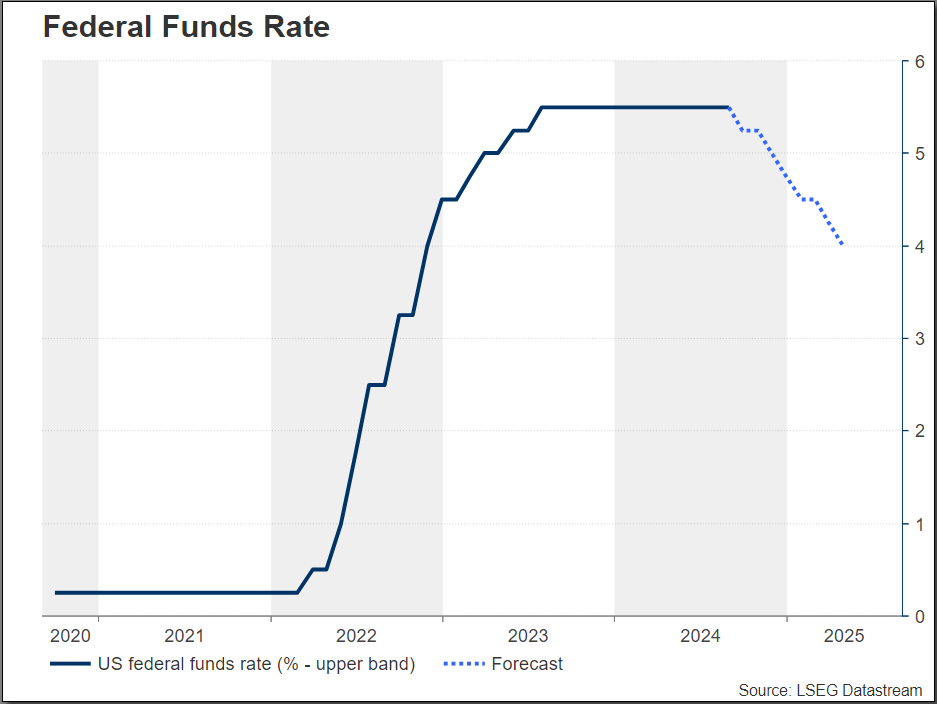
The expected interest rate cuts by the Federal Reserve in late 2024 could devalue the US dollar, thereby increasing the appeal of gold. But the previous metal is also benefiting from the uncertainty about the economic outlook. Although inflation is slowing down, it is still a worry for Fed policymakers. Moreover, economic data, including GDP growth and job numbers, are presenting conflicting signals, adding to gold’s appeal as a steady investment.
Geopolitical tensions
Along with the Fed's change in policy, rising global tensions, especially in the Middle East, have also helped push gold prices up. The ongoing conflicts have made things less certain, which is why investors are buying safe assets like gold. Important geopolitical factors, such as the deteriorating situation between Israel and Hezbollah and the increased likelihood of a larger regional war, have led investors to seek safety in gold as the world becomes less stable.
On Monday, President Joe Biden claimed that Israeli Prime Minister Benjamin Netanyahu was not acting sufficiently to negotiate a deal for the release of hostages kept in Gaza by Hamas, and that the US was almost ready to offer a last offer to negotiators working on a hostage and peace accord.
China plays crucial role on precious metal
The Chinese economy has had a major impact on the price of gold in 2024. The People's Bank of China resumed gold buying after a temporary break, greatly boosting gold demand. The Chinese government, as well as the public, are looking to gold as a hedge against economic uncertainty due to factors including the yuan's depreciation and persistent problems in the real estate sector.
The country's desire to diversify its currency portfolio and protect itself from geopolitical uncertainties has intensified its gold purchases. As a result, China's moves have been crucial in propelling gold prices around the world to record highs, and experts expect that this trend will likely continue all year.
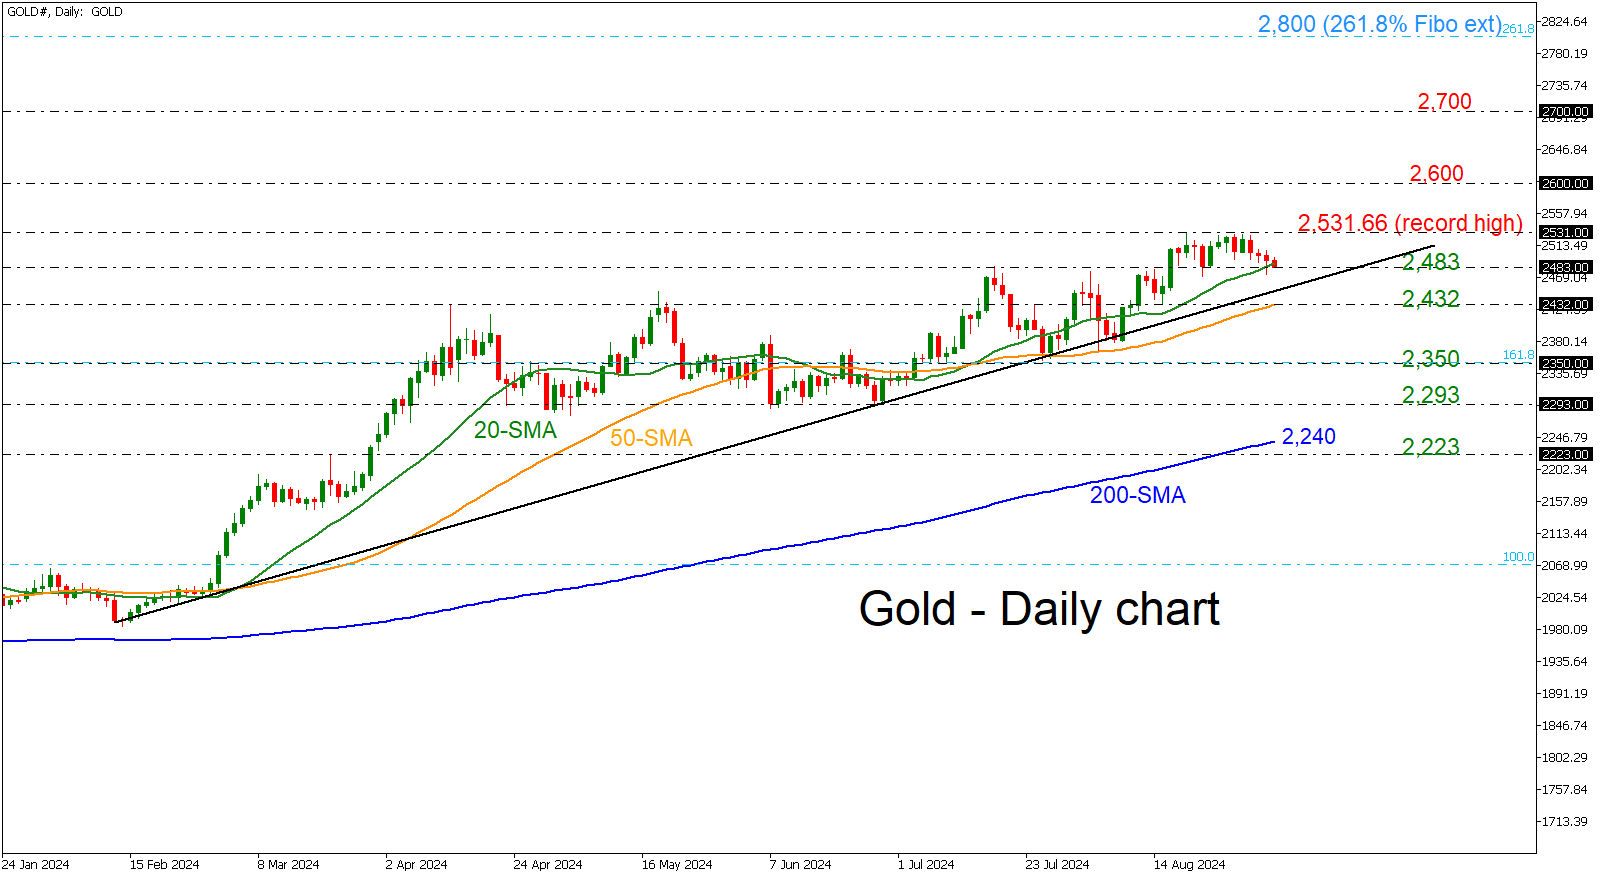
Technical picture remains bullish
Despite the latest pullback over the last few days, the precious metal remains strongly positive above the long-term ascending trend line. A rebound on the latter line may drive the market again towards the record peak of $2,531.66 before testing the next round numbers, such as $2,600 and $2,700. The downward wave from $2,070 to $1,616 has drawn the Fibonacci extension mark of $2,800, which appears to be a challenging level.
Alternatively, a drop beneath the 200-day simple moving average (SMA) at $2,240 could switch the outlook to bearish.
Nasdaq 100: Torpedoed by Nvidia and May See Further Weakness
- Major US bench stock indices (S&P 500, Nasdaq 100, Dow Jones Industrial Average & Russell 2000) started the month of September on a weak footing.
- The Nasdaq 100 was the worst performer (-3.15%) on Tuesday, 3 September dragged down by the higher-beta technology sector (Nvidia & other semiconductor stocks)
- Recent weak performance of Nvidia (ex-post Q2 earnings) may trigger a negative liquidity cascading effect, in turn, a potential jump in the VIX.
- Watch the 19,670 key medium-term pivotal resistance on the Nasdaq 100.
Since our last publication, the price actions of the Nasdaq 100 have staged a bounce of 4.9% to hit the 19,900 handle on 22 August. However, it could not maintain its short-term bullish momentum, stage a reversal, and give up all its prior gains ex-post Q2 Nvidia’s earnings results on 29 August.
Thereafter, the Nasdaq 100 rebounded by 2.8% from its Thursday, 29 August low but failed to have a clearance above its 50-day moving average that acted as an intermediate resistance at around 19,670.
Labour Day “massacre” reinforced by weak ISM Manufacturing PMI
All the major US stock indices started the month of September on a weak footing after the Labour Day holiday. The Nasdaq 10 was the worst performer among the benchmark stock indices, shedding -3.15% on Tuesday, 3 September, dragged down by a horrendous loss of 9.5% inflicted on Nvidia, the third largest market cap component stock in Nasdaq 100
Yesterday’s cascading negative feedback loop in the US stock indices has been reinforced by a weak print of 47.2 in the ISM Manufacturing PMI data that slightly missed expectations of 47.5 where manufacturing activities in the US contracted for the fifth consecutive month.
Hence, the hard-landing playbook narrative is back at the forefront as the market participants are “fearful” that the US Federal Reserve has been late in enacting the interest rate cut cycle in the US, in turn, the higher beta (mega-cap technology and semiconductor stocks) were the worst performers as these groups of stocks have been leading in the US stock market since the start of 2024.
Nvidia is like an “elevator”
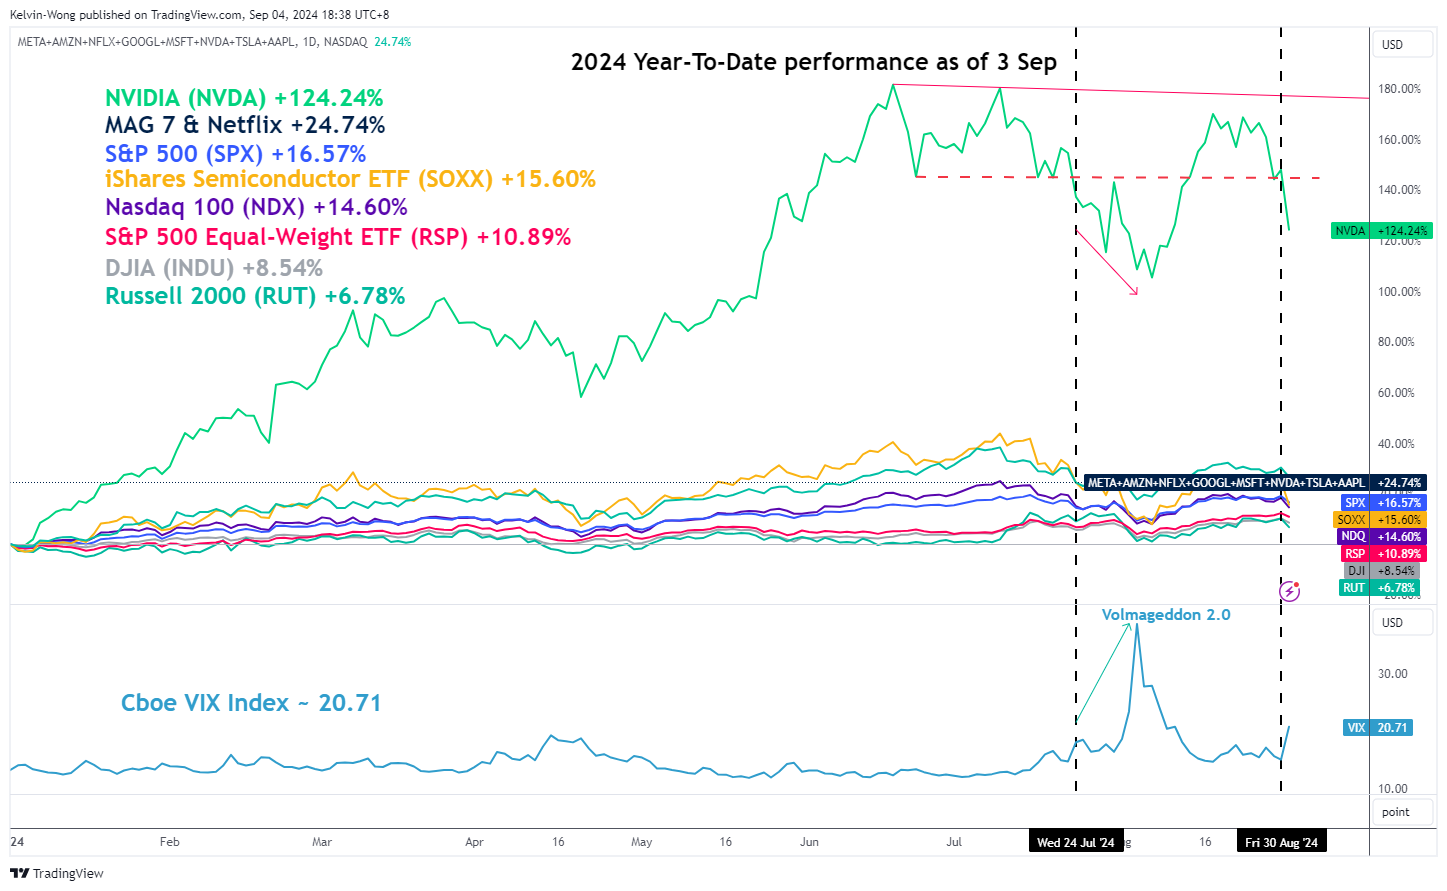
Fig 1: 2024 YTD performance of Nivida & major US stock indices with VIX as of 3 Sep 2024 (Source: TradingView, click to enlarge chart)
The share price of Nvidia has staged a magnificent rally from late April to June this year and it hit a current year-to-date peak market capitalization of US$3.33 trillion on 18 June, overtook Microsoft and Apple, and became the world’s most valuable company at that juncture.
This remarkable feat by Nvidia has created a positive liquidity-cascading impact on the S&P 500 and Nasdaq 100 as active equities-based fund managers (inclusive of smart beta factors and tactical exchange-traded funds) are likely to allocate a significant portion of their funds to Nvidia.
This type of positive liquidity-cascading effect also dampened the implied volatility of the US stock market as measured by the VIX which hovered at low levels of around 12 to 14 from late April to early July. Therefore, these low levels of VIX induced more risk-taking behaviour (skewed towards equities in this context) (see Fig 1).
Interestingly, the prior decline in the share price of Nvidia (before its Q2 earnings results release) from 10 July to 24 July led to a minor jump in the VIX from 12.84 to 18.02 that preceded Volmageddon 2.0 on 5 November, triggered a synchronised risk-off behaviour in the major US stock indices which in turn induces a negative liquidity-cascading effect, amplified by systematic funds that use implied volatility as a control risk measure that required to trim risk assets significantly such as equities in their portfolios.
A cautionary note is that the recent decline of Nvidia (ex-post earnings) from 29 August to 3 September has similar negative liquidity-cascading effect traits.
Nasdaq 100 at risk of revisiting 17,160/16,930
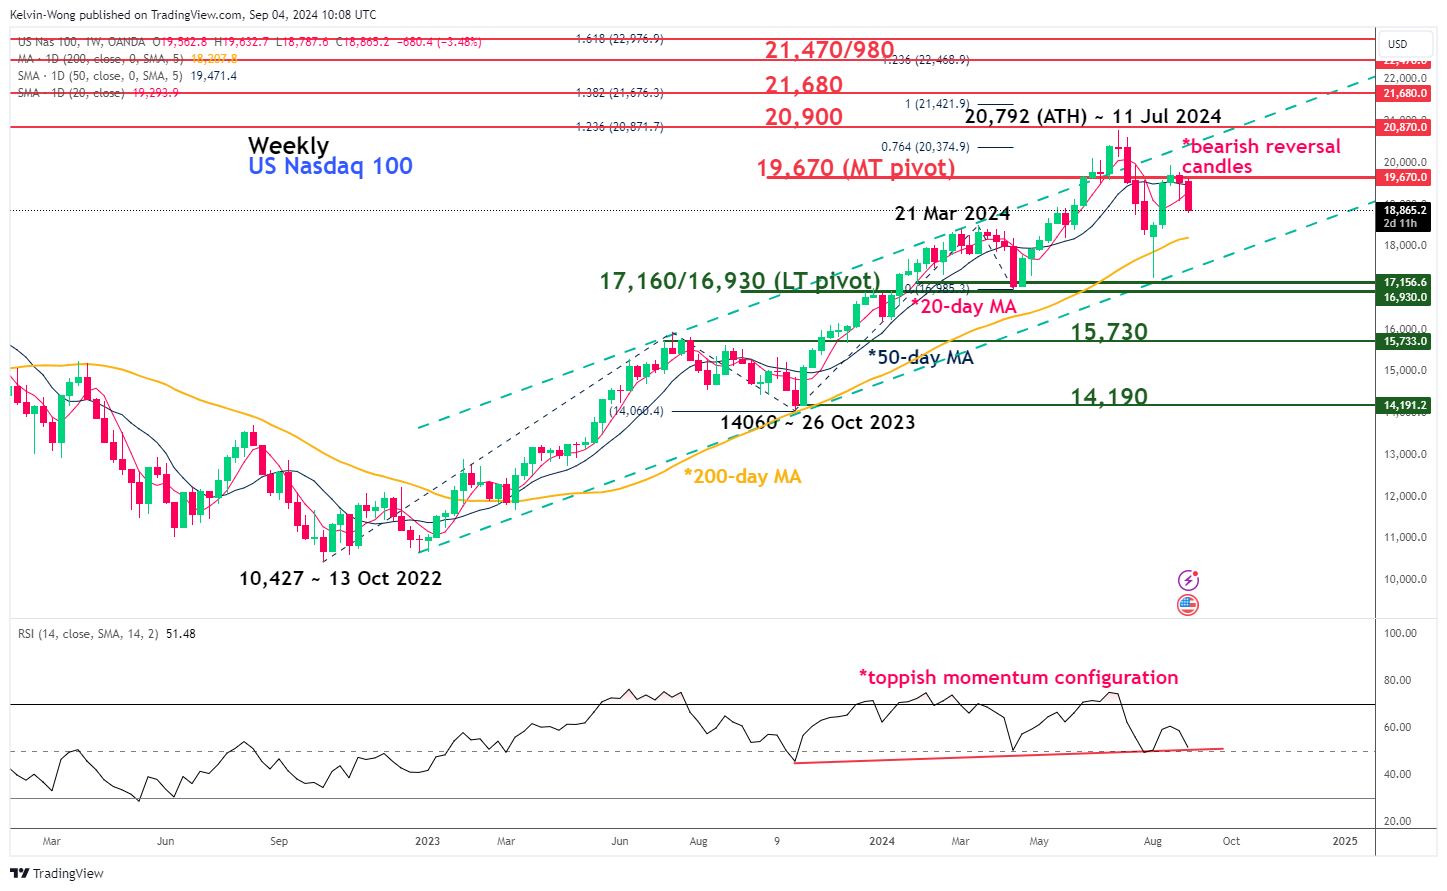
Fig 2: Nasdaq 100 CFD major & medium-term trends as of 4 Sep 2024 (Source: TradingView, click to enlarge chart)
In the lens of technical analysis, the current price actions seen in the Nasdaq 100 CFD (a proxy of Nasdaq 100 E-mini futures) have shaped a series of weekly bearish reversal candlesticks in the past two weeks after a test on the 19,670 key medium-term pivotal resistance (also close to the 50-day moving average).
For the week of 19 August and 26 August, it has formed a “Shooting Star” and Hanging Man” bearish reversal candlestick respectively, and the current date-to-week price action at this time of the writing has triggered a negative follow-through bearish Marubozu candlestick as it pierced below its 20-day moving average (see Fig 2).
These observations suggest a rapid change in sentiment from bullish to bearish that may unleash further weakness on the Nasdaq 100 CFD towards the 17,160/16,930 long-term pivotal support (close to the 5 August swing low).
Only a clearance above 19,670 invalidates the bearish bias for a continuation of its impulsive upmove sequence for the next major resistances to come in at 20,900 and 21,680 in the first step.
US Equities Dip Again: When to Buy?
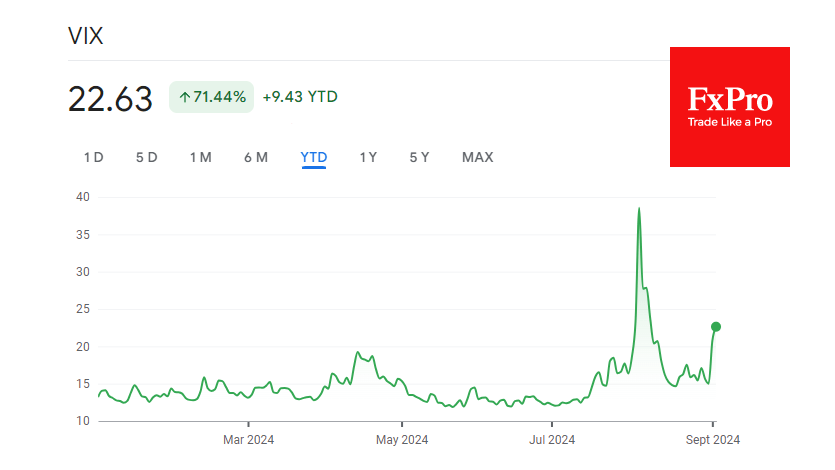
US equity markets have been hit by a sell-off, with the Nasdaq100 down more than 3% and the S&P500 down more than 2%, the biggest drop in almost a month. Nvidia’s share price fell more than 10% as the antitrust investigation intensified.
The VIX index spiked 45% to 22.6, as it did in early August. In our observations, consolidation of the “fear index” above 20 points is associated with correction periods. On the other hand, the volatility spike in early August was a brief shock, and markets quickly recovered from the technical correction.
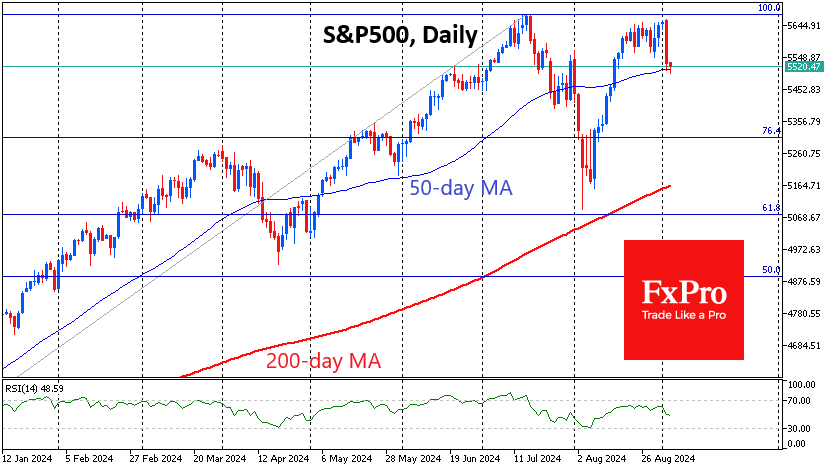
For the second time in the last two months, the S&P500 index was hit by sellers immediately after rising above 5660, turning this level into a resistance line. After pulling back to 5520, the index is now testing its 50-day moving average. At the end of July, a pullback to this line marked a pause in the sell-off before macroeconomic data shifted to the sell side.
Similarly, the S&P500 may now find itself in a tight range as it awaits Friday’s US employment data for directional cues.
Technical targets for further declines in the S&P500 appear to be the 5150 area, where the 200-day moving average and support from the early August collapse are centred. A break below 5070 (61.8% of growth from October 2023 to July 2024) would be a global correction with the potential for a pullback to 4400.
Should the index return to all-time highs above 5660 in the coming days, it could be a prologue to another run to all-time highs as markets have already cleared much of the overbought conditions.
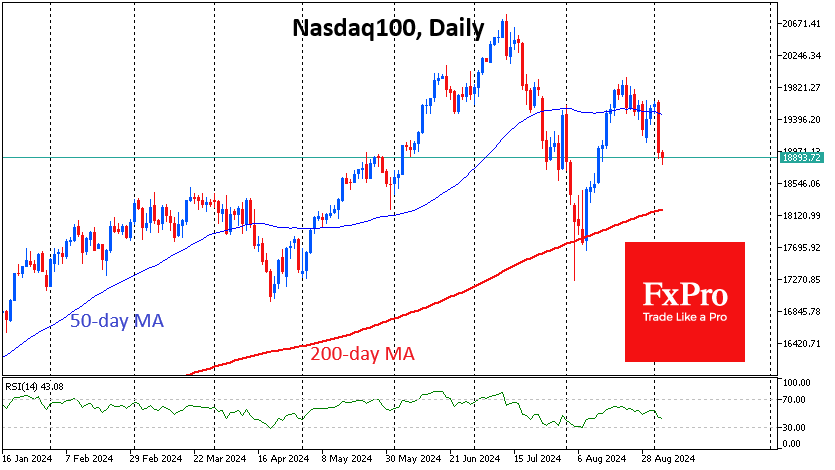
The Nasdaq100 is under even more pressure, having consolidated at 18900, well below its 50-day average (at 19500) and its third lower local high since the July highs. Technically, it now has an open road to 18200 (200-day average and local March-April resistance). A break below opens the way to 14500-15000.
However, as in August, a touch of the 200-day could well attract retail buyers. According to data going back to 1952, stocks account for a record 42% of Americans’ wealth. That’s largely due to the democratisation of access to stocks and funds and record-high stock prices. Historically low unemployment and impressive wage growth fuel new purchases, while correction sparks appetite.
Crypto Cap Sinks Below $2 Trillion
Market picture
Pressure on the crypto market returned on Tuesday and intensified on Wednesday morning, with capitalisation falling 4.8% to $1.98 trillion. This is below the psychological support line that attracted buyers for most of August and is the lowest level since August 8th. The nature of the decline early in the day suggests another wave of stop orders during a period of reduced liquidity, so it is too early to say that the $2 trillion support has been breached.
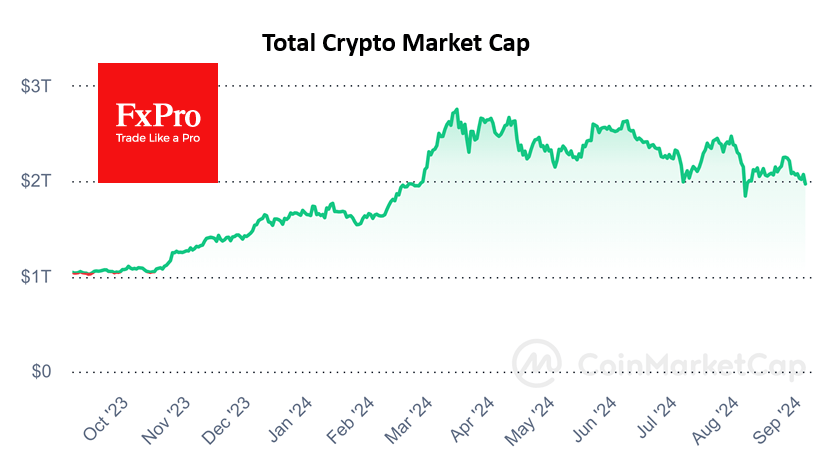
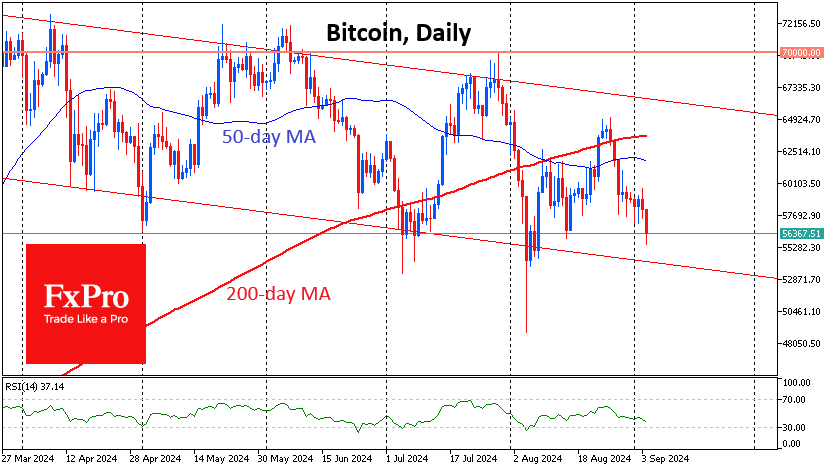
On Tuesday, bitcoin sellers took the initiative first on the approach to $60K and then at $59K, supported by the growing sell-off in traditional markets. Bitcoin fell to $55.5K at the peak of the decline before stabilising at $56.4K. Current levels acted as support during the May and July declines, but the trend of lower local lows sets up a reversal at $54K at the earliest.
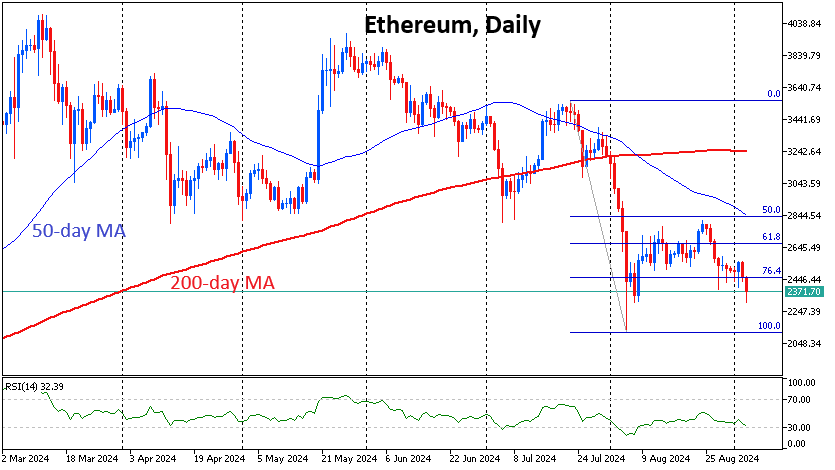
Like other altcoins, Ethereum’s local high was on August 24th, two days before Bitcoin reversed and interrupted a corrective rebound. Technically, a retest of the August 5th lows around $2100 is now more likely.
News background
Former BitMEX CEO Arthur Hayes attributes Bitcoin’s fall to a lack of liquidity. He estimates that this situation will continue as long as the US Treasury’s four-week T-bill rate is lower than the Reverse Repo Rate (RRP). Currently, the spread is minus 0.92%.
QCP Capital, citing seasonality, says it makes strategic sense to accumulate bitcoin in September and then take profits in October or near the end of the year. September has historically been negative for all asset classes, including BTC. October has been the opposite—in eight of the last nine years, the top cryptocurrency has gained an average of 22.9%.
The developers of BNB Smart Chain (BSC) reported on the growth of the ecosystem on the fourth anniversary of the launch of the core network. The number of daily active users of BSC reached 1.2 million and of opBNB 2.7 million.
The decentralised forecasting platform Polymarket has been integrated into the Bloomberg Terminal, according to its founder Shane Coplan.