
Sample Category Title
USD/CAD Daily Outlook
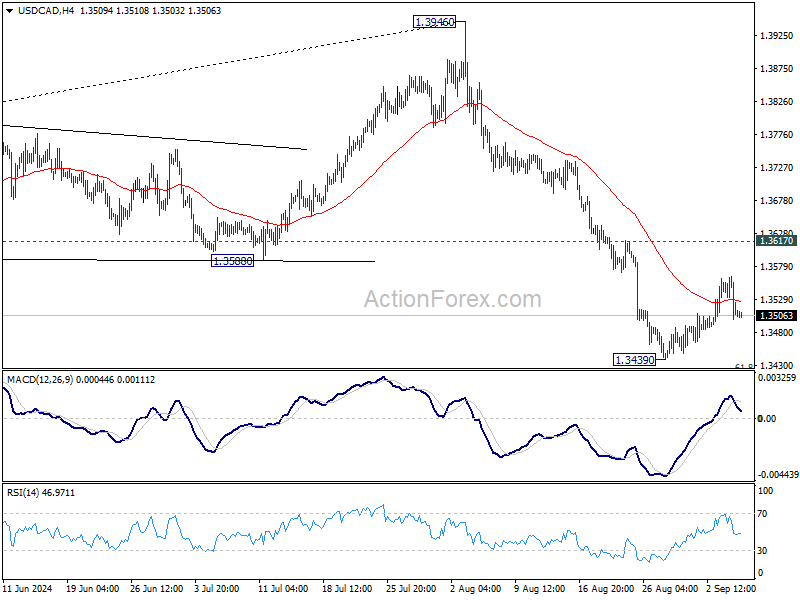
Daily Pivots: (S1) 1.3481; (P) 1.3523; (R1) 1.3546; More...
Intraday bias in USD/CAD remains neutral as consolidation continues above 1.3439. Further decline is expected with 1.3617 resistance intact. On the downside, break of 1.3439 and sustained trading below 61.8% retracement of 1.3091 to 1.3946 at 1.3418 will pave the way to 1.3091/3176 support zone next. However, firm break of 1.3617 will confirm short term bottoming and turn bias back to the upside for stronger rebound.
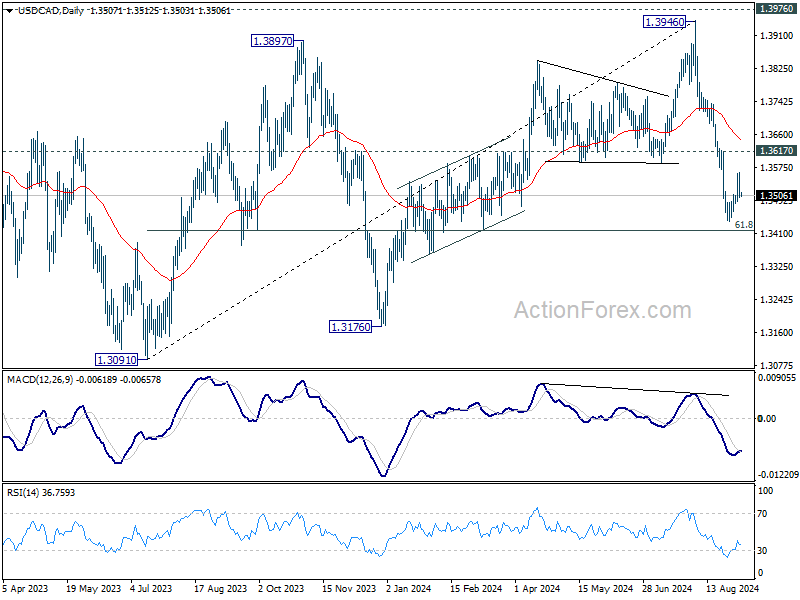
In the bigger picture, current development suggests that corrective pattern from 1.3976 (2022 high) is extending with another falling leg. While deeper decline could be seen, strong support should emerge above 1.2947 resistance turned support to bring rebound. Rise from 1.2005 (2021 low) is still in favor to resume at a later stage.
AUD/USD Daily Report
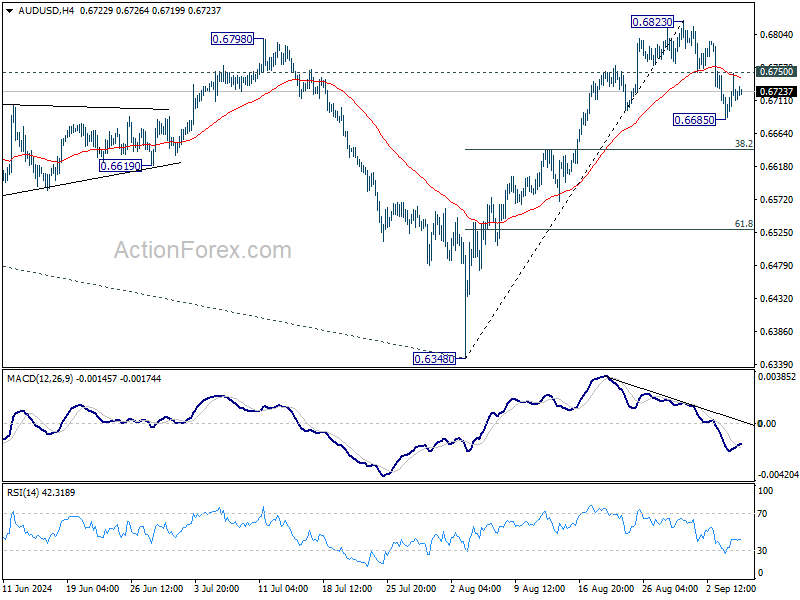
Daily Pivots: (S1) 0.6692; (P) 0.6720; (R1) 0.6755; More...
Intraday bias in AUD/USD is turned neutral first with current recovery. On the downside, below 0.6685 will extend the decline from 0.6823 short term top to 38.2% retracement of 0.6348 to 0.6823 at 0.6642. Break will target 61.8% retracement at 0.6529. On the upside, though, above 0.6750 support turned resistance will bring retest of 0.6823 instead.
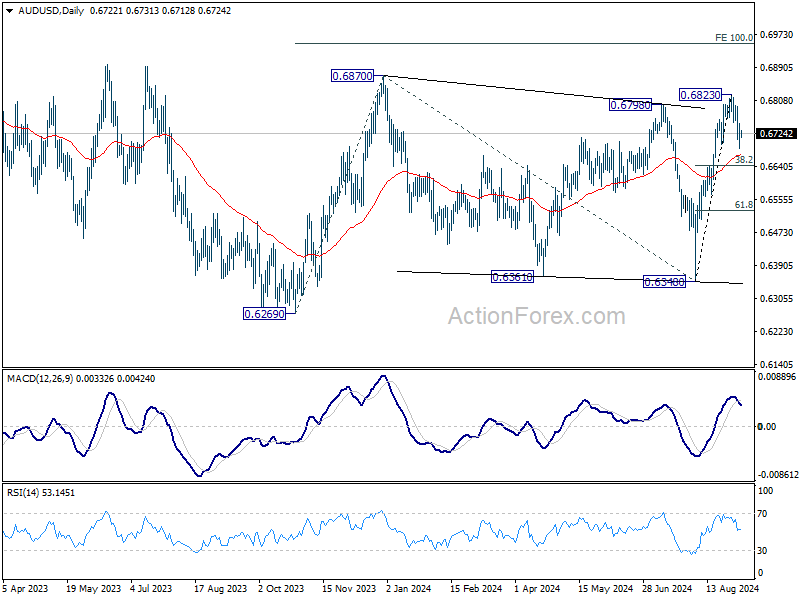
In the bigger picture, overall, price actions from 0.6169 (2022 low) are seen as a medium term corrective pattern, with rise from 0.6269 as the third leg. Firm break of 0.6798/6870 resistance zone will target 0.7156 resistance. In case of another fall, strong support should be seen from 0.6169/6361 to bring rebound.
USD/JPY Daily Outlook
Daily Pivots: (S1) 143.09; (P) 144.35; (R1) 145.00; More...
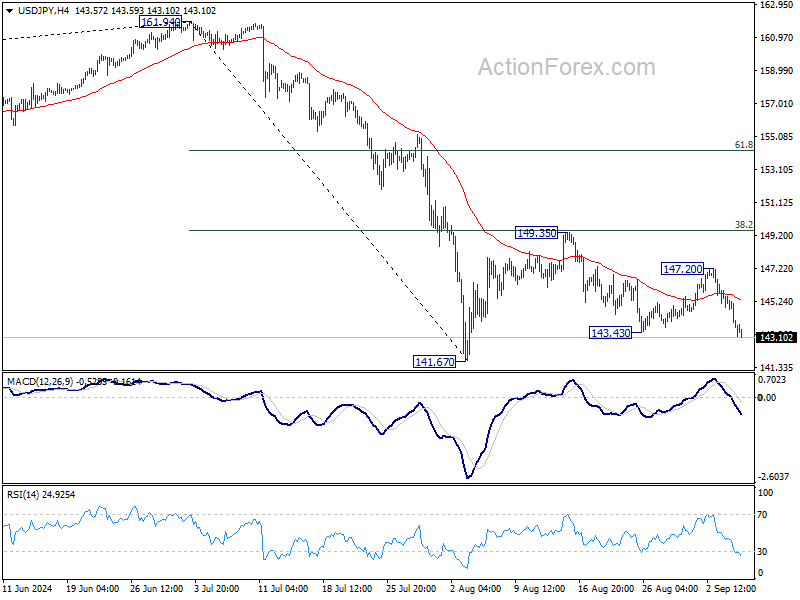
USD/JPY's fall from 149.35 resumed by breaking through 143.43 support and intraday bias is back on the downside for retesting 141.67 low. Firm break there will resume whole decline from 161.95 high, for 140.25 support next. For now, risk will stay on the downside as long as 147.20 resistance holds, in case of recovery.
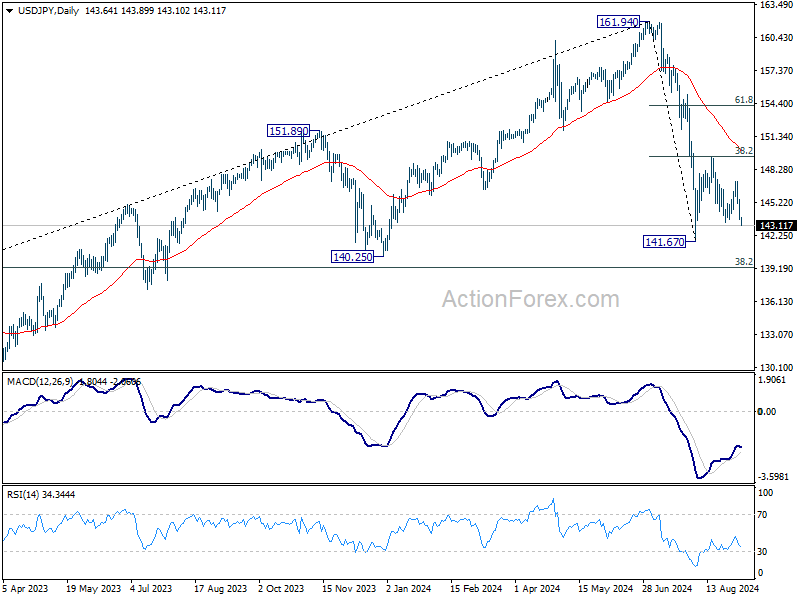
In the bigger picture, fall from 161.94 medium term top is seen as correcting whole up trend from 102.58 (2021 low). Deeper decline could be seen to 38.2% retracement of 102.58 to 161.94 at 139.26, which is close to 140.25 support. In any case, risk will stay on the downside as long as 55 W EMA (now at 149.24) holds. Nevertheless, firm break of 55 W EMA will suggest that the range for medium term corrective pattern is already set.
USD/CHF Daily Outlook
Daily Pivots: (S1) 0.8446; (P) 0.8482; (R1) 0.8502; More…
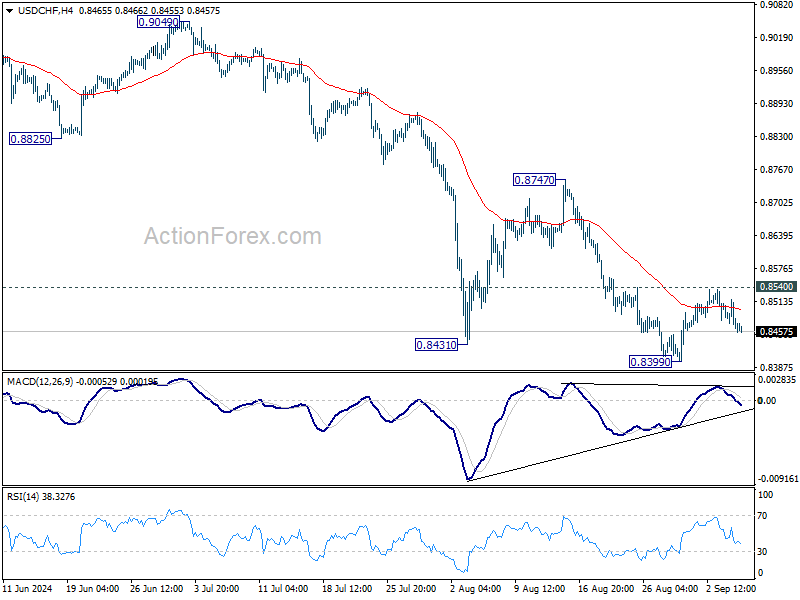
Intraday bias in USD/CHF stays neutral and outlook is unchanged. With 0.8540 resistance intact, further decline is expected. On the downside, break of 0.8339 will resume the fall from 0.9223 and target 0.8332 low. However, considering bullish convergence condition in 4H MACD, firm break of 0.8540 will confirm short term bottoming, and turn bias back to the upside for 0.8747 resistance instead.
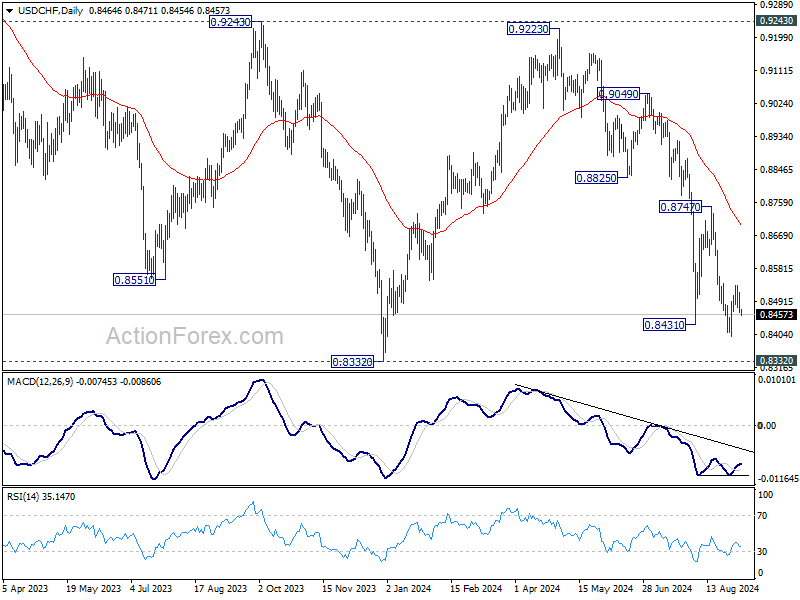
In the bigger picture, price actions from 0.8332 (2023 low) are currently seen as a medium term corrective pattern, with fall from 0.9223 as the second leg. Strong support could be seen from 0.8332 to bring rebound. Yet, overall outlook will continue to stay bearish as long as 0.9243 resistance holds. Firm break of 0.8332, however, will resume larger down trend from 1.0146 (2022 high).
GBP/USD Daily Outlook
Daily Pivots: (S1) 1.3108; (P) 1.3141; (R1) 1.3183; More...
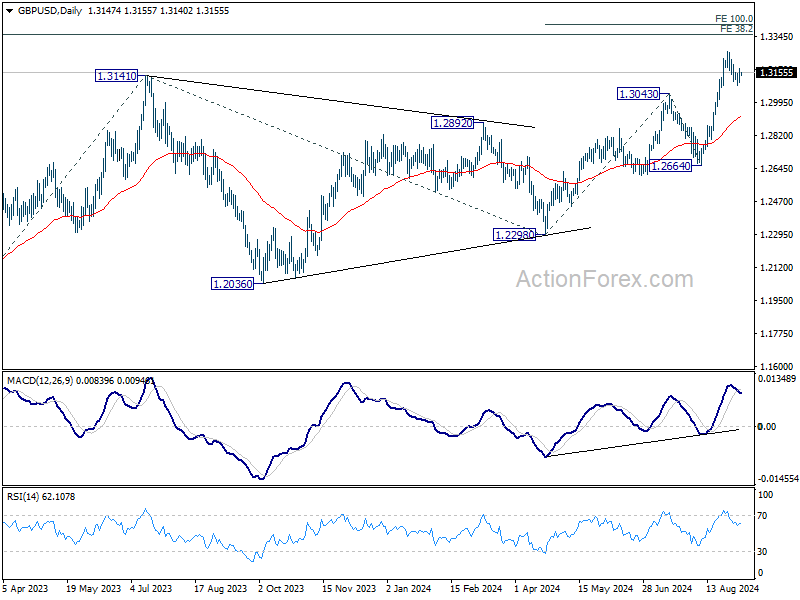
GBP/USD is still bounded in consolidation from 1.3265 and intraday bias remains neutral at this point. While deeper retreat cannot be ruled out, downside should be contained above 1.3043 resistance turned support to bring rebound. On the upside, above 1.3265 will resume larger up trend to 100% projection of 1.2298 to 1.3043 from 1.2664 at 1.3409. However, firm break of 1.3043 will indicate short term topping and turn bias back to the downside for deeper pullback.
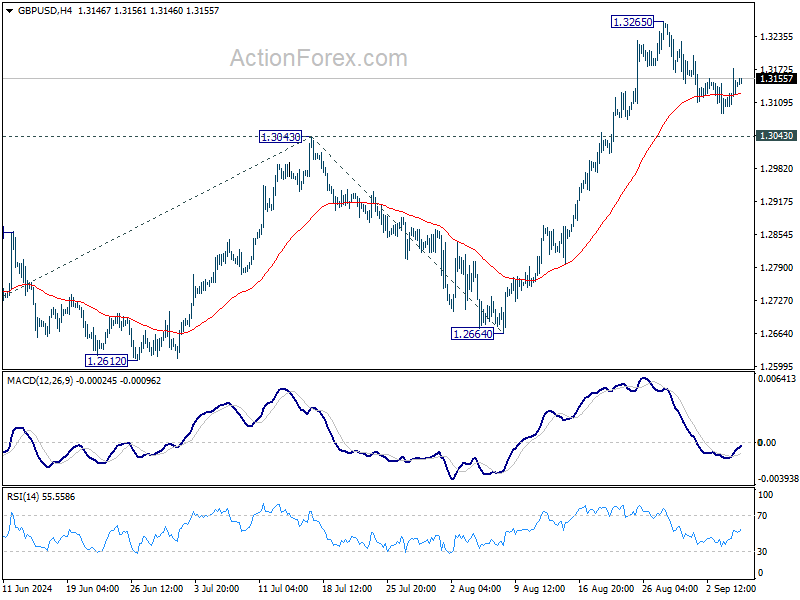
In the bigger picture, up trend from 1.0351 (2022 low) is resuming. Next target is 38.2% projection of 1.0351 to 1.3141 from 1.2298 at 1.3364. For now, outlook will stay bullish as long as 1.2664 support holds, even in case of deep pullback.
Strange Familiarity
US equities remained under pressure yesterday after the JOLTS report revealed that the US job openings unexpectedly fell further in July to the lowest level since 2021. The factory orders on the other hand jumped 5%, more than expected, during the same month – a welcome addition to the jolts figure that could partly tame the rising recession worries for the US. But the latter couldn’t prevent the US 2-year yield from falling by a big chunk to 3.75%, a level that was last seen during the summer meltdown, the 10-year yield fell to the same level as well, closing its more than two year persistent gap with the 2-year yield, the US dollar fell sharply and... the USDJPY dropped to the lowest levels since the beginning of August, as well, as the Bank of Japan (BoJ) Governor Ueda added more fuel to fire saying that the bank will continue to raise the borrowing costs if needed. And today’s stronger-than-expected wage income data supported the hawkish view.
So you understood, we are living a situation of deja vu: rising dovish Federal Reserve (Fed) expectations combined with rising hawkish BoJ bets result in a movement of capital out of the risk of equities, and a flight into the safety of the Japanese yen. But this time around, the price action is not triggered by the actual data, but by the fear of seeing a second month of disappointment in the US jobs data – that will undoubtedly boost the expectation of more than one jumbo rate cuts from the Fed between September and the year end (as the market is already pricing in a full percentage point cut before the end of the year and we haven’t seen the data yet). The latter would further weigh on US yields, potentially on the US dollar – if the greenback fails to attract safe haven flows, and probably on equities as well, regardless of their exposure to technology. For now though, the equity traders remain calm. The S&P500 retreated just 0.16% yesterday and is sitting on its 50-DMA, Nasdaq 100 lost a bit more than that, 0.20%, and slipped below its 100-DMA, Nvidia fell another 1.66% even after saying that they have not received a subpoena from the DoJ as reported by Bloomberg the day before. But the Dow Jones index managed to eke out a small gain as the falling yields and the rebound in factory orders kept some big names in the index afloat.
Today, eyes are on the ADP report. A consensus of analyst estimates on Bloomberg predict that the US economy may have added 144K private jobs last month, a certain rebound from the 122K printed a month earlier. A data in line with expectations, or ideally stronger-than-expected, could pour some cold water on the recession worries and keep indices stable into Friday’s official jobs figures. A softer-than-expected figure on the other hand will likely fuel the recession worries and could further weigh on US treasury yields, the dollar and stock indices.
Also on the watchlist, ISM services, weekly crude inventories and Broadcom earnings. I have said in yesterday’s episode that Broadcom is also expected to reveal strong Q2 results after the bell. Their results are expected to be boosted by growing AI demand, a rebound in networking equipment services, and VMware’s transition from perpetual sales to subscription model – which is also thought to have contributed to the revenue increase. All this is good, but even good results from Broadcom are not a guarantee of a rebound in the company’s stock price, as the investor focus has moved from corporate earnings – which remain robust for the tech companies by the way – to the economic data, where the macroeconomic setup is not ideal for the technology companies. Voila.
OPEC blinks
Oil bears didn’t wait Friday’s data to send the barrel of US crude below the $70pb level. The rising fear of US slowdown, on top of the Chinese worries, accelerated the early week selloff. As a response to the recent meltdown in oil prices, and the potential of a deeper dive in case of worsening data, OPEC+ delegates said yesterday that they are considering a possible delay to their plan to increase supply by 180’000 from October. Surprise, surprise.
But even if OPEC+ plays it safe, their decision to extend the production cuts to the year end may not suffice to cheer up the oil bulls – increasingly worried about waning demand prospects on deteriorating global macro setup. Pricewise, this means that better-than-expected jobs figures from the US could bring dipbuyers in, carry and keep the barrel of US crude above the $70pb but another disappointment will likely accelerate the selloff and build a resistance near this level, no matter what OPEC+ decides to do.
In the FX
The US dollar’s sharp fall yesterday gave strength to currencies around the world. The USDCAD fell despite a 25bp cut from the Bank of Canada (BoC), the EURUSD traded a few pips below the 1.11 level despite a set of softer-than-expected PMI figures from the Eurozone. Cable rebounded from the 1.31 support, but there, the stronger-than-expected PMI figures reinforced the improved growth prospects for the UK economy. The outlook for the EURGBP remains bearish, not only because the UK economy has been performing better than its European peers, but also because the dark clouds over the UK are finally dissipating. Earlier this week, a bond sale in the UK attracted record demand thanks to higher gilt yields – a sign of restoring confidence in UK politics after the Conservatives were ousted from the leadership of the country. And on top of it all, the Bank of England (BoE) adopts a more moderate dovish stance than its western peers – which is also a reason why investors see a brighter future for sterling against both the US dollar and the euro.
Another Day with US Labour Market Data on the Menu
In focus today
The US ISM Services index is due for release for August in the afternoon. While the index has remained volatile over the past years, most leading services indicators have continued to signal solid growth ahead. ADP private sector employment growth is also due for release for August and could provide some hints on what to expect from tomorrow's Jobs Report.
Economic and market news
What happened overnight
In Japan, nominal wages rose 3.6% y/y in July compared to 4.5% in June, while real wages rose at a slower pace in July edging up 0.4% y/y compared to 1.1%, marking the second consecutive month of increases driven by pay hikes and summer bonuses. Wage growth is key for the Bank of Japan's (BoJ) decisions in H2, with BoJ Governor Ueda emphasizing that broad pay increases must accompany rising prices for inflation to sustainably reach the 2% target. BoJ board member Takata echoed this, stating the BoJ could raise rates further if inflation roughly meets forecasts and companies continue to boost spending and wages, adding that recent market turmoil would not derail the bank's long-term rate hike plan.
What happened yesterday
In the US, July's JOLTs labour market data was significantly weaker than anticipated. Job openings dropped 7.7m (cons: 8.1m), the lowest level since 2021, while the June figure was revised down by 274k. At the same time, involuntary layoffs climbed higher to 1.8m from 1.6m, nearing pre-pandemic levels. Hires where little changed at 5.5m, whereas total separations increased by 336k to 5.4m.
The ratio of job openings to unemployed is now 1.07, falling below typical 2019 levels for the first time since the pandemic began. This aligns with Fed Chair Powell's Jackson Hole remarks that labour market conditions are already weaker than before Covid. Similarly, Atlanta Fed President Bostic emphasized maintaining restrictive policy for too long could disrupt the labour market and cause unnecessary hardship. Historically, further declines in labour demand from this point have often also translated into more pronounced upticks in unemployment rate. Markets reacted promptly, now viewing the FOMC's September meeting as a 50/50 chance between a 25bp or 50bp rate cut - we expect 25bp. However, it must be noted that this was backward-looking data for July. The heavyweight is yet to come, with the August Jobs Report on Friday.
On the political front, Democratic presidential candidate Kamala Harris has proposed to increase the top capital gains tax rate to 28% compared to President Biden's earlier budget plan to raise it to 39.6%.
In Poland, as widely expected the Monetary Policy Council kept its key policy rate steady at 5.75%.
In Canada, the central bank delivered its third consecutive rate cute, reducing its policy rate by 25bp to 4.25% - as we and markets had priced in - amid continued disinflation and concerns regarding growth prospects and the rising slack in the labour market. Additionally, the written communication also opened for more cuts to come.
In commodities, four OPEC+ sources reported that the cartel is discussing postponing the planned October oil output raise amid the recent slump in oil prices. Weakened demand outlook and potential additional supply from OPEC+, including the resolution of the dispute disrupting Libyan exports, have raised concerns within the group, according to one source.
Equities: Global equities continued to trend lower yesterday, driven by classic risk-off dynamics. Frankly speaking, there was zero percent focus on inflation and 100% focus on demand and the labour market. The JOLT report offered both good and bad news, though the headline number fell far below expectations. Consequently, cyclicals, growth, momentum, and quality sectors underperformed, while defensive minimum volatility sectors performed very well, and the VIX trended higher. In the US yesterday, the Dow closed at +0.1%, the S&P 500 at -0.2%, Nasdaq at -0.3%, and the Russell 2000 at -0.2%. Asian markets are mostly higher this morning, with Japan bucking the trend. Both European and US futures are lower this morning.
FI: Global rates fell further through yesterday's session as markets continued to discount near-term policy easing across central banks. The US JOLTS report, which showed another significant decline in job openings, added further to expectations of Fed cutting 50bp in September, but much of the decline in long-end rates had already materialized prior to the JOLTS release. The 10Y Bund yield fell 6bp through the day to 2.22%, while EU peripheral sspreads saw renewed tightening. In the US, the 2Y and 10Y UST yields are now trading in line at 3.77%. Brent remained just below USD73/barrel despite rumours that OPEC+ could delay its planned output increases. This allowed long-term EUR inflation swap rates (e.g. 5y5y) to decline further.
FX: EUR/USD rose towards 1.11 due to the relatively large drop in JOLTS job openings. EUR/GBP ended the day close to unchanged after a small upward revision to the final August PMIs. The oil market only received some temporary support from the news that OPEC+ might delay planned output hike that was scheduled to take effect in October.
Elliott Wave View on Light Crude Oil (CL) Favoring More Downside
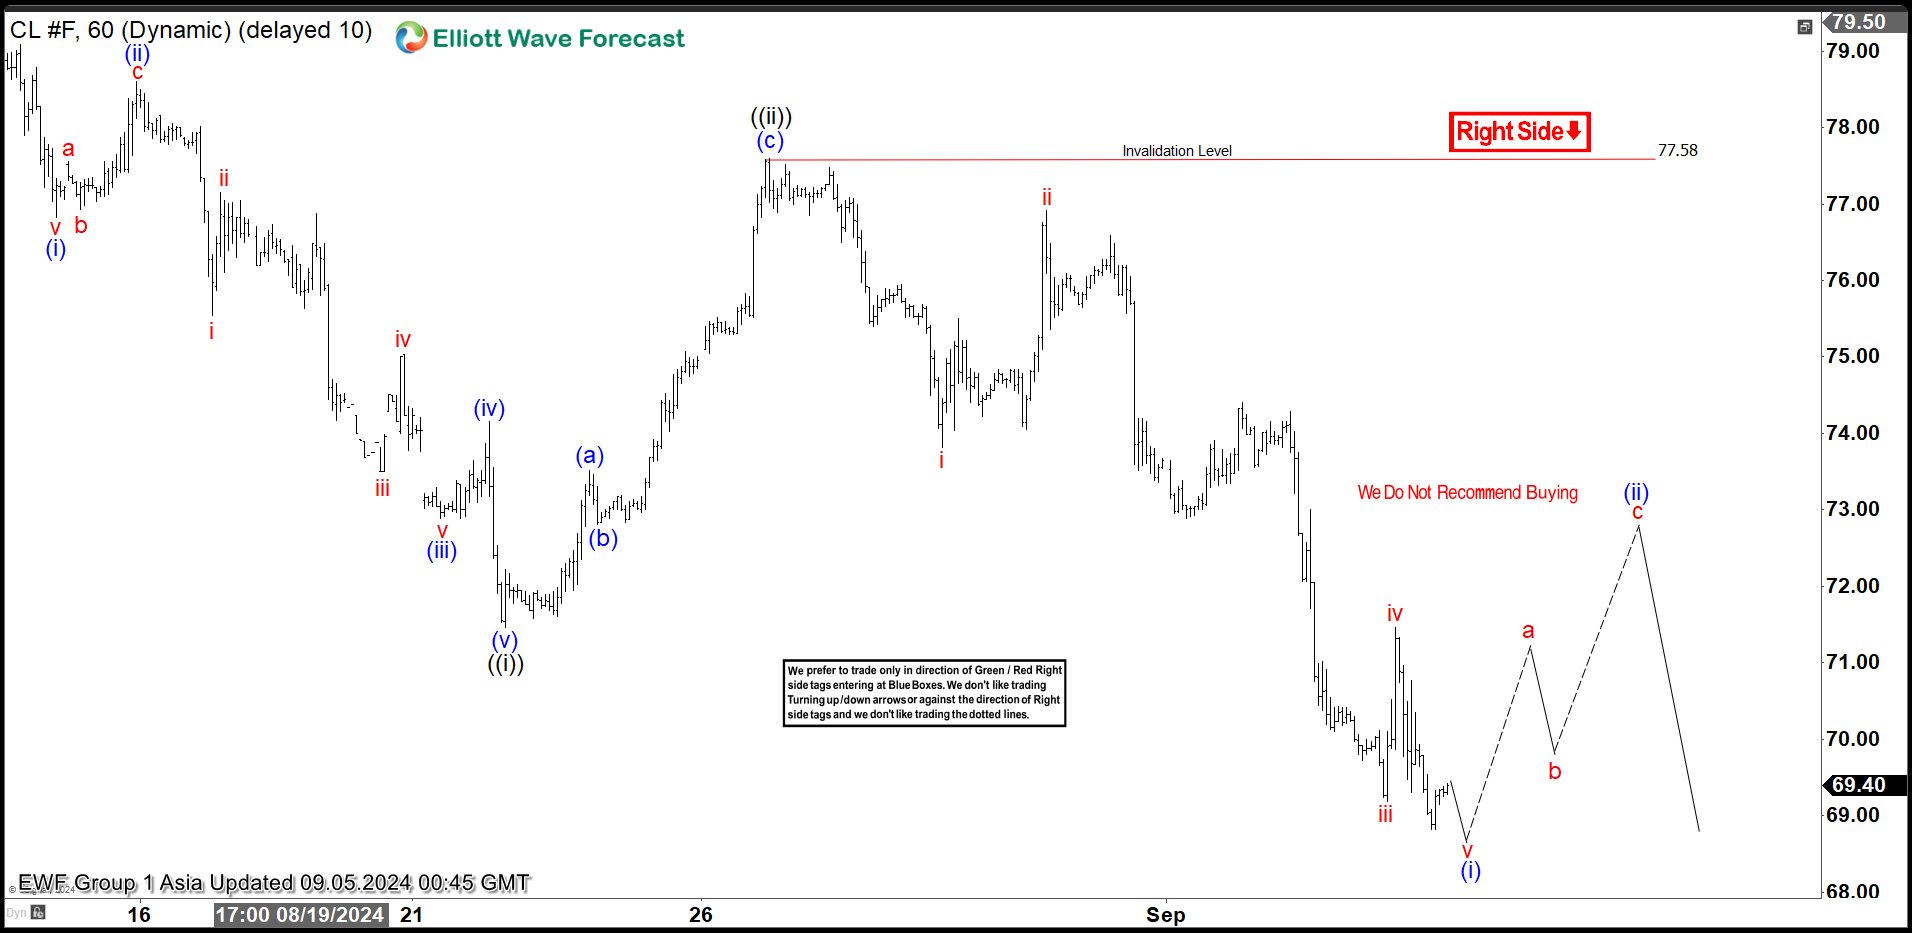
Short Term Elliott Wave in Oil (CL) suggests the decline from 8.13.2024 high is unfolding as a 5 waves impulse. Down from 8.13.2024 high, wave (i) ended at 76.83 and rally in wave (ii) ended at 78.6. The commodity extended lower in wave (iii) towards 72.89 and rally in wave (iv) ended at 74.16. Final leg wave (v) ended at 71.46 which completed wave ((i)) in higher degree. Oil then turned higher in wave ((ii)) with internal subdivision as a zigzag Elliott Wave structure. Up from wave ((i)), wave (a) ended at 73.52 and wave (b) ended at 72.81. Wave (c) higher ended at 77.58 which completed wave ((ii)) in higher degree.
Oil extended lower in wave ((iii)). Down from wave ((ii)), wave i ended at 73.82 and rally in wave ii ended at 76.91. It then extended lower in wave iii towards 69.19 and wave iv rally ended at 71.46. Expect Oil to end wave v soon which should complete wave (i) in higher degree. Afterwards, it should rally in wave (ii) to correct cycle from 8.26.2024 high before it resumes lower. Near term, as far as pivot at 77.58 high stays intact, expect rally to fail in 3, 7, 11 swing for further downside.
Light Crude Oil (CL) 60 Minutes Elliott Wave Chart
CL Elliott Wave Video
https://www.youtube.com/watch?v=HPfnELIjw0c
EUR/USD Daily Outlook
Daily Pivots: (S1) 1.1048; (P) 1.1071; (R1) 1.1107; More....
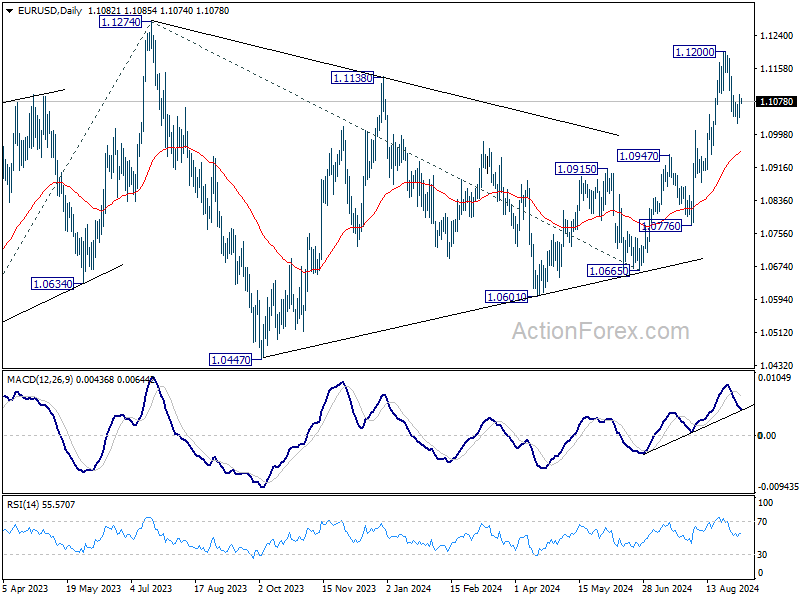
Outlook in EUR/USD remains unchanged and intraday bias stays neutral. While retreat from 1.1200 might extend lower, rally from 1.0665 is in favor to continue as long as 1.0947 resistance turned support holds. Above 1.1104 minor resistance will bring retest of 1.1200 first. Break there will target 1.1274 high next. However, firm break of 1.0947 will indicate reversal and turn bias back to the downside.
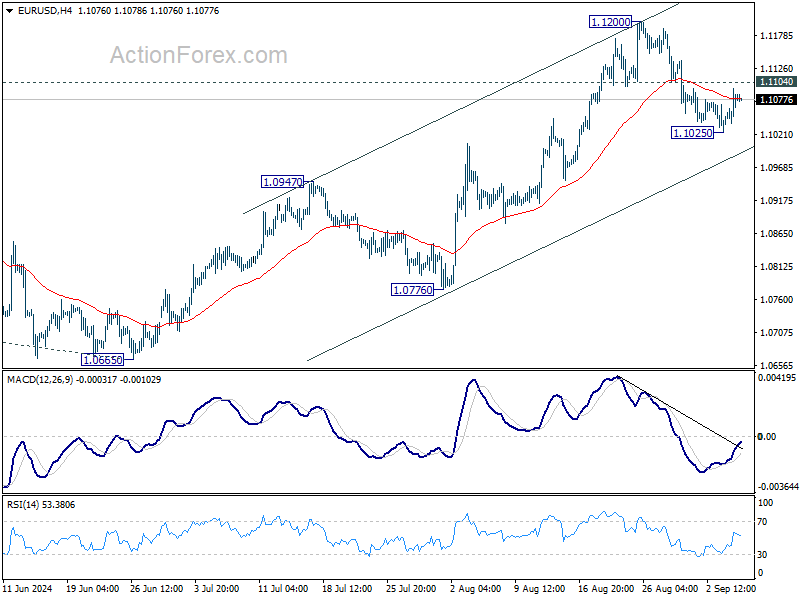
In the bigger picture, prior break of 1.1138 resistance indicates that corrective pattern from 1.1274 has completed at 1.0665 already. Decisive break of 1.1274 (2023 high) will confirm whole up trend from 0.9534 (2022 low). Next target will be 61.8% projection of 0.9534 to 1.1274 from 1.0665 at 1.1740. This will now be the favored case as long as 1.0947 resistance turned support holds.
Weak JOLTS Data Hits Dollar, But Stock Investors Hold Their Bets
Dollar weakened broadly overnight after the latest JOLTS report showed significant drop in job openings, hitting the lowest level since January 2021. Economists are increasingly worried that the US labor market is cooling not just to pre-pandemic levels but potentially beyond. Such outlook could raising the possibility that the Federal Reserve may need to act more decisively in its easing policy to prevent further labor market deterioration. With concerns mounting over labor market weakness, fed fund futures now reflect a 45% probability of a 50bps rate cut by Fed later this month, up from 38% a day earlier.
However, attention is shifting to the health of the services sector, which has been a key economic driver amid the ongoing manufacturing recession. Today's ISM services report will be a critical indicator, but the deciding factor for Fed will likely be tomorrow's non-farm payroll report.
In other markets, 10-year US Treasury yield dropped sharply following the JOLTS data today. Meanwhile, US stock markets were relatively stable, with major indexes closing with small gains or losses only.
In the currency markets, despite the overnight selloff, the Dollar remains in a middle position for the week. Japanese Yen leads as the strongest performer as pushed up from the fail in US yields, followed by Swiss Franc and Euro. On the other hand, New Zealand Dollar and Australian Dollar are the weakest performers, with Canadian Dollar also lagging. These rankings are typical in a general risk-off environment.
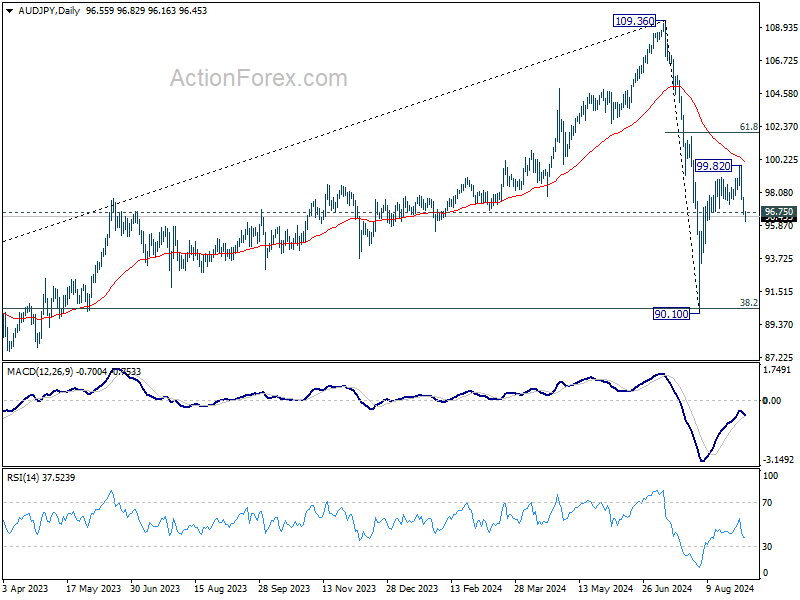
Technically, AUD/JPY's break of 96.75 support suggests that rebound from 90.10 has completed at 99.82, ahead of falling 55 D EMA. Risk will now stay on the downside as long as 99.82 resistance holds, even in case of recovery. Deeper fall is now in favor back to retest 90.10 low.
In Asia, at the time of writing Nikkei is down -1.24%. Hong Kong HSI is down -0.53%. China Shanghai SSE is up 0.03%. Singapore Strait Times is down -0.08%. Japan 10-year JGB yield is down -0.0105 at 0.879. Overnight, DOW rose 0.09%. S&P 500 fell -0.16%. NASDAQ fell -0.30%. 10-year yield fell -0.076 to 3.768.
Real wages rise for second month in Japan, boosted by summer bonuses
Japan's real wages rose by 0.4% yoy in July, down from June's 1.1% yoy, but still marking the second consecutive month of growth after 27 months of decline.
Nominal wages increased by 3.6% yoy, surpassing expectations of 3.1%, but slowing from June's 4.5% yoy. Regular pay, which rose 2.7% yoy, achieved its fastest growth in nearly 32 years. However, overtime pay, often seen as a gauge of corporate strength, dipped slightly by -0.1% yoy.
Special payments, such as bonuses, played a significant role in lifting wage growth during the summer, with a 6.2% yoy increase in July, following a 7.8% yoy rise in June.
A labor ministry official noted, “From August and thereafter, monthly wages will be a deciding factor” in sustaining real wage growth, as the contribution from special payments will diminish in the coming months.
BoJ board member Hajime Takata said in a speech today:
If inflation moves roughly in line with forecasts, and companies continue to boost spending, wages and pass on costs through price hikes, then "we need to adjust the degree of monetary easing further,"
While US and European central banks are moving toward rate cuts, the effect of their past aggressive monetary tightening could appear with a lag and weigh on Japan's economy, Takata said.
The difference in monetary policy stance between that of the BOJ and other central banks could also cause market turbulence, Takata said. "As such, we must carefully monitor domestic and overseas developments," he said.
The stock and currency market saw big volatility in early August and "the fallout continues". As such, we need to scrutinise market developments and their impact.
RBA's Bullock reiterates no rate cuts soon, stresses vigilance on inflation risks
In a speech today, RBA Governor Michele Bullock reaffirmed that the central bank is unlikely to cut interest rates in the near term, provided the economy evolves as anticipated.
Bullock emphasized that the Board remains "vigilant to upside risks to inflation" and that monetary policy will need to stay "sufficiently restrictive" until there is clear evidence that inflation is moving sustainably towards the target range.
Although inflation has fallen significantly from its peak, it remains above the midpoint of RBA's 2–3% target range, with underlying inflation, as measured by the trimmed mean, still at 3.9% in June.
RBA aims to bring inflation back to target without jeopardizing the labor market gains made in recent years, navigating what Bullock described as the "narrow path."
The central bank's August forecast anticipates underlying inflation returning to the target range by the end of 2025, a "slightly slower" timeline than previously projected. While the labor market remains relatively tight, Bullock noted that it is expected to "ease gradually" over the next few years as the economy adjusts.
Fed's Beige Book signals slowdown with widespread stagnation across districts
Fed's latest Beige Book report highlights a growing economic slowdown across the US. While economic activity grew slightly in three Districts, the number of Districts reporting flat or declining activity increased from five in the previous period to nine in the current period, indicating broader stagnation.
Employment levels were generally "flat to up slightly", with five Districts noting modest increases in headcounts. However, some Districts reported that firms are reducing shifts, leaving positions unfilled, or trimming headcounts through attrition, though layoffs remain uncommon. Wage growth continues at a modest pace, consistent with the recent trend of slowing wage increases.
Overall, prices increased modestly during the reporting period, but three Districts saw only slight rises in selling prices. Nonlabor input costs were mostly described as modest to moderate and generally easing, though one District reported a slight uptick in input cost increases.
Fed's Daly to assess upcoming data before finalizing rate cut size
In an interview with Reuters, San Francisco Fed President Mary Daly acknowledged that a rate cut is widely expected this month, but emphasized that the exact size of the cut remains uncertain.
"We don't know yet, right?" Daly said, noting that key data such as the upcoming labor market and CPI reports will play a critical role in the decision-making process. She added, "I want more time to do all the work that's needed to make the best decision."
Daly also warned of the risks of over-tightening, particularly as inflation eases while the economy slows. "As inflation falls, we've got a real rate of interest that's rising into a slowing economy; that's a basic recipe for over-tightening," she explained.
Highlighting the importance of protecting the labor market, she stressed that further slowing would be "unwelcome" and a key factor in shaping future policy decisions.
Looking ahead
Swiss unemployment rate, Germany factor orders, UK PMI construction and Eurozone retail sales will be released in European session. Later in the day, US ADP employment, jobless claims and ISM services will the focuses.
EUR/USD Daily Outlook
Daily Pivots: (S1) 1.1048; (P) 1.1071; (R1) 1.1107; More....
Outlook in EUR/USD remains unchanged and intraday bias stays neutral. While retreat from 1.1200 might extend lower, rally from 1.0665 is in favor to continue as long as 1.0947 resistance turned support holds. Above 1.1104 minor resistance will bring retest of 1.1200 first. Break there will target 1.1274 high next. However, firm break of 1.0947 will indicate reversal and turn bias back to the downside.
In the bigger picture, prior break of 1.1138 resistance indicates that corrective pattern from 1.1274 has completed at 1.0665 already. Decisive break of 1.1274 (2023 high) will confirm whole up trend from 0.9534 (2022 low). Next target will be 61.8% projection of 0.9534 to 1.1274 from 1.0665 at 1.1740. This will now be the favored case as long as 1.0947 resistance turned support holds.
Economic Indicators Update
| GMT | Ccy | Events | Actual | Forecast | Previous | Revised |
|---|---|---|---|---|---|---|
| 23:30 | JPY | Labor Cash Earnings Y/Y Jul | 3.60% | 3.10% | 4.50% | |
| 01:30 | AUD | Trade Balance (AUD) Jul | 6.01B | 4.95B | 5.59B | 5.43B |
| 05:45 | CHF | Unemployment Rate Aug | 2.50% | 2.50% | ||
| 06:00 | EUR | Germany Factory Orders M/M Jul | -1.50% | 3.90% | ||
| 08:30 | GBP | Construction PMI Aug | 54.4 | 55.3 | ||
| 09:00 | EUR | EurozoneRetail Sales M/M Jul | 0.10% | -0.30% | ||
| 11:30 | USD | Challenger Job Cuts Y/Y Aug | 9.20% | |||
| 12:15 | USD | ADP Employment Change Aug | 150K | 122K | ||
| 12:30 | USD | Initial Jobless Claims (Aug 30) | 233K | 231K | ||
| 12:30 | USD | Nonfarm Productivity Q2 | 2.30% | 2.30% | ||
| 12:30 | USD | Unit Labor Costs Q2 | 0.90% | 0.90% | ||
| 13:45 | USD | Services PMI Aug F | 55.2 | 55.2 | ||
| 14:00 | USD | ISM Services PMI Aug | 51.5 | 51.4 | ||
| 14:30 | USD | Natural Gas Storage | 26B | 35B | ||
| 15:00 | USD | Crude Oil Inventories | -0.6M | -0.8M |