Sample Category Title
EUR/USD Daily Outlook
Daily Pivots: (S1) 1.0886; (P) 1.0915; (R1) 1.0949; More.....
Intraday bias in EUR/USD remains neutral at this point. While deeper retreat cannot be ruled out, downside should be contained well above 1.0776 support. On the upside, above 1.0944 minor resistance will bring retest of 1.1007 first. Further break there will resume recent rally from 1.0665 to 100% projection of 1.0665 to 1.0947 from 1.0776 at 1.1056 next.
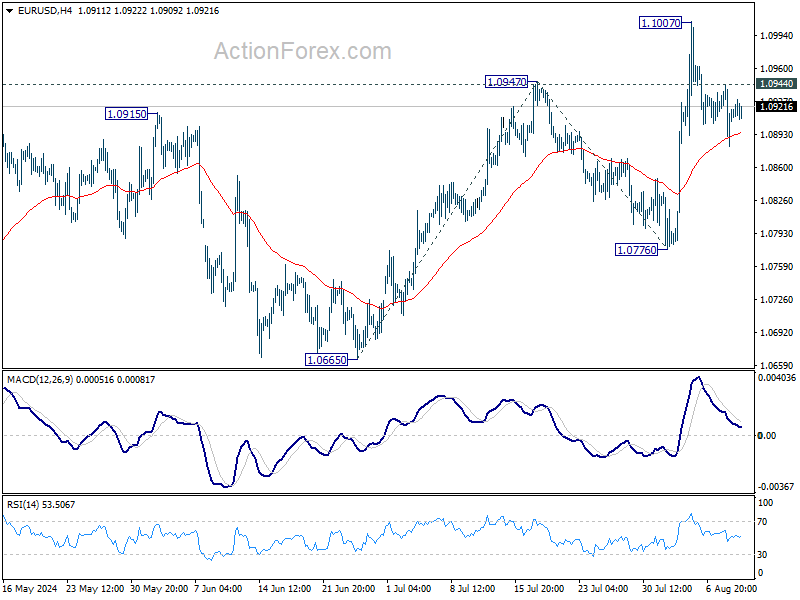
In the bigger picture, price actions from 1.1274 are viewed as a corrective pattern that's still be in progress. Break of 1.1138 resistance will be the first signal that rise from 0.9534 (2022 low) is ready to resume through 1.1274 (2023 high). However, break of 1.0776 support will extend the correction with another falling leg back towards 1.0447 support.

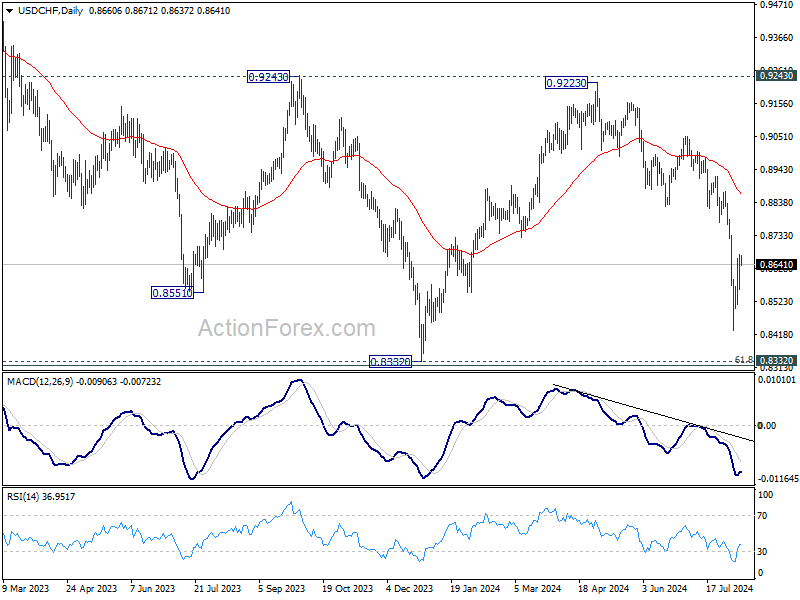
USD/CHF Daily Outlook
Daily Pivots: (S1) 0.8593; (P) 0.8634; (R1) 0.8707; More…
Intraday bias in USD/CHF remains neutral for the moment and further decline is still expected. On the downside, below 0.8559 minor support will bring retest of 0.8431 first. Break there will resume the fall from 0.9223 to retest 0.8332 low. However, sustained break of 0.8711 will turn bias back to the upside for stronger rebound.
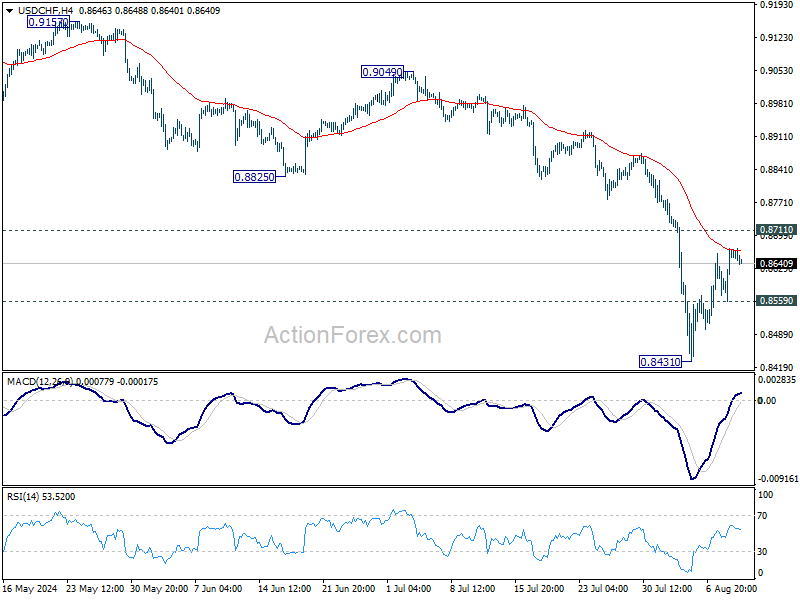
In the bigger picture, price actions from 0.8332 (2023 low) are currently seen as a medium term corrective pattern, with fall from 0.9223 as the second leg. Strong support could be seen from 0.8332 to bring rebound. Yet, overall outlook will continue to stay bearish as long as 0.9243 resistance holds. Firm break of 0.8332, however, will resume larger down trend from 1.0146 (2022 high).
USD/JPY Daily Outlook
Daily Pivots: (S1) 145.96; (P) 146.76; (R1) 148.07; More...
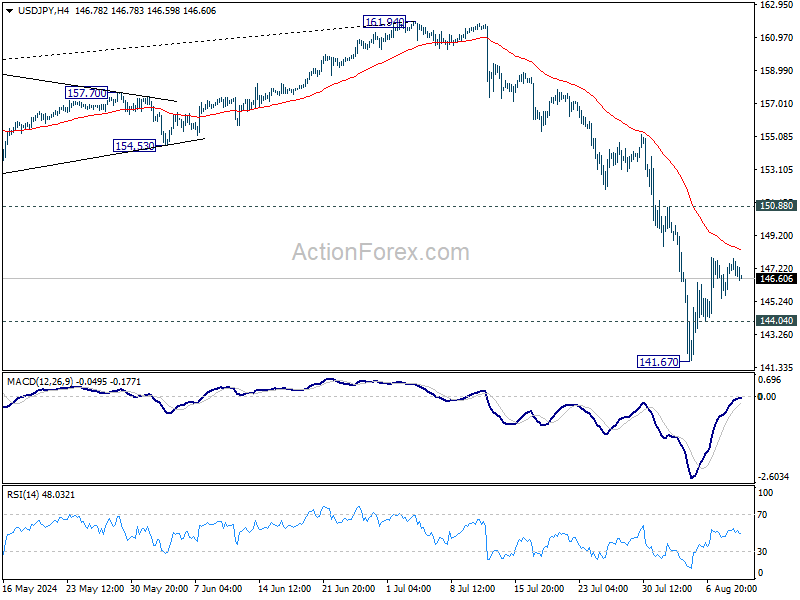
Intraday bias in USD/JPY stays neutral at this point. While further rise cannot be ruled out, outlook will stay bearish as long as 150.88 resistance holds. On the downside, below 144.04 minor support will bring retest of 141.67 first. Break there will resume the fall from 161.94 to 140.25 support next.
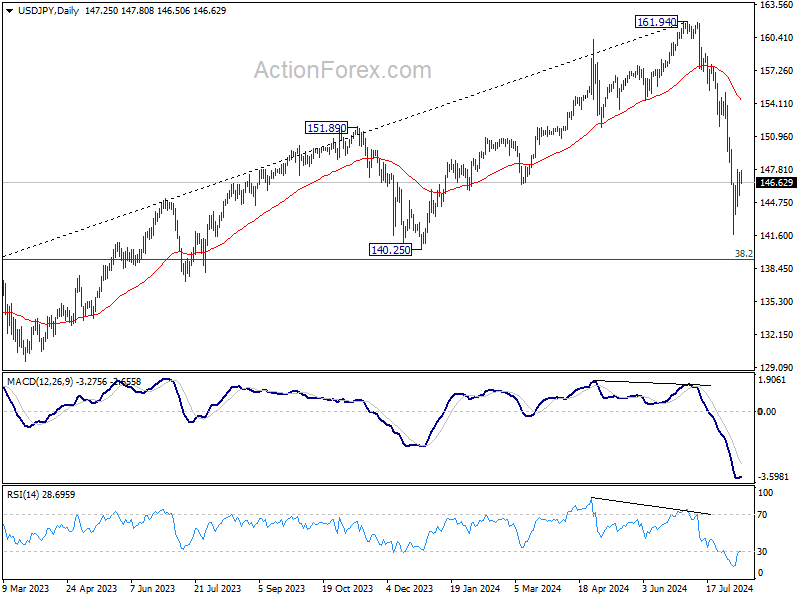
In the bigger picture, the strong break of 55 W EMA (now at 149.98) argue that fall from 161.94 medium term is correcting whole up trend from 102.58 (2021 low). Deeper decline could be seen to 38.2% retracement of 102.58 to 161.94 at 139.26, which is close to 140.25 support. In any case, risk will stay on the downside as long as 55 W EMA (now at 149.83) holds. Nevertheless, firm break of 55 W EMA will suggest that the range for medium term corrective pattern is already set.
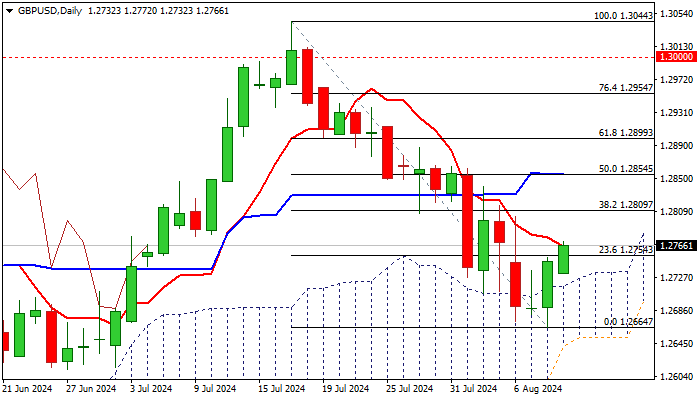
GBP/USD Mid-Day Outlook
Daily Pivots: (S1) 1.2693; (P) 1.2722; (R1) 1.2780; More...
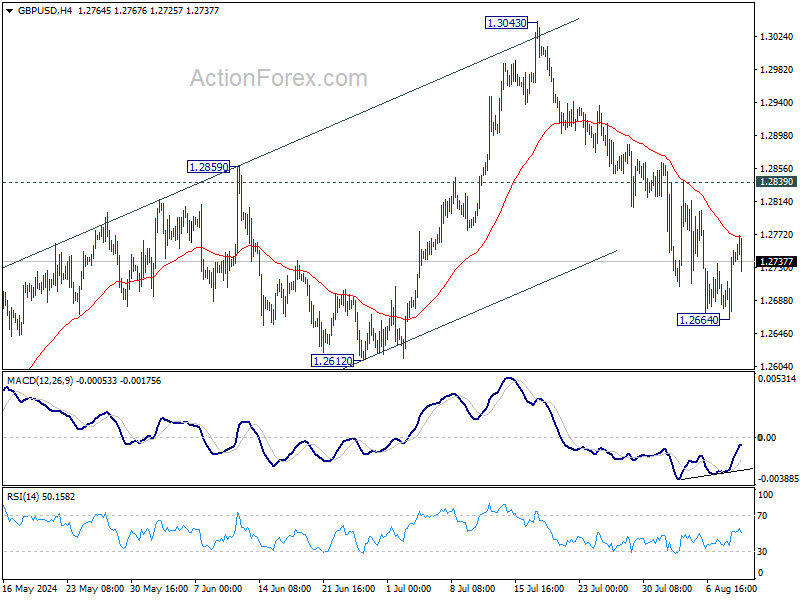
GBP/USD dips mildly after hitting 55 4H EMA but stays in range above 1.2664. Intraday bias remains neutral for the moment. Another fall is in favor as long as 1.2839 resistance holds. Below 1.2664 will target 1.2612 support. Decisive break there should confirm that rise from 1.2298 has completed, and target this support next. However, break of 1.2839 resistance will argue that the pull back from 1.3043 has completed and turn bias back to the upside.
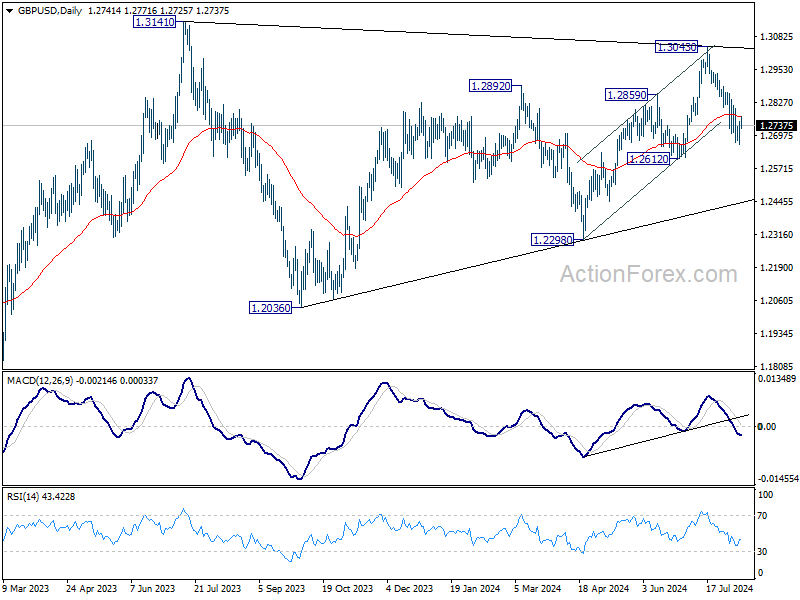
In the bigger picture, current development suggests that corrective pattern from 1.3141 is extending with fall from 1.3043 as another leg. Break of 1.2612 support would strengthen this case. But still, downside should be contained by 1.2036/2298 support zone even in case of deep decline. Rise from 1.0351 (2022 low) remains in favor to resume at a later stage.
Safe-Haven Currencies Edge Higher, But Momentum Weak
As we move into US session, safe-haven currencies like Yen, Swiss Franc, and Dollar are showing modest gains, driven by weaker stock futures and treasury yields. However, momentum behind these currencies remains unconvincing, with trading sluggish across the board. Most major pairs and crosses are confined within the ranges established yesterday, reflecting a cautious market tone ahead of the weekend. With no significant events scheduled for the rest of the day, traders appear to be holding off on making any major bets until next week.
Canadian Dollar softened slightly following weaker-than-expected job data, which showed a contraction in July. However, like other currencies, the movement has been minimal. Australian Dollar experienced a brief uptick earlier, bolstered partly by stronger-than-expected inflation data from China, but it has since lost momentum. Meanwhile, Euro and Sterling are experiencing a typical summer lull, with little movement.
In Europe, at the time of writing, FTSE is up 0.19%. DAX is down -0.15%. CAC is up 0.06%. UK 10-year yield is down -0.0422 at 3.939. Germany 10-year yield is down -0.0388 at 2.233. Earlier in Asia, Nikkei rose 0.56%. Hong Kong HSI rose 1.17%. China Shanghai SSE fell -0.27%. Singapore Strait Times rose 0.37%. Japan 10-year JGB yield rose 0.0251 to 0.858.
Fed's Collins: Gradual rate cuts expected as inflation moderates
Boston Fed President Susan Collins indicated in an interview with the Providence Journal that if current economic data trends continue as expected, it may soon be appropriate to start adjusting monetary policy by "easing how restrictive the policy is".
She emphasized her expectation for "continued gradual reduction" in inflation toward the 2% target, all while maintaining a healthy labor market.
Collins also noted that she anticipates interest rates to be lower in the coming years, although she refrained from providing specific details on the timing and pace of rate cuts.
She highlighted the importance of incoming data before Fed's September meeting, stating, "We'll have more data before our September meeting, and I don't want to get out ahead of that."
In her assessment, Collins remains confident in the economy's current growth pace, which she believes should help sustain a strong labor market.
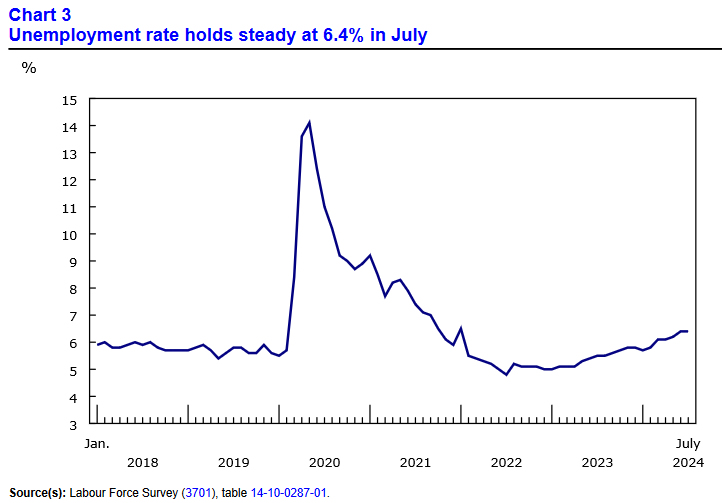
Canada's jobs down -2.8k in Jul, unemployment rate unchanged at 6.4%
Canada's employment fell -2.8k in July, much worse than expectation of 26.9k growth. The 62k rise in full-time work was offset by -62k decline in part-time work. Employment rate fell -0.2% to 60.9%.
Unemployment rate was unchanged at 6.4%, below expectation of 6.5%. Labor participation rate fell -0.3% to 65.0%.
Average hourly wages among employees increased 5.2% yoy, slowed from 5.4% yoy.
China's CPI rises to 0.5% in Jul, driven by surging food prices
China's CPI rose by 0.5% yoy in July, up from June's 0.2% yoy surpassing expectations of 0.4% yoy and marking the highest increase since February. This uptick was driven in part by a significant 20.4% yoy surge in pork prices, the highest since December 2022. Core CPI, which excludes food and energy prices, saw a slower rise of 0.4% yoy, down from 0.6% yoy in June.
On a month-over-month basis, CPI rebounded with a 0.5% increase, reversing the -0.2% decline seen in June and exceeding expectation of 0.3% rise. The rise in food prices, driven by high temperatures and heavy rainfall in some regions, contributed significantly to this monthly growth, according to NBS statistician Dong Lijuan.
Meanwhile, China's PPI as unchanged at -0.8% yoy, slightly better than the expected -0.9%.
GBP/USD Mid-Day Outlook
Daily Pivots: (S1) 1.2693; (P) 1.2722; (R1) 1.2780; More...
GBP/USD dips mildly after hitting 55 4H EMA but stays in range above 1.2664. Intraday bias remains neutral for the moment. Another fall is in favor as long as 1.2839 resistance holds. Below 1.2664 will target 1.2612 support. Decisive break there should confirm that rise from 1.2298 has completed, and target this support next. However, break of 1.2839 resistance will argue that the pull back from 1.3043 has completed and turn bias back to the upside.
In the bigger picture, current development suggests that corrective pattern from 1.3141 is extending with fall from 1.3043 as another leg. Break of 1.2612 support would strengthen this case. But still, downside should be contained by 1.2036/2298 support zone even in case of deep decline. Rise from 1.0351 (2022 low) remains in favor to resume at a later stage.
Economic Indicators Update
| GMT | Ccy | Events | Actual | Forecast | Previous | Revised |
|---|---|---|---|---|---|---|
| 01:30 | CNY | CPI Y/Y Jul | 0.50% | 0.40% | 0.20% | |
| 01:30 | CNY | PPI Y/Y Jul | -0.80% | -0.90% | -0.80% | |
| 06:00 | EUR | Germany CPI M/M Jul F | 0.30% | 0.30% | 0.30% | |
| 06:00 | EUR | Germany CPI Y/Y Jul F | 2.30% | 2.30% | 2.30% | |
| 07:00 | CHF | SECO Consumer Climate Q3 | -32 | -36 | -37 | |
| 12:30 | CAD | Net Change in Employment Jul | -2.8K | 26.9K | -1.4K | |
| 12:30 | CAD | Unemployment Rate Jul | 6.40% | 6.50% | 6.40% |
Fed’s Collins: Gradual rate cuts expected as inflation moderates
Boston Fed President Susan Collins indicated in an interview with the Providence Journal that if current economic data trends continue as expected, it may soon be appropriate to start adjusting monetary policy by "easing how restrictive the policy is".
She emphasized her expectation for "continued gradual reduction" in inflation toward the 2% target, all while maintaining a healthy labor market.
Collins also noted that she anticipates interest rates to be lower in the coming years, although she refrained from providing specific details on the timing and pace of rate cuts.
She highlighted the importance of incoming data before Fed's September meeting, stating, "We’ll have more data before our September meeting, and I don't want to get out ahead of that."
In her assessment, Collins remains confident in the economy's current growth pace, which she believes should help sustain a strong labor market.
Canada’s jobs down -2.8k in Jul, unemployment rate unchanged at 6.4%
Canada's employment fell -2.8k in July, much worse than expectation of 26.9k growth. The 62k rise in full-time work was offset by -62k decline in part-time work. Employment rate fell -0.2% to 60.9%.
Unemployment rate was unchanged at 6.4%, below expectation of 6.5%. Labor participation rate fell -0.3% to 65.0%.
Average hourly wages among employees increased 5.2% yoy, slowed from 5.4% yoy.
Gold (XAU/USD) Remains Strong Above $2400/oz as Fed Hints at Upcoming Rate Cuts
- Despite a stronger US Dollar yesterday, gold’s upward trend continued, bolstered by the rate cut narrative.
- The technical outlook for gold indicates further upside potential, with prices possibly reaching between 2440 and 2450 during the US session.
- The longer-term outlook is supportive of gold prices as geopolitics, ETF flows and Central Bank Buying remain in play.
Gold prices surged yesterday, hitting a daily peak of $2424/oz, driven by comments from Fed policymakers and better-than-expected jobless claims data.
Improved sentiment from the jobless claims data gave a boost to the Dollar Index and saw US Treasury yields rise. However, gold continued its upward trend, defying the stronger US Dollar.
Remarks from three Federal Reserve policymakers further bolstered the rate cut narrative, a key factor in gold’s rally this year.
Thomas Barkin from the Richmond Federal Reserve Bank was the least hawkish, highlighting a positive inflation print. Austin Goolsbee of Chicago met market expectations by stating that current high rates pose risks to the labor market. He also noted that the US elections and recent stock market rout would not influence Fed policy.
Overall, the outlook for gold remains positive. The rate cut narrative, geopolitical tensions, robust ETF flows, and central bank buying all support the precious metal.
ETF Flows Finally Turned Positive in May
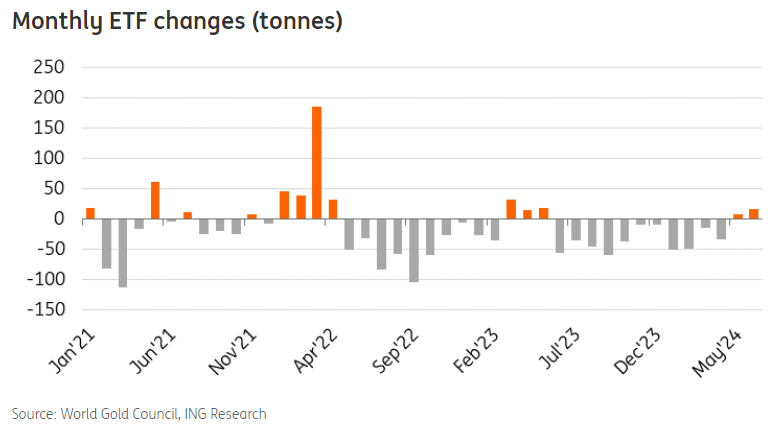
Source: World Gold Council, ING Research
Given this context, any significant price drop is likely to be met with strong buying pressure, limiting the downside.
Technical Analysis Gold (XAU/USD)
From a technical perspective, gold posted a significant bullish engulfing candle yesterday, recovering losses from the previous two days. After a brief pullback during the Asian session, the upward momentum continued into the London session.
Currently, the price is challenging a key resistance level at 2432, with another resistance area at 2450. The technical outlook indicates further upside potential, and in the absence of economic data today, we could see prices reaching between 2440 and 2450 during the US session.
However, whether the bulls will push beyond this range ahead of the weekend remains uncertain.
Immediate support is located around the 2414 level, with the psychological 2400 mark also providing support. A retest of these levels could occur if buyers decide to take profits and unwind positions before the weekend.
GOLD (XAU/USD) Chart, August 9, 2024
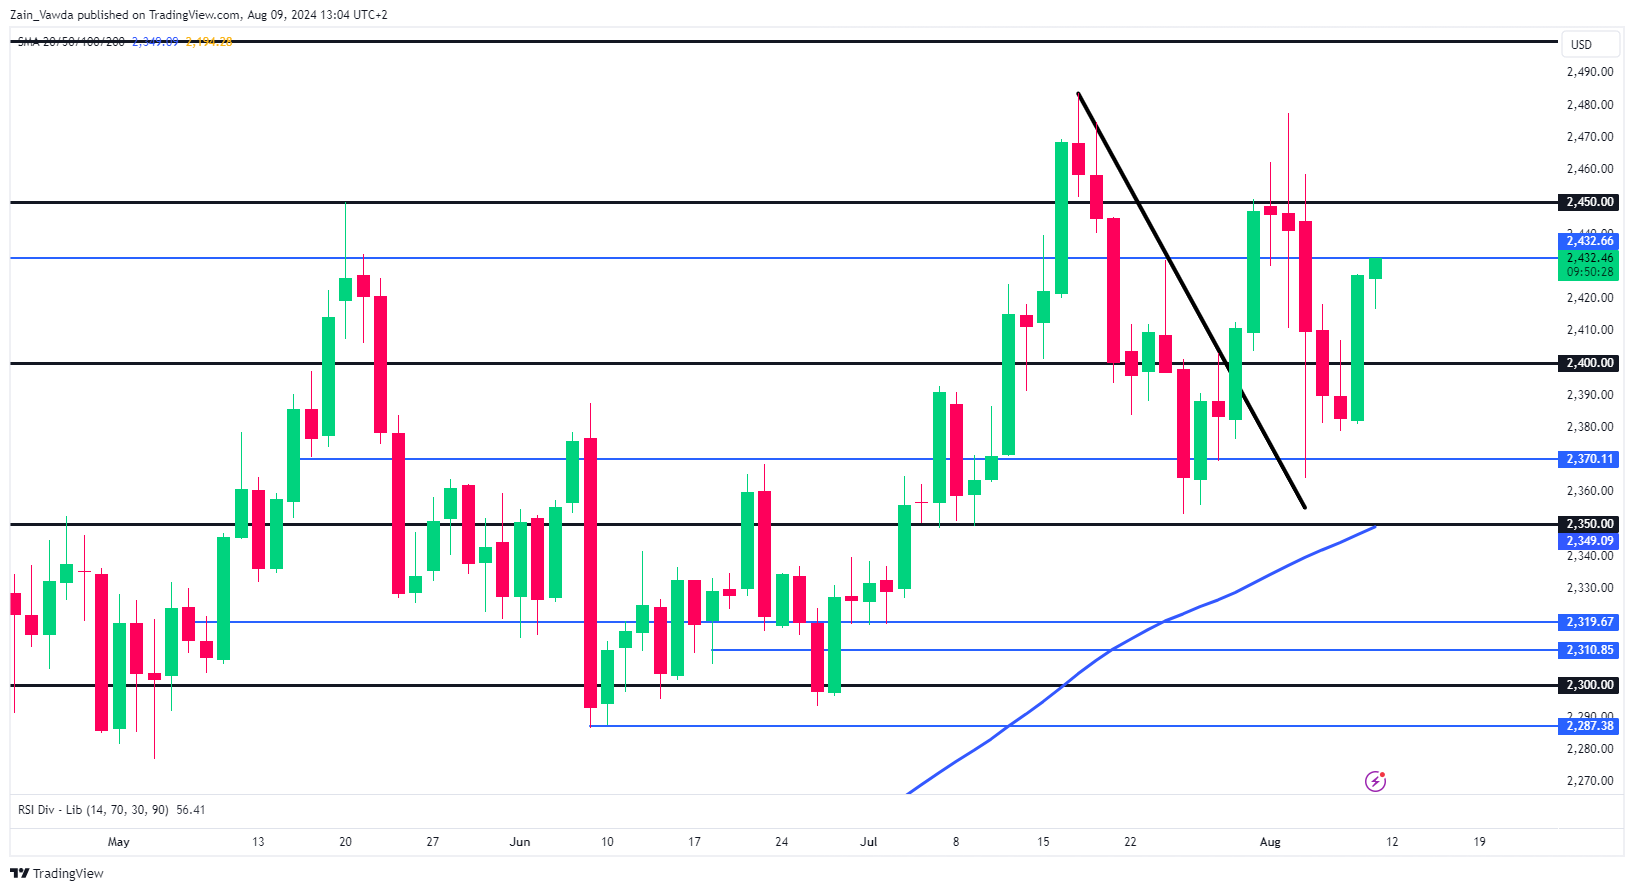
Source: TradingView (click to enlarge)
Support
- 2414
- 2400
- 2380
Resistance
- 2432
- 2450
- 2470
Gold Is Back, But Not For Long
Gold has experienced increased volatility over the past seven days, falling 4.4% from Friday’s high to Monday’s low and then rising 2.5% from the low. Much of gold’s recovery on Thursday was in tandem with a massive rally in equities in response to some improvement in weekly jobless claims.
Technically, gold was able to find some quick buyer support after touching its 50-day moving average. It is worth noting that in late July, the price did not bounce until the next day, and in June, it spent a long time lower, although the bulls managed to halt the downward spiral. So, the importance of this curve in the short term is growing.
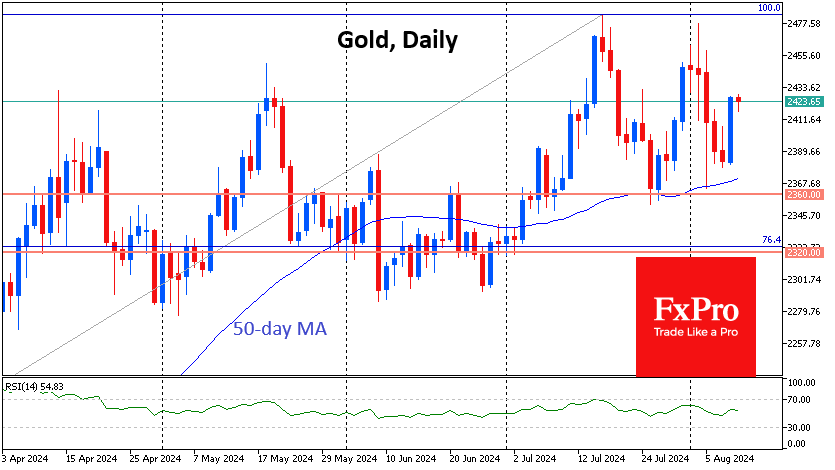
On the other hand, the price peak in early August was lower than the July record. Moreover, in all cases where the price peaked, gold fell in the following three days, which indirectly indicates a prolonged selling overhang. However, it is so muted that it does not technically disrupt the bullish picture.
Partial profit taking or giving up in a bull market? The dynamics of the coming week will answer this question, with a potential climax in the release of inflation statistics and possibly retail sales.
The direction of the exit from the prolonged $2360-$2460 consolidation will help determine market sentiment towards gold in the near term. And a move within this range, while still massive, looks like market noise.
Looking at the weekly timeframe, there is a better chance that the range exit will be to the downside, as the last higher price peak came at a lower RSI level. This is a signal that growth momentum is running out.
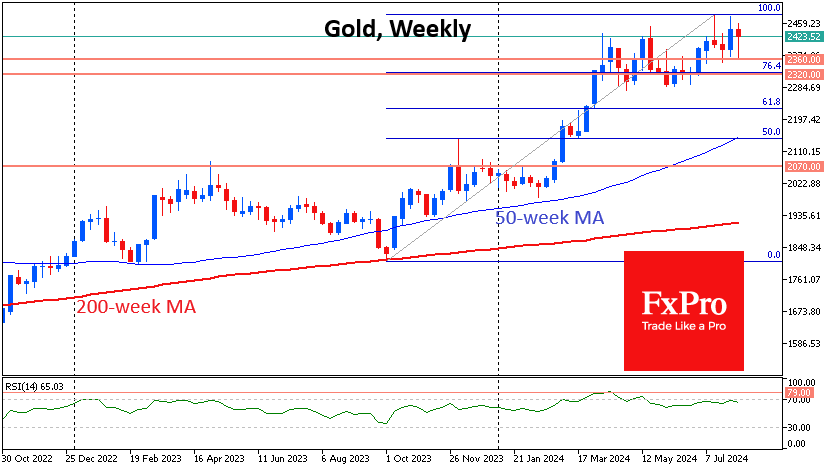
While lower interest rates are theoretically positive for gold, in practice, the acceleration of QE in September 2012 triggered a bear market for the next three years. Later, at the end of 2015, gold reached a cyclical low on the day of the first Fed tightening. So, we should not be surprised if the start of Fed easing turns out to be negative for gold, as it would be a sign of a weak market, not a bloodless victory over inflation.
GBP/USD: Bullish Bias Above Rising Daily Cloud
Cable remains at the front foot and extends recovery on Friday morning, after fresh bulls registered break and close above the top of rising daily cloud.
Fading US recession fears and solid Chinese economic data revived risk sentiment while sterling gets support from diverging US/UK monetary policies (bets for the size of Fed rate cuts this year went well above expectations for BoE’s action) keeping pound underpinned.
Fresh gains cracked barriers at 1.2754/60 (Fibo 23.6% of 1.3044/1.2664 / falling daily Tenkan-sen), with daily close above these levels to boost developing bullish signals on formation of reversal pattern on daily chart.
Mixed daily studies lack clearer direction signal (negative momentum / mixed setup of MA’s / north-heading RSI).
Near term bias is expected to remain with bulls while the price stays above rising daily cloud, but extension through pivotal barriers at 1.2780 / 1.2810 (55DMA / Fibo 38.2%) is needed to confirm signal for recovery continuation.
Conversely, penetration of daily cloud (top lays at 1.2715) would weaken near-term structure and expose lower pivots at 1.2685/58 (converging 100/200DMA’s) loss of which will be bearish.
Res: 1.2739; 1.2760; 1.2780; 1.2815.
Sup: 1.2754; 1.2715; 1.2685; 1.2658.