Sample Category Title
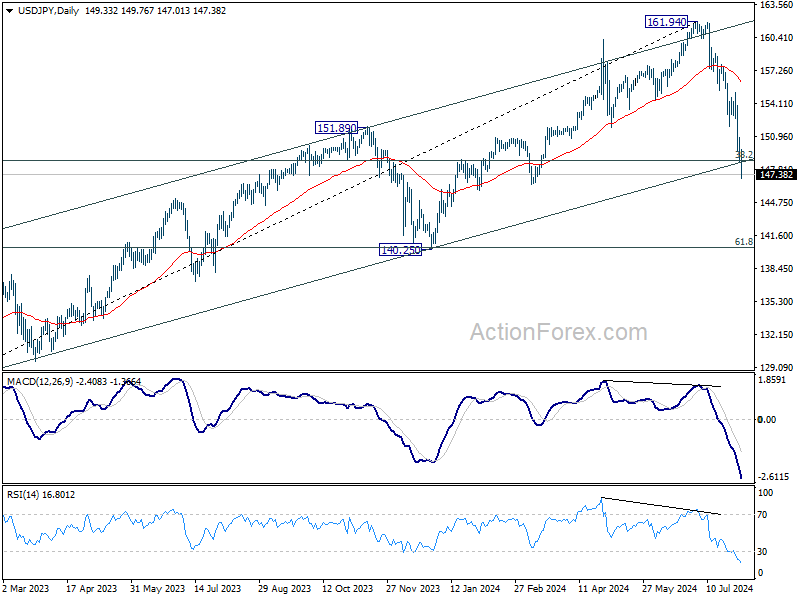
USD/JPY Mid-Day Outlook
Daily Pivots: (S1) 148.42; (P) 151.16; (R1) 152.72; More...
USD/JPY's steep decline from 161.94 reaccelerates to as low as 147.01 so far. There is no sign of bottoming yet and intraday bias stays on the downside. Next target is 140.25 fibonacci level. On the upside, above 150.88 minor resistance will turn intraday bias neutral and bring consolidations first, before staging another fall.
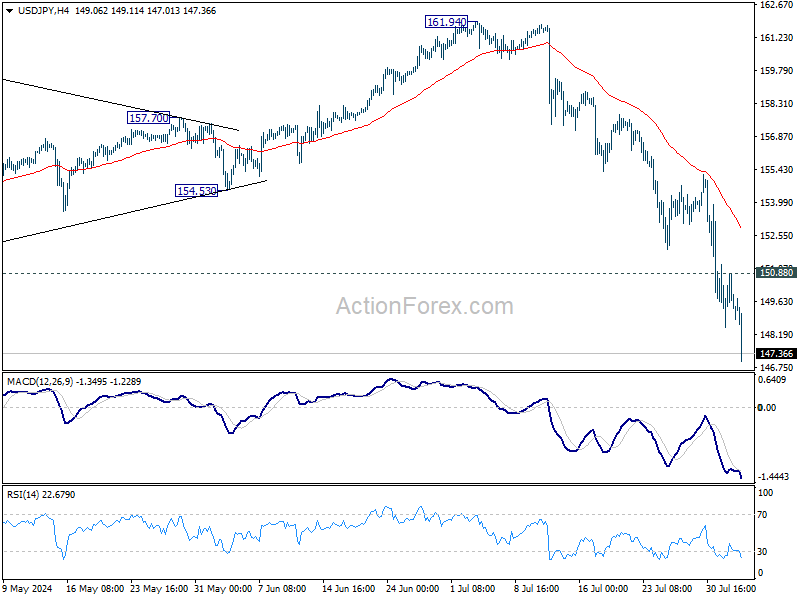
In the bigger picture, fall from 161.94 medium term top is seen as correcting the whole rise from 127.20 (2023 low) at least. With 38.2% retracement of 127.20 to 161.94 at 148.66, taken out, next target is 140.25 cluster support, which is close to 61.8% retracement at 140.47. Risk will now stay on the downside as long as 55 D EMA (now at 156.07) holds, in case of strong rebound.
Risk Aversion Deepens as US Non-Farm Payrolls Fall Short of Expectations
Risk aversion is intensifying in early US session after non-farm payroll report significantly missed expectations on all fronts. This follows yesterday's poor manufacturing data, which has already sparked discussions about a hard landing for the US economy. The weak job data is likely to fuel these concerns further, as stock futures are tumbling sharply, pointing to a notably lower open. In the financial markets, stock futures tumble sharply and are pointing to a sharply lower open. Meanwhile, 10-year yield is extending this week's steep decline and is set to challenge 3.8% mark.
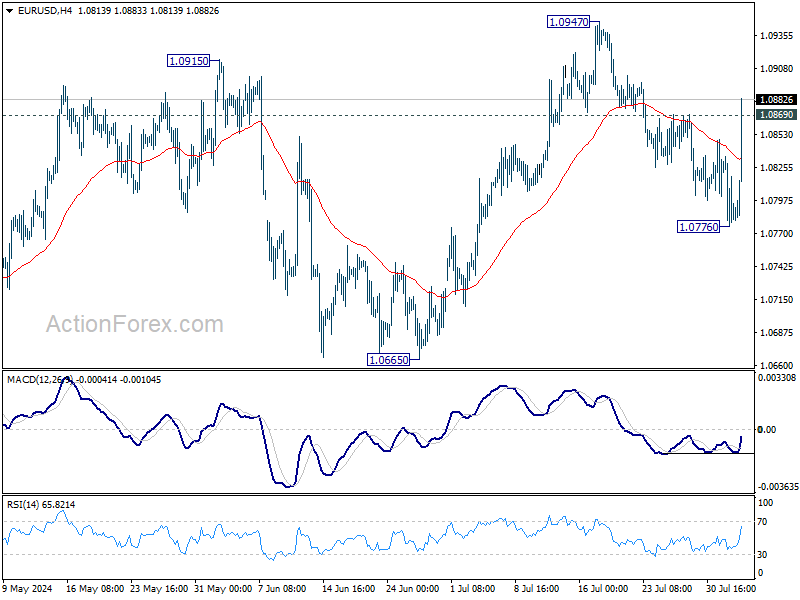
Dollar's reaction to these developments has been complex. It continues to decline against safe-haven currencies such as Yen and the Swiss Franc. However, it remains steady against commodity currencies due to the offsetting impact of diving Treasury yields and prevailing risk-off sentiment. The greenback is holding onto most of its gains against Sterling for the week but is showing weakness against the euro, which is also surging against the Pound.
Technically, EUR/USD's break of 1.0869 resistance suggests that pull back from 1.0947 has completed at 1.0776 already. Rise from 1.0601 (Apr low) is likely ready to resume through 1.0947. While this development won't make Euro a better candidate to go long than Yen and Swiss Franc, it at least won't be the best one to sell.
In Europe, at the time of writing, FTSE is down -0.54%. DAX is down -2.16%. CAC is down -1.30%. UK 10-year yield is down -0.074 at 3.818. Germany 10-year yield is down -0.076 at 2.174. Earlier in Asia, Nikkei fell -5.81%. Hong Kong HSI fell -2.08%. China Shanghai SSE fell -0.92%. Singapore Strait Times fell -1.12%. Japan 10-year JGB yield fell -0.0759 to 0.959.
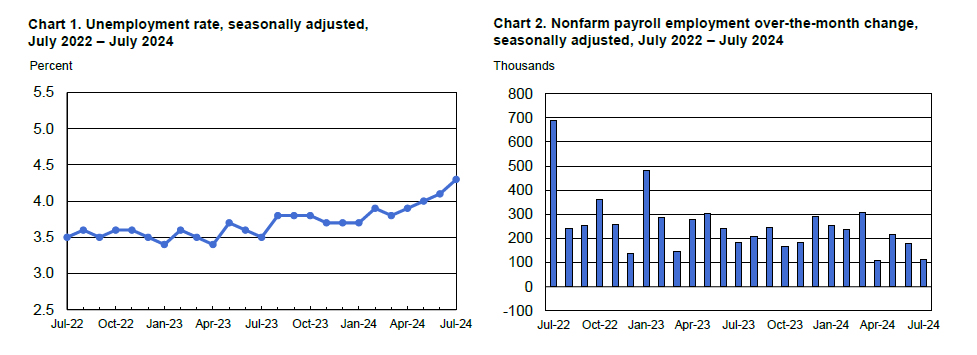
US non-farm payrolls grow 114k in Jul, unemployment rate rises to 4.3%
US non-farm payroll employment grew only 114k in July, well below expectation of 176k. That's all well below average monthly gain of 215k over the prior 12 months.
Unemployment rate jumped from 4.1% to 4.3%, above expectation of 4.1%. Participation rate ticked up by 0.1% to 62.7%.
Average hourly earnings rose 0.2% mom, below expectation of 0.3% mom. Annual wages growth slowed from 3.8% yoy to 3.6% yoy, below expectation of 3.7% yoy.
Swiss CPI at -0.2% mom, 1.3% yoy in Jul, matches expectations
Swiss CPI fell -0.2% mom in July, matched expectations. Core CPI (excluding fresh and seasonal products, energy and fuel) fell -0.3% mom. Domestic product prices rose 0.2% mom. Imported products prices fell -1.3% mom.
For the 12-month period, CPI was unchanged at 1.3% yoy, matched expectations. Core CPI was unchanged at 2.0% yoy. Domestic product prices growth was unchanged at 2.0% yoy. Import product prices growth deepened from -0.8% yoy to -1.0% yoy.
USD/JPY Mid-Day Outlook
Daily Pivots: (S1) 148.42; (P) 151.16; (R1) 152.72; More...
USD/JPY's steep decline from 161.94 reaccelerates to as low as 147.01 so far. There is no sign of bottoming yet and intraday bias stays on the downside. Next target is 140.25 fibonacci level. On the upside, above 150.88 minor resistance will turn intraday bias neutral and bring consolidations first, before staging another fall.
In the bigger picture, fall from 161.94 medium term top is seen as correcting the whole rise from 127.20 (2023 low) at least. With 38.2% retracement of 127.20 to 161.94 at 148.66, taken out, next target is 140.25 cluster support, which is close to 61.8% retracement at 140.47. Risk will now stay on the downside as long as 55 D EMA (now at 156.07) holds, in case of strong rebound.
Economic Indicators Update
| GMT | Ccy | Events | Actual | Forecast | Previous | Revised |
|---|---|---|---|---|---|---|
| 23:50 | JPY | Monetary Base Y/Y Jul | 1.00% | 0.90% | 0.60% | |
| 01:30 | AUD | PPI Q/Q Q2 | 1.00% | 1.00% | 0.90% | |
| 01:30 | AUD | PPI Y/Y Q2 | 4.80% | 4.30% | ||
| 06:30 | CHF | CPI M/M Jul | -0.20% | -0.20% | 0.00% | |
| 06:30 | CHF | CPI Y/Y Jul | 1.30% | 1.30% | 1.30% | |
| 06:45 | EUR | France Industrial Output M/M Jun | 0.80% | 0.90% | -2.10% | -2.20% |
| 07:30 | CHF | Manufacturing PMI Jul | 43.5 | 44.6 | 43.9 | |
| 08:00 | EUR | Italy Industrial Output M/M Jun | 0.50% | -0.20% | 0.50% | |
| 09:00 | EUR | Italy Retail Sales M/M Jun | -0.20% | 0.20% | 0.40% | |
| 12:30 | USD | Nonfarm Payrolls Jul | 114K | 176K | 206K | 179K |
| 12:30 | USD | Unemployment Rate Jul | 4.30% | 4.10% | 4.10% | |
| 12:30 | USD | Average Hourly Earnings M/M Jul | 0.20% | 0.30% | 0.30% | |
| 14:00 | USD | Factory Orders M/M Jun | 0.50% | -0.50% |
US non-farm payrolls grow 114k in Jul, unemployment rate rises to 4.3%
US non-farm payroll employment grew only 114k in July, well below expectation of 176k. That's all well below average monthly gain of 215k over the prior 12 months.
Unemployment rate jumped from 4.1% to 4.3%, above expectation of 4.1%. Participation rate ticked up by 0.1% to 62.7%.
Average hourly earnings rose 0.2% mom, below expectation of 0.3% mom. Annual wages growth slowed from 3.8% yoy to 3.6% yoy, below expectation of 3.7% yoy.
Gold (XAU/USD) Continues to Surge: New Highs as Fed Rate Cut Looms
The price of gold (XAUUSD) continues its upward trajectory, hitting a new peak at 2460 USD per troy ounce on Friday. The surge in gold prices is largely driven by growing expectations that the US Federal Reserve will soon reduce interest rates. This anticipation has been bolstered by recent signals from the Fed’s July meeting and weaker-than-expected US economic data.
Recent US manufacturing activity has declined sharply, and unemployment claims have reached a high of 249,000 for the year, indicating potential economic softening. These factors contribute to the speculation of a possible rate cut by the Fed as early as September, contingent on forthcoming economic reports.
Moreover, escalating tensions in the Middle East enhance gold’s appeal as a safe-haven asset, adding another layer of support for the rising prices.
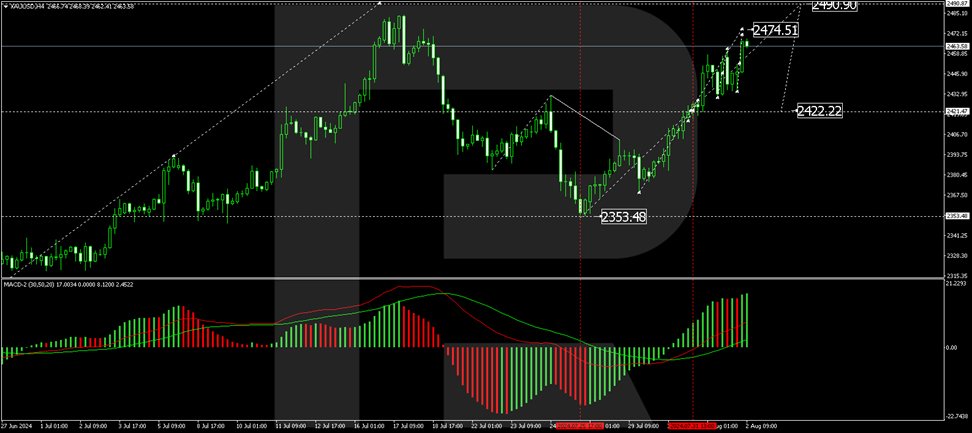
Technical analysis: XAU/USD
On the H4 chart, XAU/USD performed a growth wave to the level of 2422.22. The market has formed a compact consolidation range around this level, and with the upside exit, the growth wave continues to the level of 2474.50. The target is local. After reaching this level, we will consider the probability of correction to 2422.22 (testing from above). Further, we expect the beginning of a new wave of growth towards 2490.90. Technically, this scenario is confirmed by the MACD indicator, with its signal line above the zero level and trending upwards.
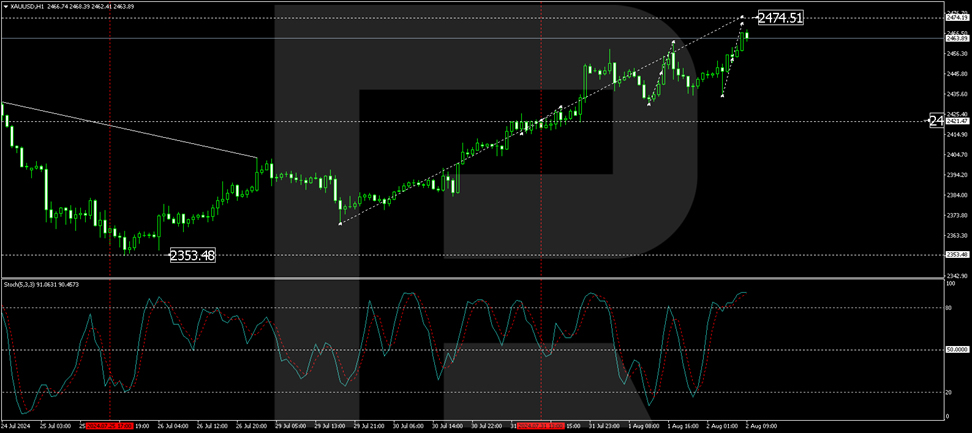
On the H1 chart of XAU/USD, the market has formed a consolidation range around 2446.00. With the upside exit, considering the probability of the wave continuation to the local target of 2474.50 is suggested. After reaching this level, we will consider the likelihood of correction to 2422.22. Technically, this scenario is confirmed by the Stochastic oscillator, with its signal line above 80 and preparing for a decline.
Investors and traders should monitor these levels closely, as developments regarding the Fed’s forthcoming decisions and geopolitical factors could significantly impact further movements in the gold market.
EUR/CHF: Medium-Term Global Risk-Off Kickstarts
- Further weakness in the US ISM Manufacturing PMI & Employment sub-component increases the risk of a hard landing scenario.
- A Fed interest rate cut that is implemented late in the US economic cycle where a downturn may be already in motion sees the evaporation of the earlier outperformance of the Dow Jones Industrial Average and Russell 2000.
- EUR/CHF faces further downside pressure reinforced by a medium-term global risk-off episode.
Since the publication of our previous analysis, the S&P 500 has failed to break above its 20-day moving average which has acted as a near-term resistance at 5,540. In addition, its price actions staged a bearish reaction after a retest on the 20-day moving average on Thursday, 1 August, and declined by 1.37%.
Interestingly, all the major US stock indices ended with losses yesterday, even last month July’s outperformers, the Russell 2000 (+10%) and Dow Jones Industrial Average (+4.4%) were not spared of the bloodshed with daily declines of 3% and 1.2% respectively.
The sell-off seen in the US stock market coupled with Amazon, a mega-cap tech stock that reported a revenue miss for Q2 earnings and lackluster guidance triggered a global risk-off episode today, 2 August in the Asian session that inflicted the major European benchmark stock indices as well with intraday losses of 1.6% and 0.8% seen on Germany DAX and France CAC at this time of the writing.
Major benchmark Asian stock indices from Japan, South Korea, Taiwan, Hong Kong, China, Singapore, and Australia all ended in the red, and the worst hit was Japan’s Nikkei 225 which recorded a horrendous decline of 5.8%, its worst intraday day performance in percentage terms since the Covid pandemic outburst on 13 March 2020.
Risk of a hard landing scenario in the US has increased
The catalyst that reinforced this potential medium-term risk-off phase has been the worst-than-expected US ISM Manufacturing PMI and its Employment sub-component data for July. The headline Manufacturing PMI declined further to 46.8 in July from 48.5 in June, reflecting the sharpest contraction in US factory activities since November 2023. The Manufacturing Employment sub-component also decreased further to 43.40 in July, its steepest pace of contraction since June 2020, from a reading of 49.3 in June.
These weak data points in a leading US survey-based economic indicator have increased the risk of a further softening of the US labour market which suggests the US economy is likely to be on the brink of a hard landing or recession.
The hesitant US Federal Reserve in enacting its first interest rate cut at the late part of the US economic cycle where a downturn may have already materialized added fuel to the current risk-off episode.
Hence, the further bull steepening of the US Treasury yield curve with the US Fed being late gain on its monetary policy implementation is likely to see a synchronized downtrend in all the four major US stock indices with the earlier outperformance of the Dow Jones Industrial Average and Russell 2000 at risk of evaporation.
JPY and CHF are the strongest currencies so far
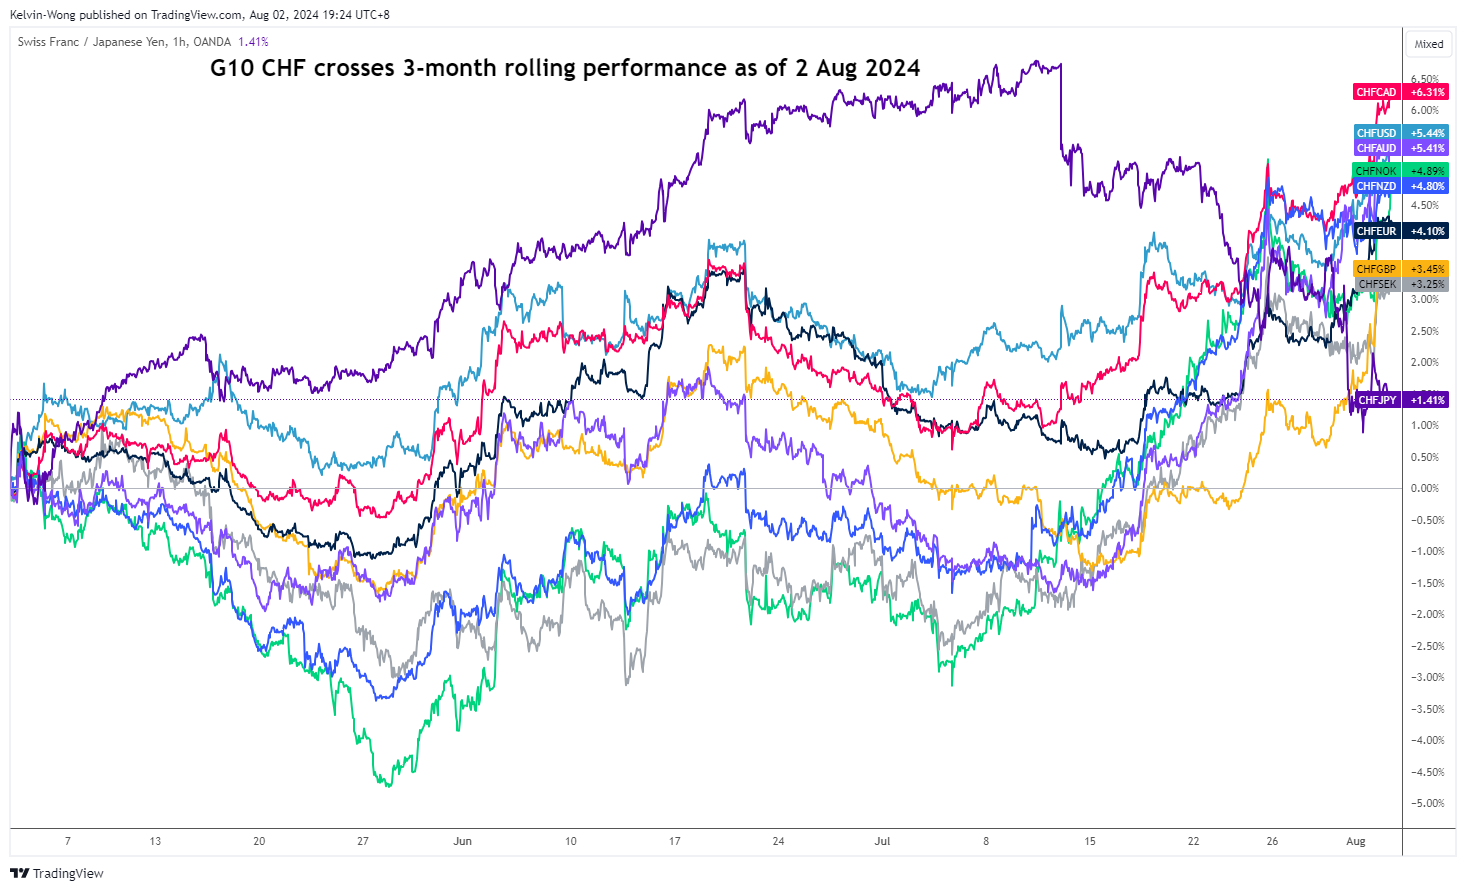
Fig 1: 3-month rolling performance G-10 CHF crosses as of 2 Aug 2024 (Source: TradingView, click to enlarge chart)
In the FX market, the safe haven currencies; the Swiss franc and the Japanese yen are the outperformers at this juncture where the CHF rose against all G-10 currencies such as the EUR, GBP, AUD, and USD on a three-month rolling performance basis but not against the JPY due to a firmer Bank of Japan (BoJ) that is now on track to implement a quantitative tightening programme that is likely to see interest rates in Japan on a gradual path of moving higher from prior decade-plus of persistently negative interest rate levels (see Fig 1).
EUR/CHF at risk of further decline
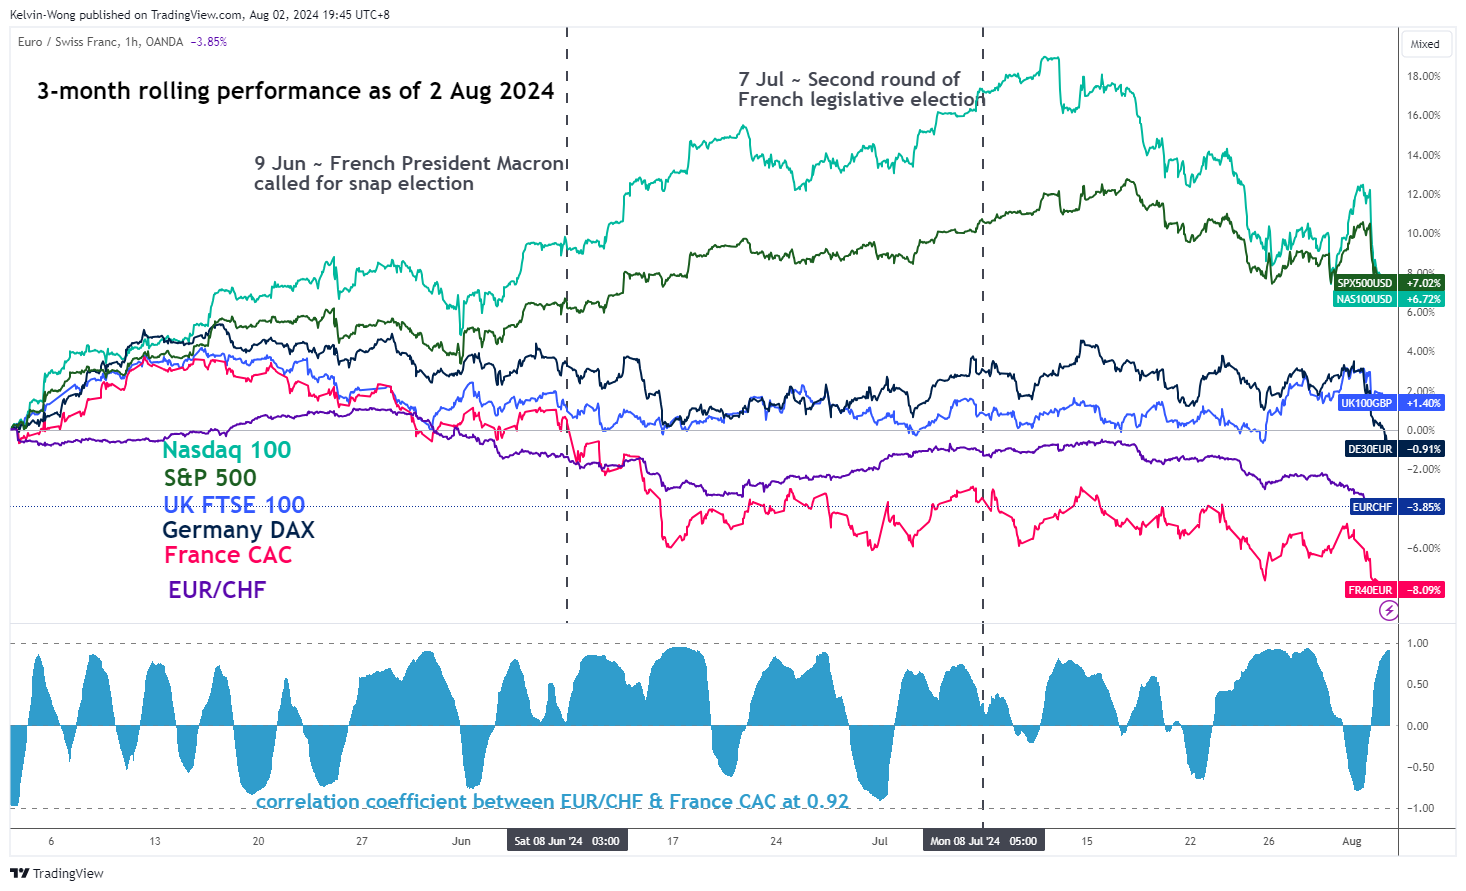
Fig 2: 3-month rolling performance CAC 40, EUR/CHF & other major stock indices (US, Germany, UK) as of 2 Aug 2024 (Source: TradingView, click to enlarge chart)
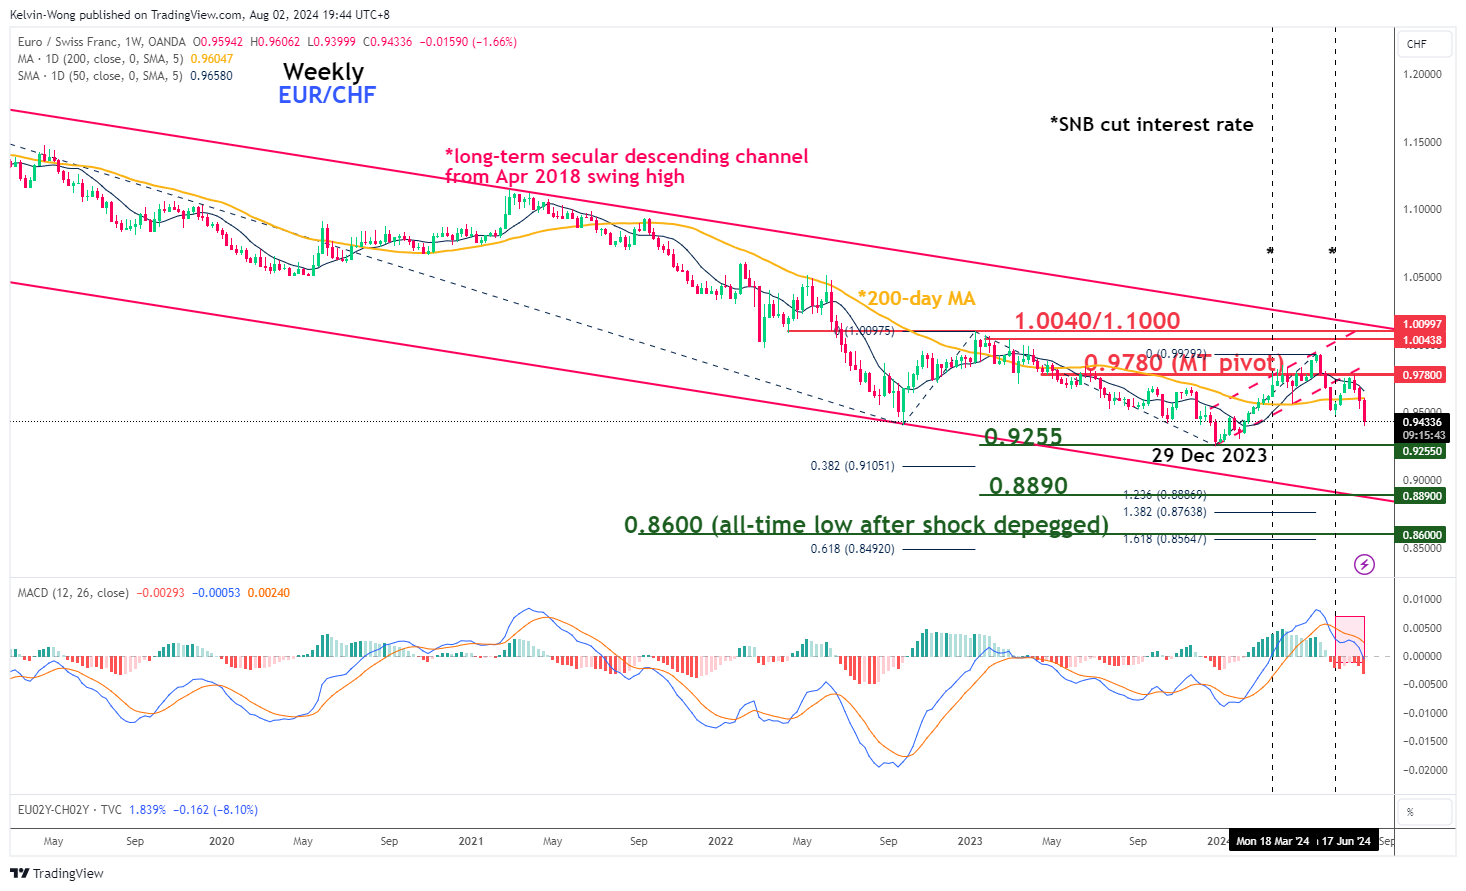
Fig 3: EUR/CHF major trend as of 2 Aug 2024 (Source: TradingView, click to enlarge chart)
Given the outperformance of the Swiss franc in the ongoing global risk-off episode, the EUR/CHF now faces the risk of a medium-term (multi-week) corrective decline scenario unfolding as it has a high direct correlation with major European benchmark stock indices such as the France CAC with a 60-period rolling correlation coefficient of 0.92 at this time of the writing (see Fig 2).
In the lens of technical analysis, the EUR/CHF cross pair is still oscillating within a long-term secular descending channel since April 2018.
In addition, the weekly MACD trend indicator has just broken below its centreline and it started trending lower since the week of 10 June 2024. These observations reinforced a potential ongoing multi-week bearish trend that is still unfolding in the EUR/CHF with its price actions now firmly trading below its 200-day moving average (see Fig 3).
If the 0.9780 key medium-term pivotal resistance is not surpassed to the upside, further weakness may prevail on the EUR/CHF and a break below 0.9255 (29 December 2023 major swing low) exposes the next major support to come in at 0.8890 (also the lower boundary of the long-term secular descending channel).
On the other hand, a clearance above 0.9780 negates the bearish tone for a medium-term corrective rebound scenario to take shape for the major resistance zone to come in at 1.0040/1.1000 (also the upper boundary of the long-term secular descending channel).
Bitcoin Fends Off Bear Attack, Clinging to Levels
Market picture
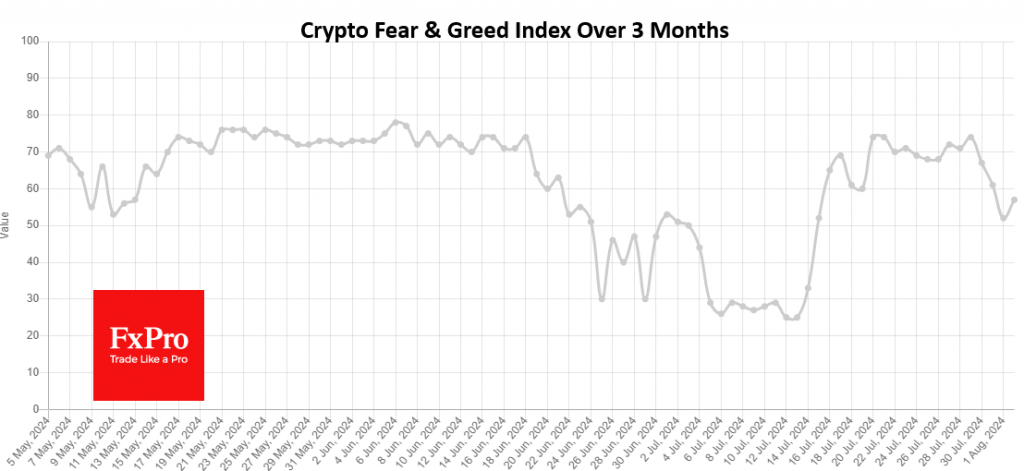
The crypto market lost 0.75% in 24 hours to $2.29 trillion. A day earlier, we noted a decline in cryptocurrencies in contrast to the positivity in equities on Wednesday, and then synchronised selling prevailed on Thursday. Meanwhile, the sentiment index remains at 57 (greed). This is bad news for the market right now, as a state of fear might have attracted buyers on downturns, but now they will wait for a bigger drawdown.
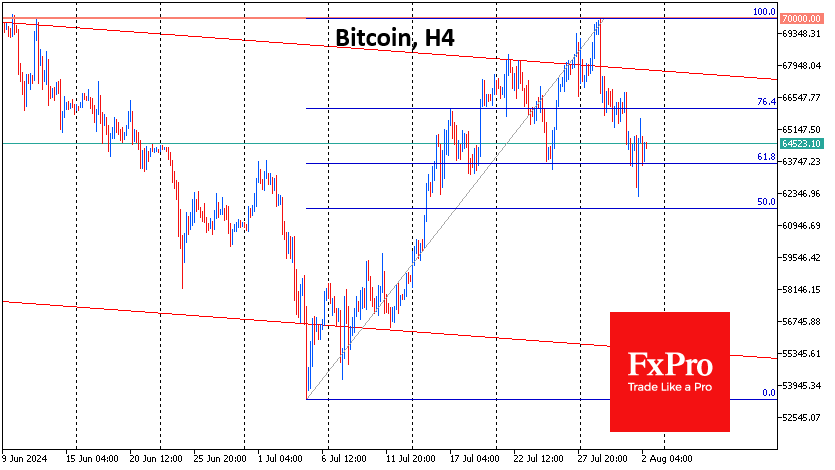
At the same time, the bulls in Bitcoin are leaving important levels behind them, having managed to push back from the 50-day moving average. The price change over the past 36 hours is small (-0.6%), but this result masks a 5.5% jump in price in the five hours after touching lows near $62.3K on Thursday night.
Current levels fit into a corrective pattern from the July price amplitude. However, it is difficult to rely on this short-term pattern ahead of labour market data, with volatility spiking in equities.
News background
Bitcoin’s hashrate drawdown from its all-time high is just 3%, down from 8% as of 9 July, and a recovery in the index is usually associated with a sustained rally, CryptoQuant noted. BTC’s hashrate growth will contribute to the stability of its price.
At the end of July, the Solana ecosystem surpassed Ethereum for the first time in terms of trading volume on decentralised exchanges—$55.8 bn versus $53.8bn. The hype around Solana-based meme tokens probably influenced the growth of the metric.
USDT issuer Tether posted a record net profit of $5.2bn in the first half of the year, of which approximately $1.3bn was interest income from US government bonds. The company received another ~$3.9bn due to the increase in the value of positions in bitcoin and gold.
Telegram developers unveiled new features in the messenger, including a browser with support for TON-based Web3 browsing and a mini-app shop. The internal currency Telegram Stars can now be gifted to contacts via the Settings section.
USD/CHF Falls to Lowest Level in Nearly Six Months
As today's USD/CHF chart shows, the exchange rate has fallen below 0.872 – the Swiss franc hasn't been this strong against the US dollar since early February this year.
Bearish sentiment is driven by:
→ Expectations of a Fed rate cut, weakening the US dollar;
→ Low inflation in Switzerland – today's CPI data shows -0.2%;
→ Geopolitical tension, particularly the escalation in the Middle East following the killing of Hamas leader Ismail Haniyeh and the anticipated response from Iran.
Market participants appear to view the franc as a "safe haven."
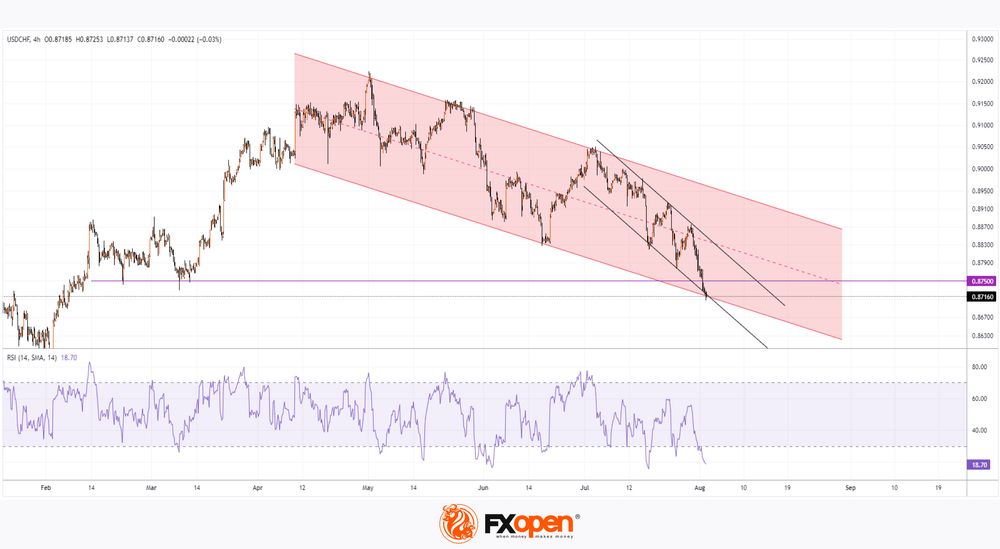
Technical analysis of USD/CHF chart shows:
→ The price has been in a downtrend (shown in red) since May this year, with the downward movement accelerating in July, as indicated by the black lines.
→ The psychological level of 0.875, which served as support in February-March, was breached with a wide bearish candle on the first day of August.
→ Today, the price is near a support block formed by the lower boundaries of the mentioned channels.
Can the USD/CHF price bounce from the area where these channel boundaries intersect? Some recovery seems plausible given the current oversold condition indicated by the RSI.
However, if a rebound occurs, bulls may face a series of potential obstacles:
→ The former support level at 0.875;
→ The median boundary of the blue channel;
→ The upper black line.
Trade over 50 forex markets 24 hours a day with FXOpen. Take advantage of low commissions, deep liquidity, and spreads from 0.0 pips. Open your FXOpen account now or learn more about trading forex with FXOpen.
This article represents the opinion of the Companies operating under the FXOpen brand only. It is not to be construed as an offer, solicitation, or recommendation with respect to products and services provided by the Companies operating under the FXOpen brand, nor is it to be considered financial advice.
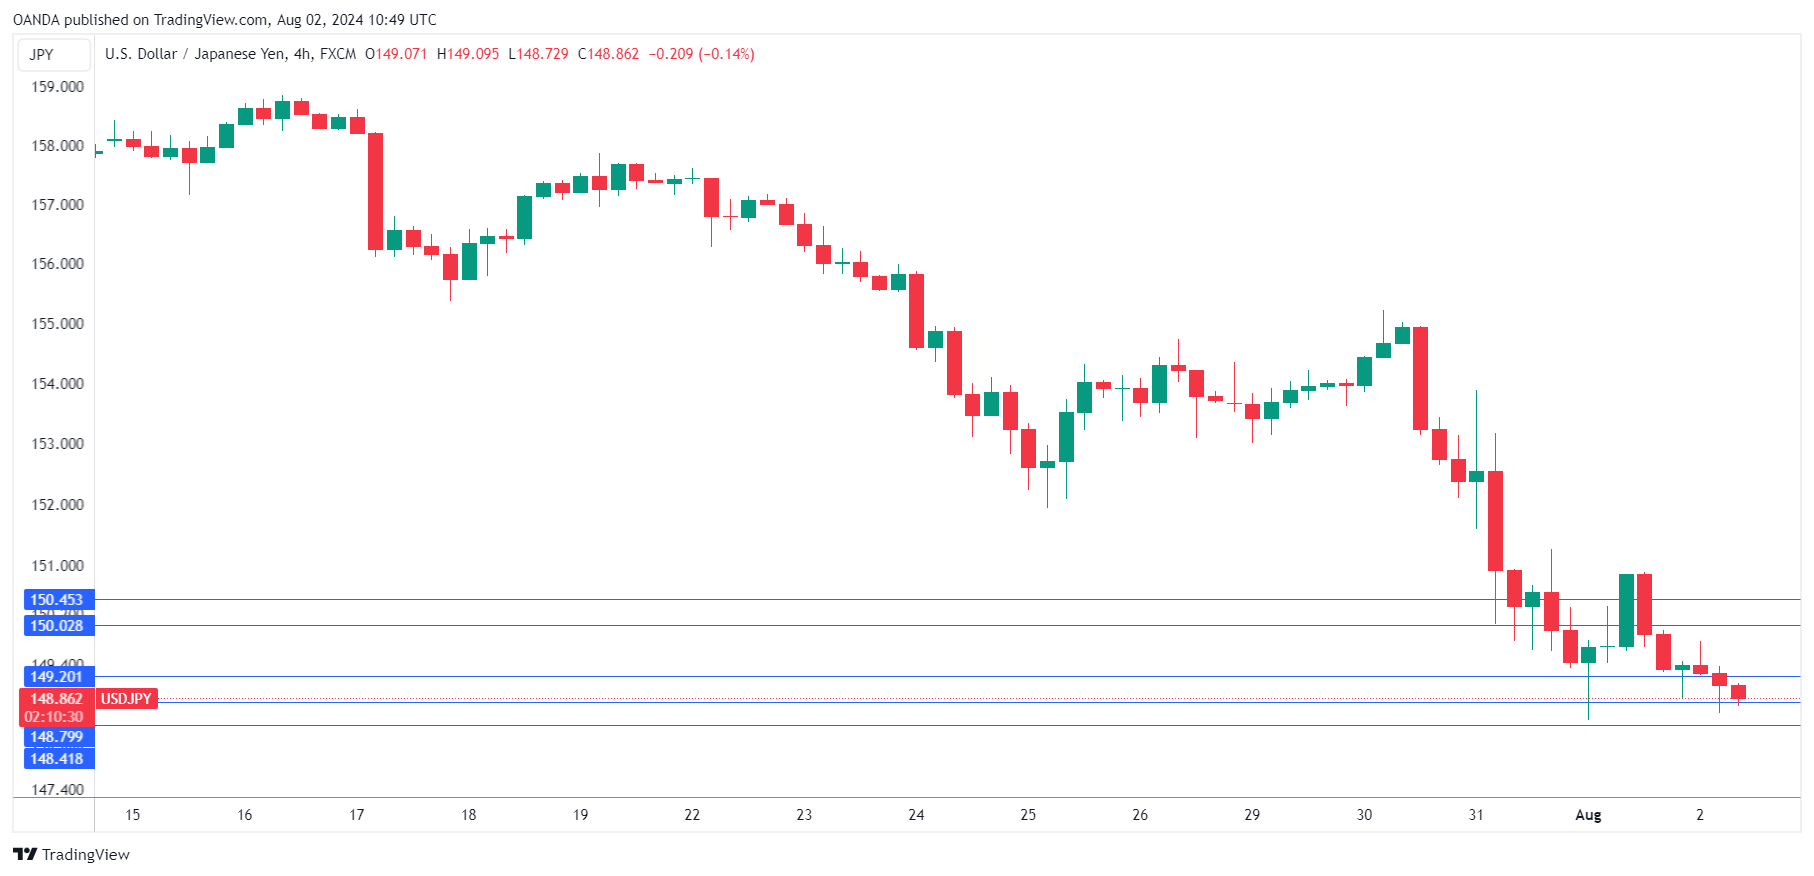
USD/JPY – Surging Yen Improves to 15-week High
The Japanese yen continues to rally. USD/JPY is trading at 148.86 in the European session, down 0.31% on the day at the time of writing. On Thursday, the yen strengthened as much as 148.50, its best showing since May 11.
Yen continues to pummel US dollar
Only three weeks ago, the yen looked dead in the water. USD/JPY was trading just shy of 162, its highest level in almost four decades. Since then, the yen has been on an absolute tear, rising a staggering 7.9%, including 3.1% this week.
What is driving the yen’s spectacular turnaround? First, the Bank of Japan raised interest rates this week to 0.25%. Although rates remain at low levels, this rate increase, the second since March, indicates that the BoJ is slowly making the shift to normalization after decades of an ultra-loose accommodative policy.
The BoJ also announced it would taper its bond purchases, which is another tightening step.
Second, investors have become less enthusiastic about the US dollar now that a September cut is looking very likely and are looking to park their assets elsewhere.
The US economy is showing some signs of weakness, such as this week’s ISM manufacturing PMI for July, which posted the sharpest contraction since November 2023. This has driven funds away from the US dollar towards safe-haven assets such as the yen. Today’s nonfarm payrolls are expected to fall from 206 thousand to 175 thousand, which could further boost the yen at the expense of the US dollar.
This week’s BoJ rate hike showed that change is afoot in Japan and the government’s annual white paper on economic and fiscal policy, which was released today, supported that view. The white paper said that Japan was showing signs of breaking out of deflation, noting that businesses were now passing on costs to consumers due to increased costs from the yen’s sharp decline.
USD/JPY Technical
- USD/JPY continues to break below support levels. Earlier, it pushed below support at 149.19 and is testing support at 148.72. Below, there is support at 149.59
- 150.03 and 150.44 are the next resistance lines
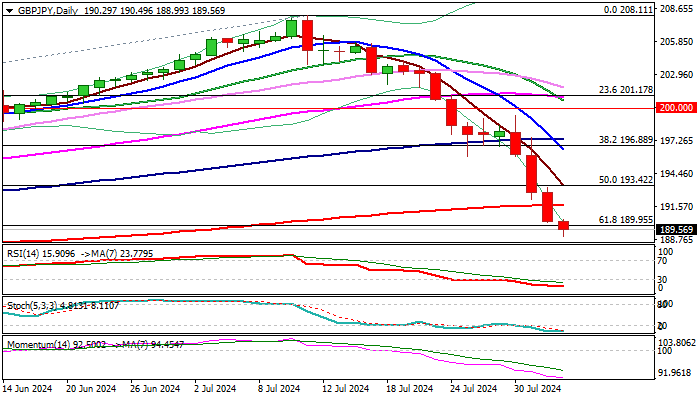
GBP/JPY Outlook: Hits New Multi-Week Low
GBPJPY continues to trend lower and fell to the lowest levels since mi-March during European session on Friday.
The cross remains in a steep downtrend from 208.11 (July 11 peak, the highest since Aug 2008), fueled by renewed strength of yen, following interventions by Japan’s authorities, while BoE rate cut added pressure on sterling.
Strong bearish signals were generated on surge through rising daily cloud (spanned between 200.39 and 196.71), breach of 200DMA (191.74) and today’s violation of Fibo support at 189.55 (61.8% of 178.73/208.11 upleg).
The pair is on track to end the fourth consecutive week in red, after close of trading in July with the biggest monthly loss since June 2016, added to negative prospects, as reversal pattern is forming on monthly chart.
Deeply oversold daily studies may prompt a partial profit-taking at the end of the week, with upticks to mark positioning for fresh push lower.
Broken 200DMA reverted to initial resistance (191.74), followed by broken Fibo 50% support (193.42) and daily cloud base (196.83), which should cap stronger bounce and keep bears in play.
Targets lay at 185.66 (Fibo 76.4% of 178.73/208.11) and 183.56 (weekly cloud top).
Res: 189.95; 191.74; 193.42; 196.83.
Sup: 188.99; 187.95; 185.66; 183.56.
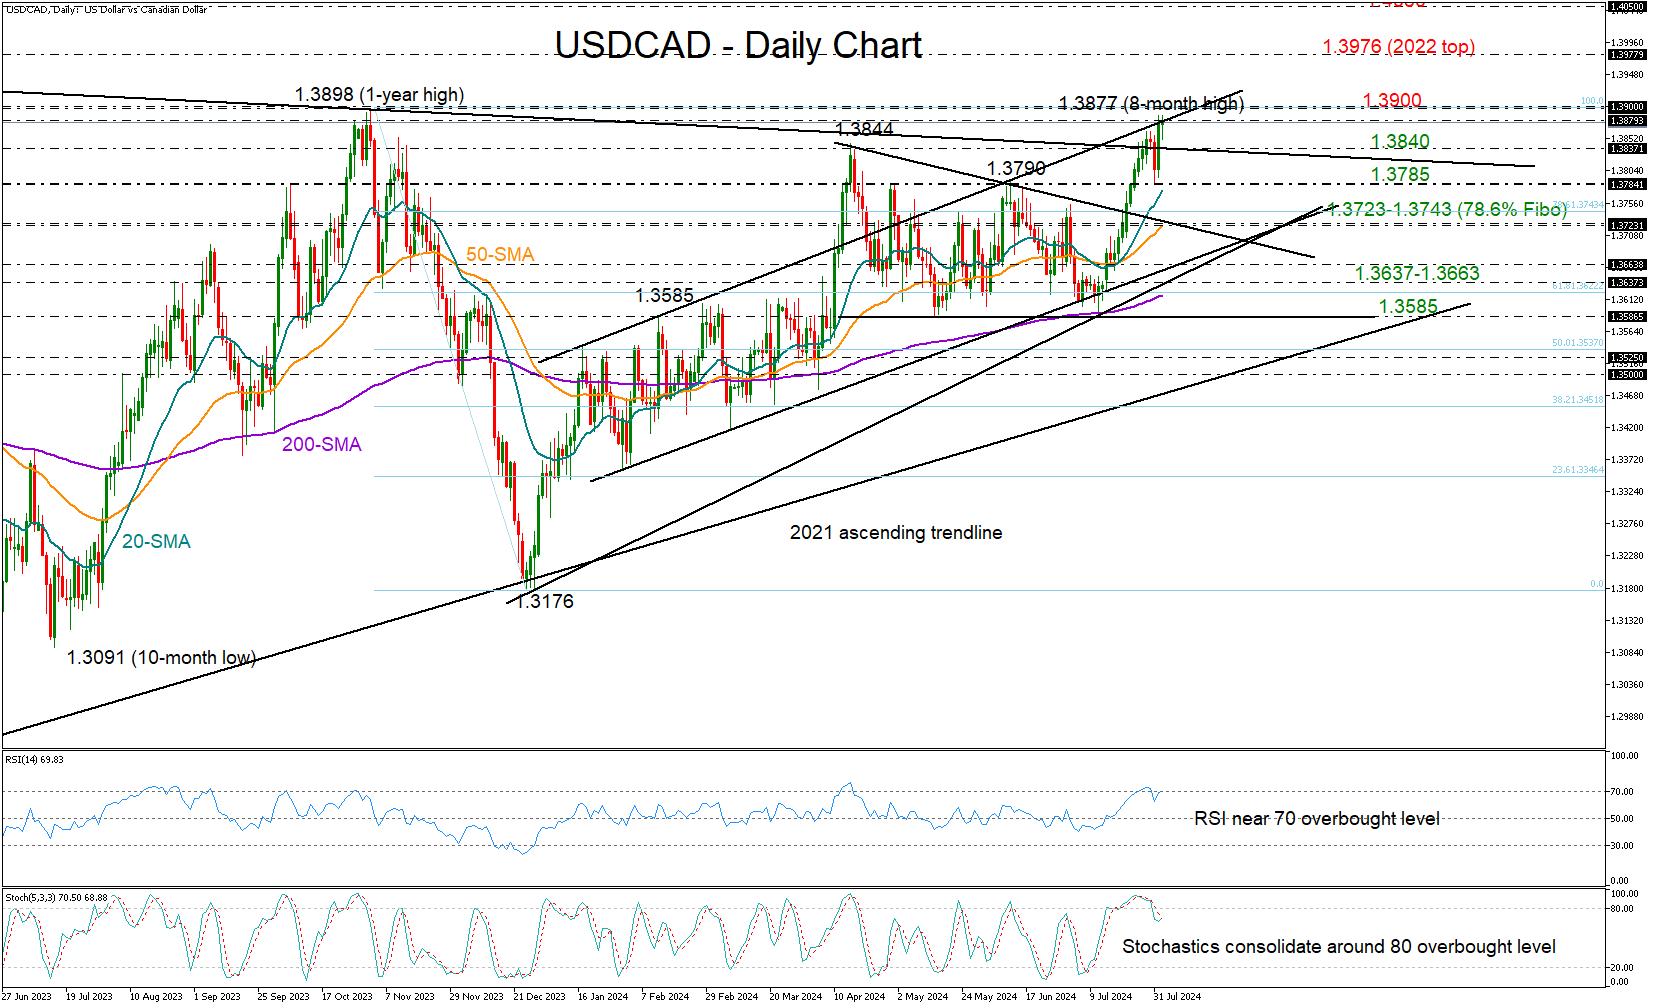
USDCAD Hits 8-Month High, But It’s Not a Victory Yet
- USDCAD marks new higher high after disappointing ISM manufacturing PMI
- A close above 1.3880-1.3900 is needed to postpone profit-taking
- US nonfarm payrolls eagerly awaited at 12:30 GMT
USDCAD began the month on a positive note, swiftly recovering from its recent setback and reaching an eight-month high of 1.3877, slightly above April’s peak of 1.3844.
The pair has been in a bull run since bottoming twice near May’s floor of 1.3588 and around the 200-day exponential moving average (EMA) on July 11, but the recent comeback was not powerful enough to achieve a close above January’s resistance line yesterday. Given the weakening momentum in the RSI and the stochastic oscillator, which are close to overbought levels, traders might exercise some caution.
On the downside, the falling line, which connects the 2022 and 2023 highs, might provide some footing near 1.3840 ahead of the 1.3785 handle, where the 20-day EMA is converging. A move below the latter could dampen sentiment once the bears cross below the 1.3723-1.3743 constraining territory, which includes the 50-day EMA, and the broken resistance line from April’s peak. Should the bears dominate there, the decline could next stabilize within the 1.3637-1.3663 trendline territory. Note that the 200-day EMA is approaching that region too.
Alternatively, if the bulls successfully close above 1.3880, surpassing the 1.3900 psychological mark as well, all the attention will turn to the 2022 top of 1.3976. Breaching that wall and rallying beyond the 1.4000 round level, where the 161.8% Fibonacci extension of April’s downfall is placed, the price could next challenge the 1.4050 region taken from May 2020.
Overall, if the price fails to rise above 1.3880-1.3900, traders could begin to think about profit-taking as the USDCAD chart keeps trading near a constraining zone after a green wave.