
Sample Category Title
AUD/USD Weekly Report
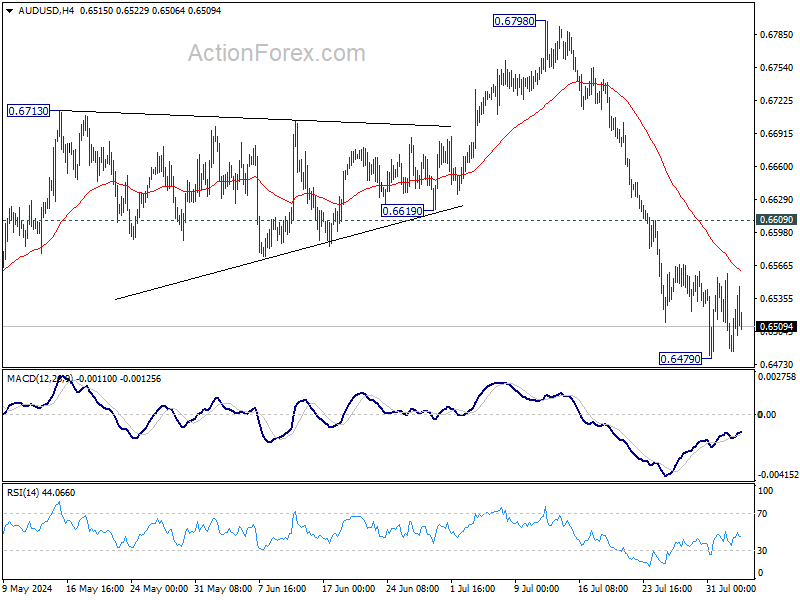
AUD/USD edged lower to 0.6479 last week but turned sideway since then. Initial bias stays neutral this week for some more consolidations. But further decline is expected as long as 0.6609 minor resistance holds. Break of 0.6479 will resume the fall from 0.6798 to 0.6361 support next.
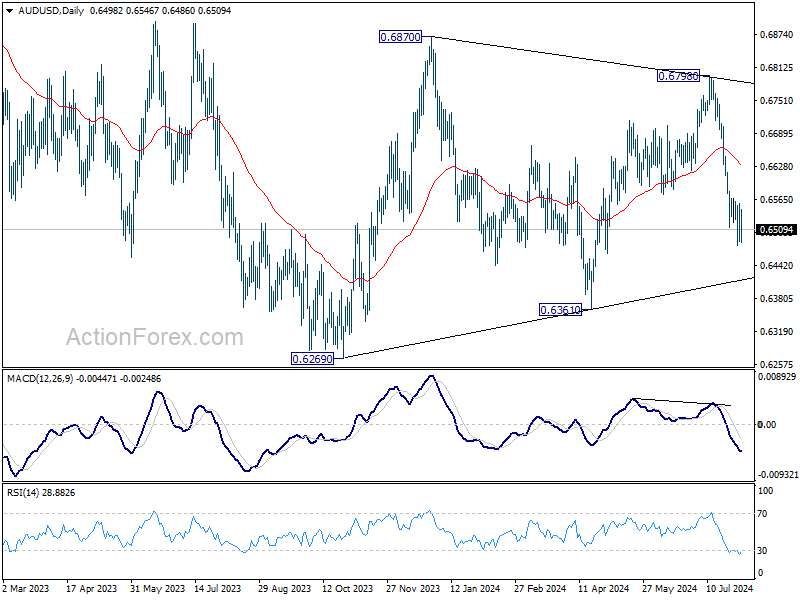
In the bigger picture, overall, price actions from 0.6169 (2022 low) are seen as a medium term corrective pattern, with fall from 0.6798 as another falling leg. Deeper fall could be seen to the lower side of the range between 0.6169/6361. But strong support should be seen there to contain downside. For now, risk will stay on the downside as long as 55 D EMA (now at 0.6633) holds, in case of rebound.
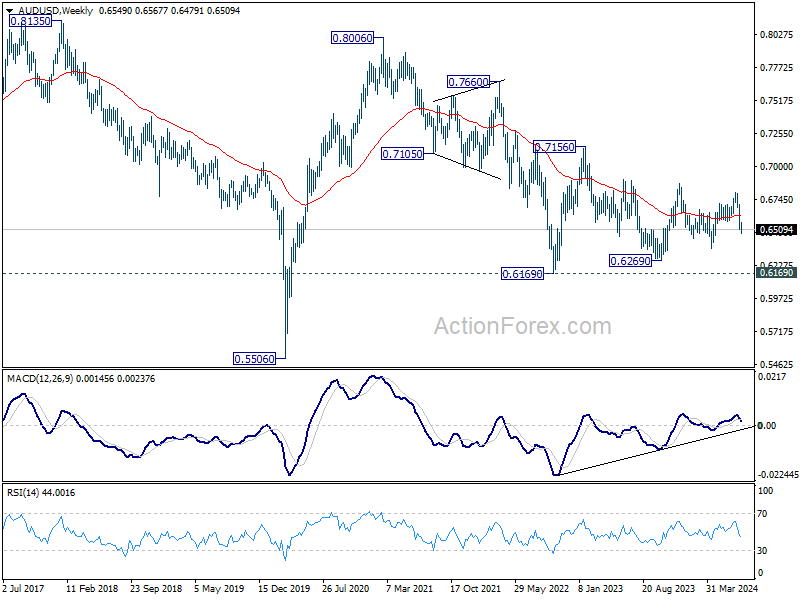
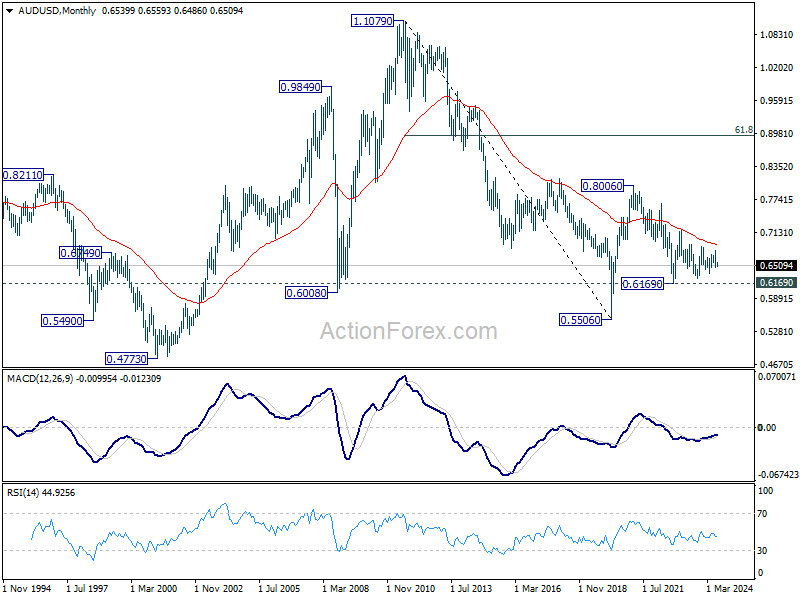
In the long term picture, the down trend from 1.1079 (2011 high) should have completed at 0.5506 (2020 low) already. It's unsure yet whether price actions from 0.5506 are developing into a corrective pattern, or trend reversal. But in either case, fall from 0.8006 is seen as the second leg of the pattern. Hence, in case of deeper decline, strong support should emerge above 0.5506 to bring reversal.
USD/CAD Weekly Outlook
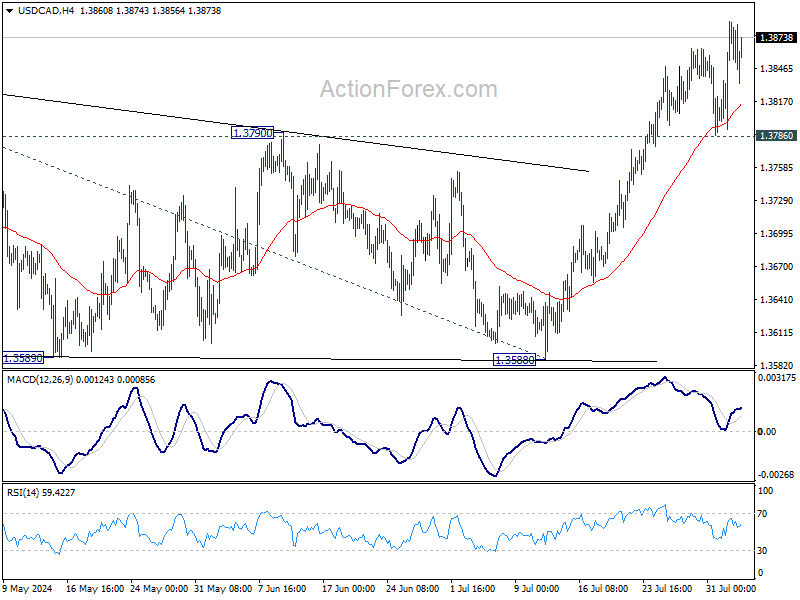
USD/CAD's rise from 1.3176 resumed by breaking through 1.3845 resistance last week. Initial bias stays on the upside this week for 61.8% projection of 1.3176 to 1.3845 from 1.3588 at 1.4025 next. For now break of 1.3786 support is needed to indicate short term topping. Otherwise, outlook will remain bullish in case of retreat.
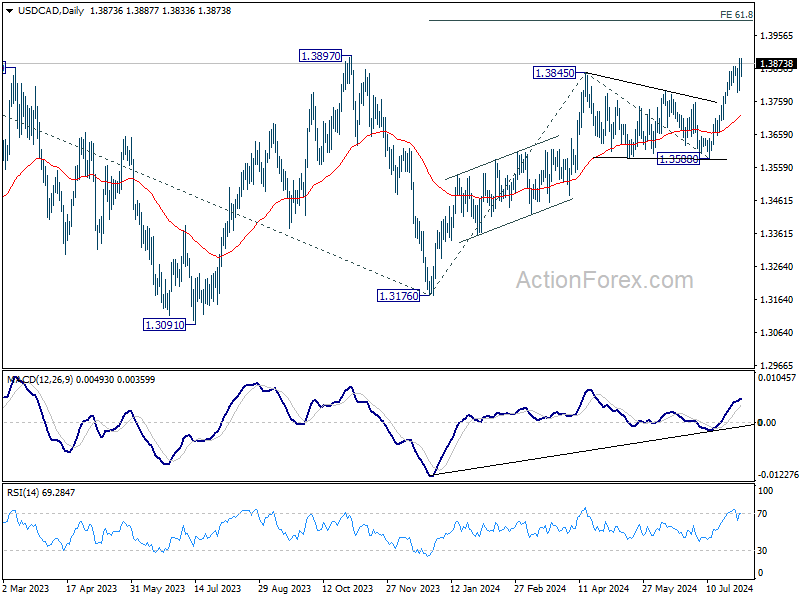
In the bigger picture, price actions from 1.3976 (2022 high) are viewed as a corrective pattern, that might have completed at 1.3176 (2023 low) already. Firm break of 1.3976 will confirm resumption of whole up trend from 1.2005 (2021 low). Next target is 61.8% projection of 1.2401 to 1.3976 from 1.3176 at 1.4149. This will be the favored case as long as 1.3588 support holds, in case of pullback.
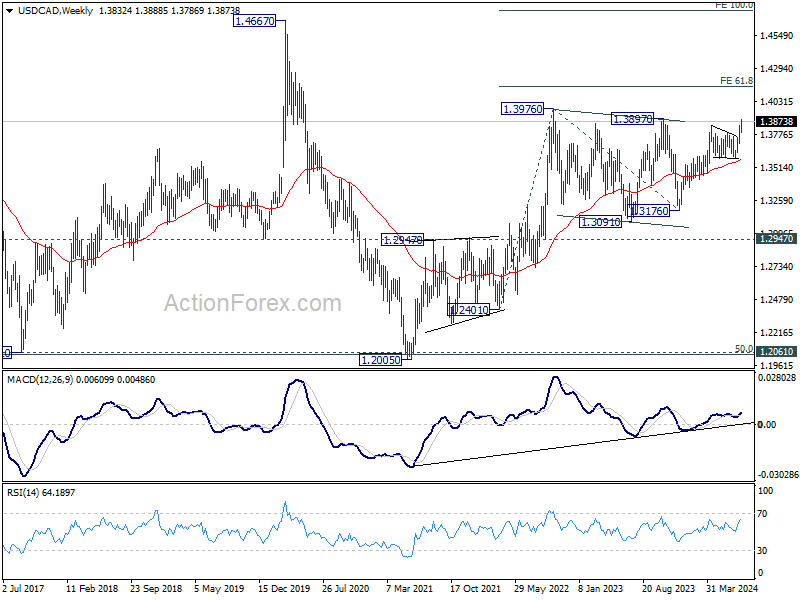
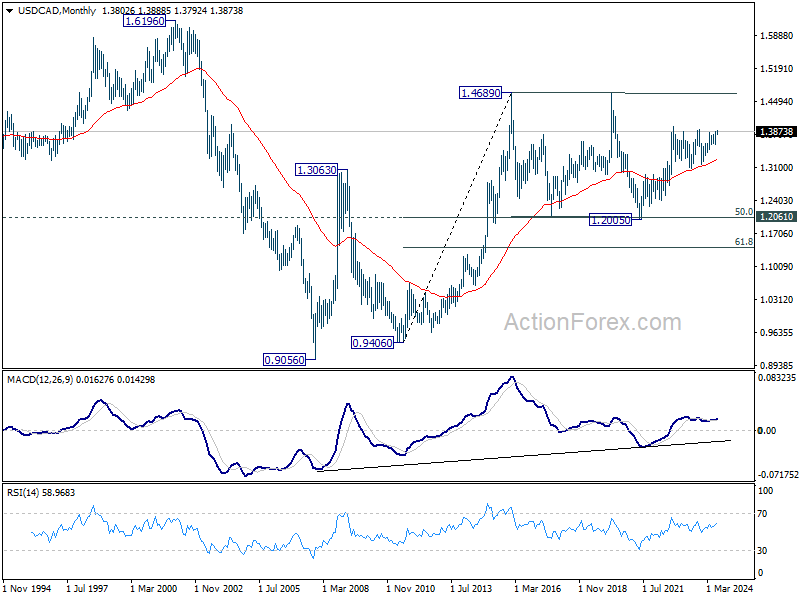
In the longer term picture, price actions from 1.4689 (2016 high) are seen as a consolidation pattern, which might have completed at 1.2005. That is, up trend from 0.9506 (2007 low) is expected to resume at a later stage. This will remain the favored case as long as 1.2947 resistance turned support holds.
GBP/JPY Weekly Outlook
GBP/JPY's fall from 208.09 continued last week and accelerated further. This decline is as correcting the whole rally from 148.93. Initial bias stays on the downside this week for 185.49 fibonacci level. On the upside, above 193.23 minor resistance will turn intraday bias neutral and bring consolidations first, before staging another decline.
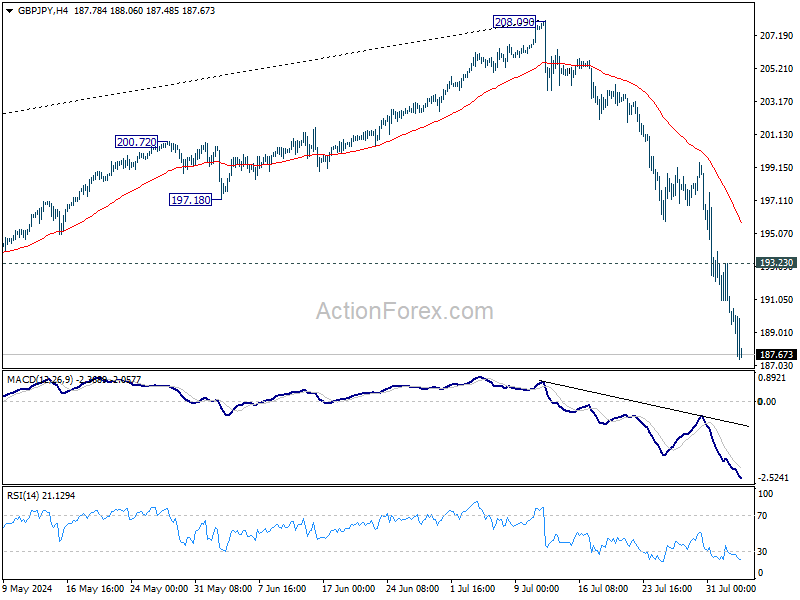
In the bigger picture, fall from 208.09 medium term top is seen as correcting the up trend from 148.93 (2022 low). Further decline should be seen to 38.2% retracement of 148.93 to 208.09 at 185.49. Decisive break there will argue that even larger scale correction is already underway. For now, risk will stay on the downside as long as 55 D EMA (now at 199.44) holds. in case of rebound.
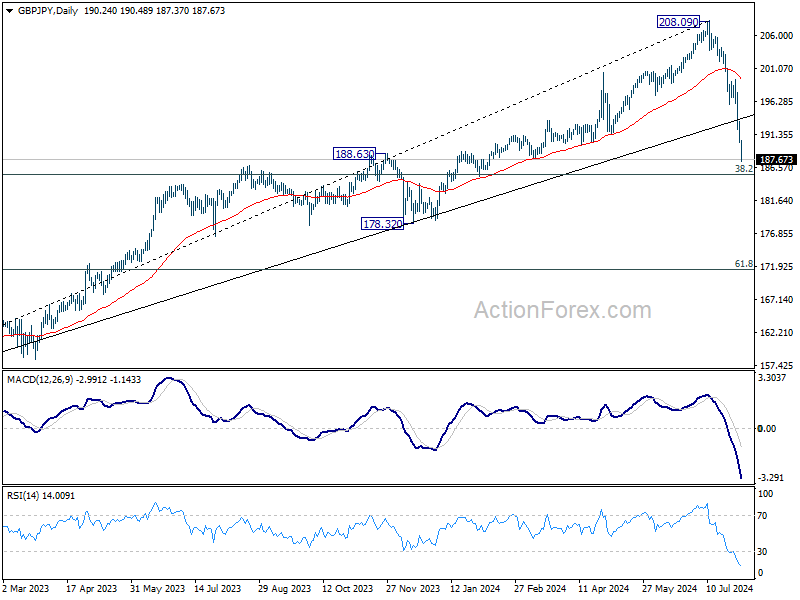
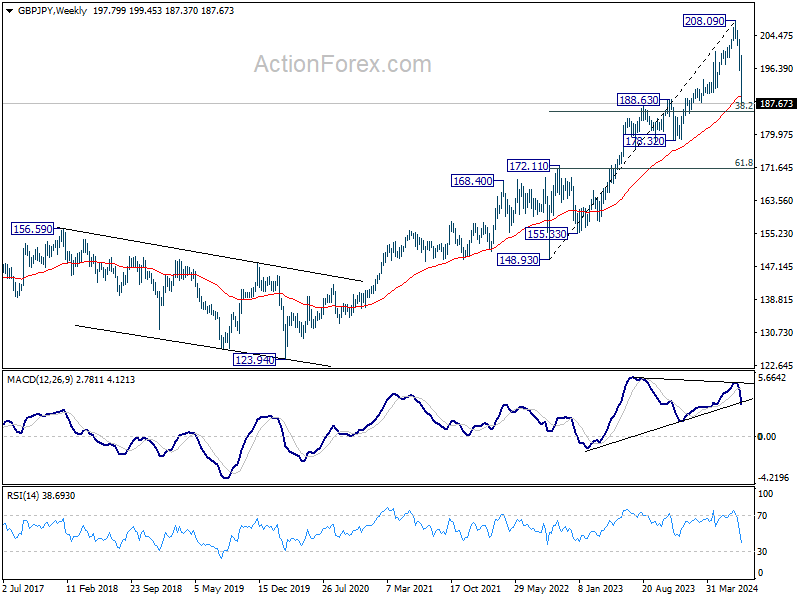
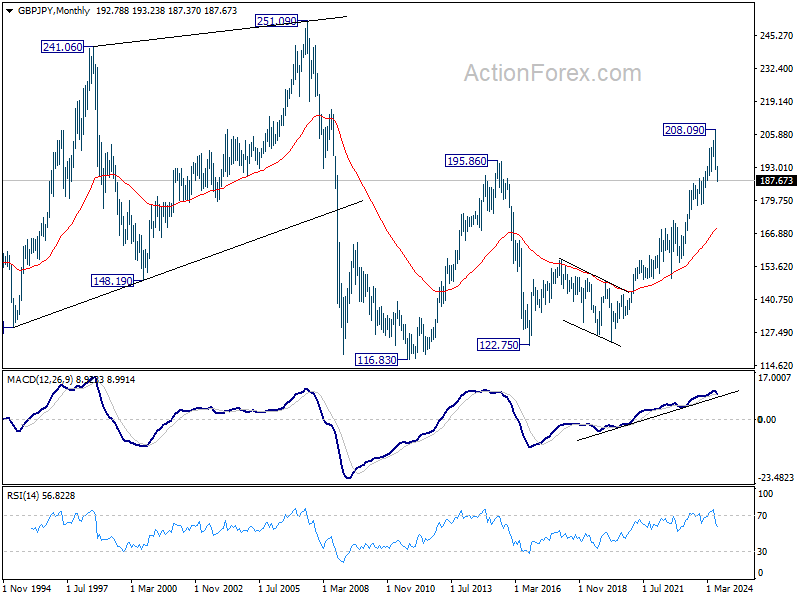
In the longer term picture, considering bearish divergence condition in W MACD, 208.09 is at least a medium term top. It's still early to conclude that the up trend from 122.75 (2016 low) has completed. But it's at least in a medium term corrective phase, with risk of correction to 55 M EMA (now at 169.23).
EUR/JPY Weekly Outlook
EUR/JPY's fall from 175.41 continued last week accelerated further. This decline is now seen as a larger scale correction. Initial bias remains on the downside for 155.91 fibonacci level next. On the upside, above 163.41 minor resistance will turn intraday bias neutral and bring consolidations first, before staging another decline.
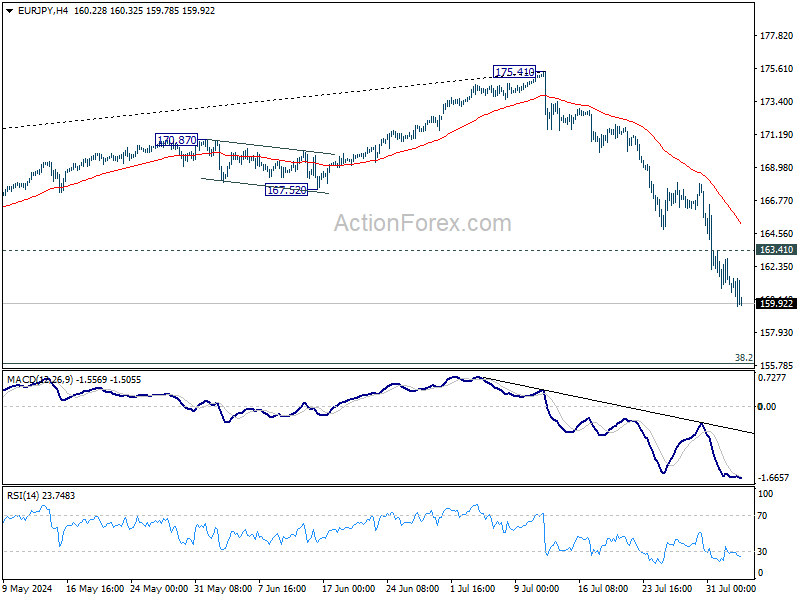
In the bigger picture, break of 164.29 resistance turned support indicates that fall from 175.41 medium term top is at least correcting the rise from 124.73, with risk of bearish trend reversal. Deeper decline would be seen to 38.2% retracement of 124.37 to 175.41 at 155.91. This will now remain the favored case as long as 55 D EMA (now at 168.81) holds, even in case of strong rebound.
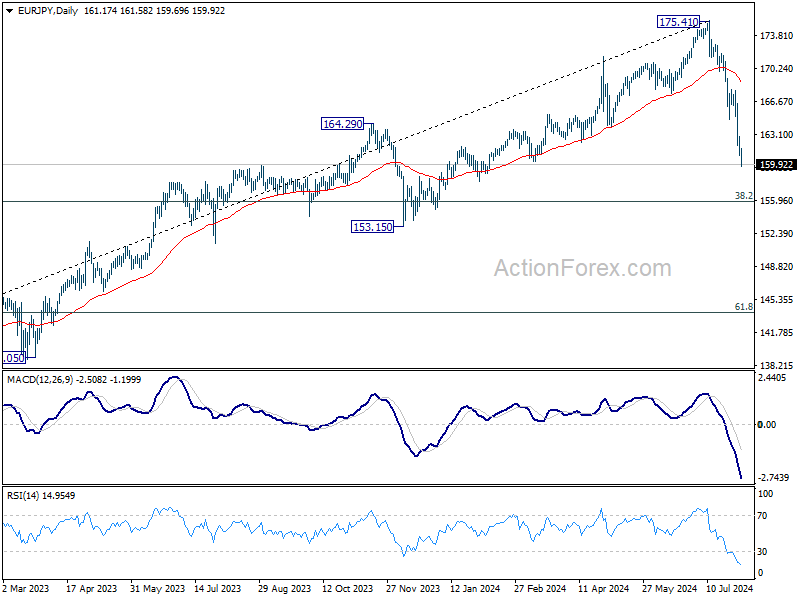
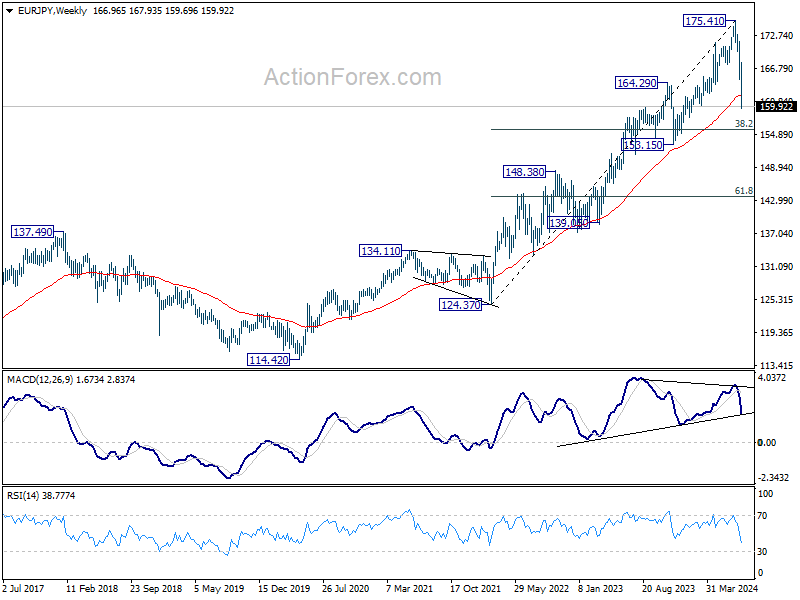
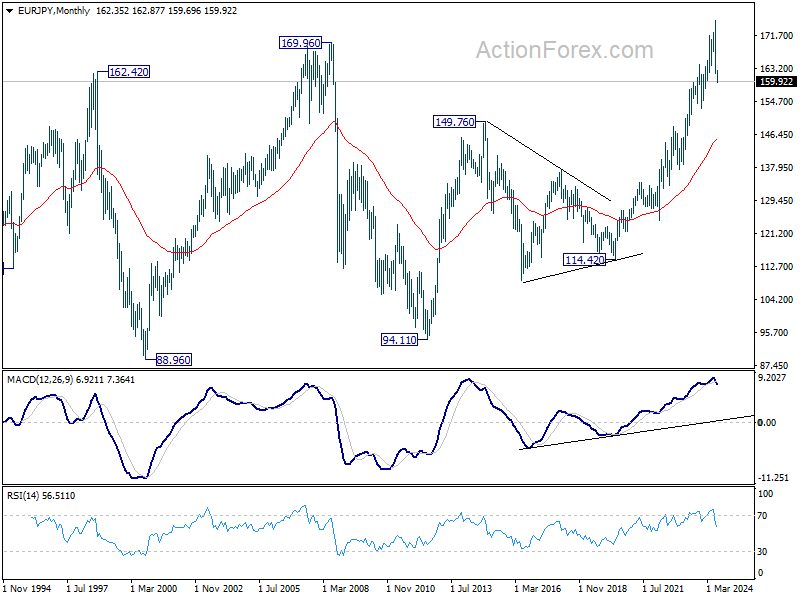
In the long term picture, considering bearish divergence condition in W MACD, 175.41 is at least a medium term top. It's still early to conclude that up trend from 94.11 (2012 low) has completed. But a medium term corrective phase is in progress with risk of deeper fall back to 55 M EMA (now at 145.46).
EUR/GBP Weekly Outlook
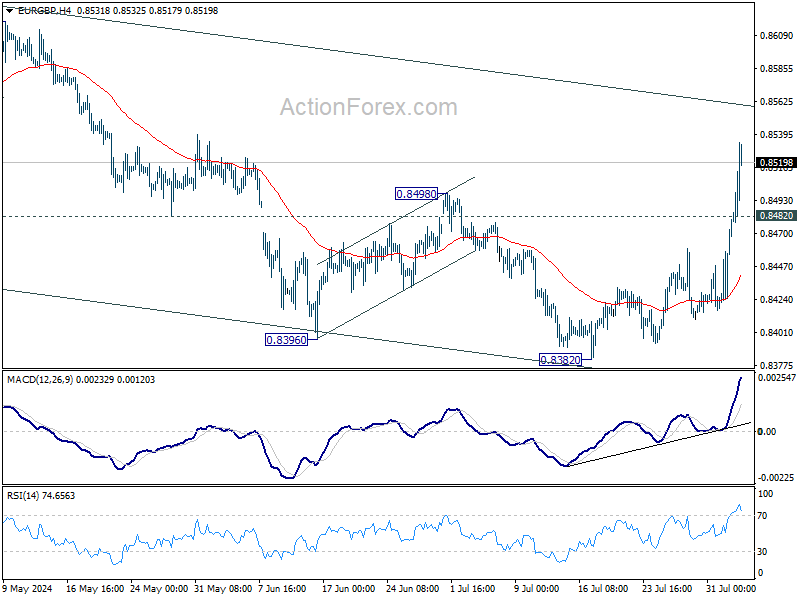
EUR/GBP's rise from 0.8382 accelerated higher last week and the strong break of 0.8498 resistance argues that fall form 0.8643 has completed with five waves down to 0.8382. Initial bias stays on the upside this week for channel resistance (now at (now at 0.8560). Sustained break there will raise the chance of larger bullish trend reversal and target 0.8643 resistance next. On the downside, below 0.8482 minor support will turn intraday bias neutral first.
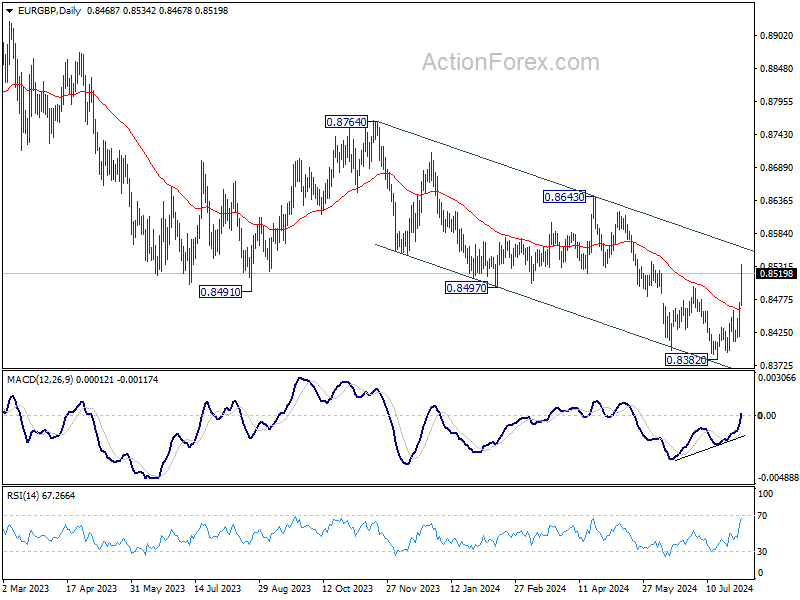
In the bigger picture, while the rebound from 0.8382 is strong, there is no confirmation of trend reversal yet. As long as 0.8643 resistance holds, down trend from 0.9267 could still resume through 0.8382 at a later stage. However, firm break of 0.8643 will indicate that such down trend has completed, and turn outlook bullish.
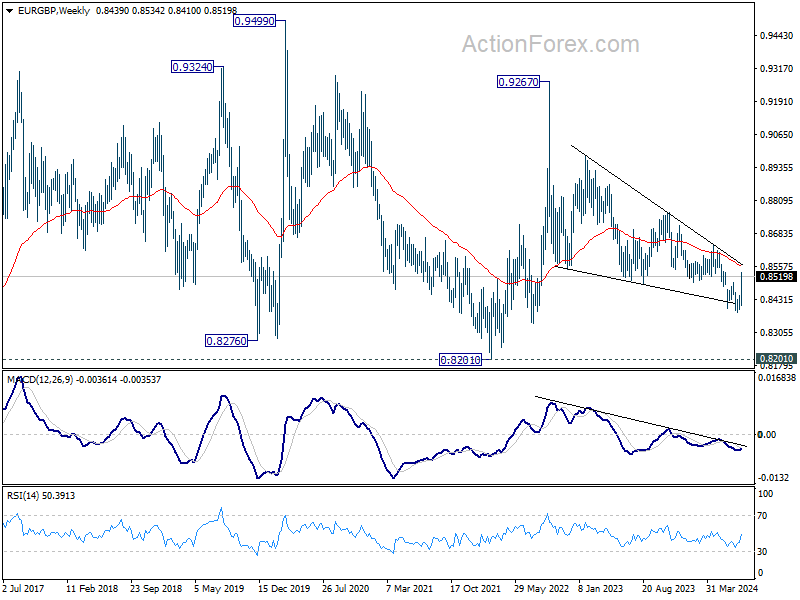
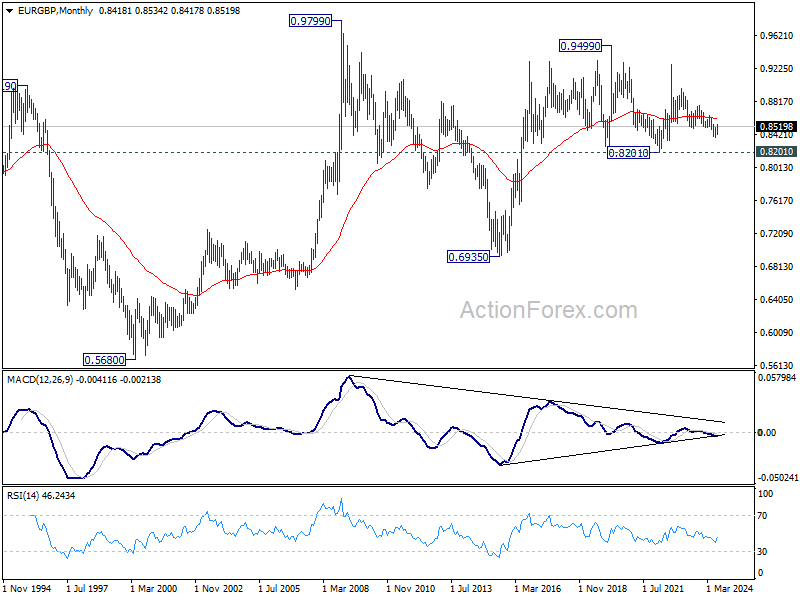
In the long term picture, price action from 0.9499 (2020 high) is seen as part of the long term range pattern from 0.9799 (2008 high). Range trading should continue between 0.8201 and 0.9499, until there is clear signal of imminent breakout.
EUR/AUD Weekly Outlook
EUR/AUD's rise from 1.5996 extended through 1.6742 resistance last week despite interim pullback. The development strengthens the case that corrective fall from 1.7062 has completed with three waves down to 1.5998. Initial bias is on the upside this week for retesting 1.7062 high. On the downside, break of 1.6474 support is needed to indicate short term topping. Otherwise, outlook will remain bullish in case of retreat.
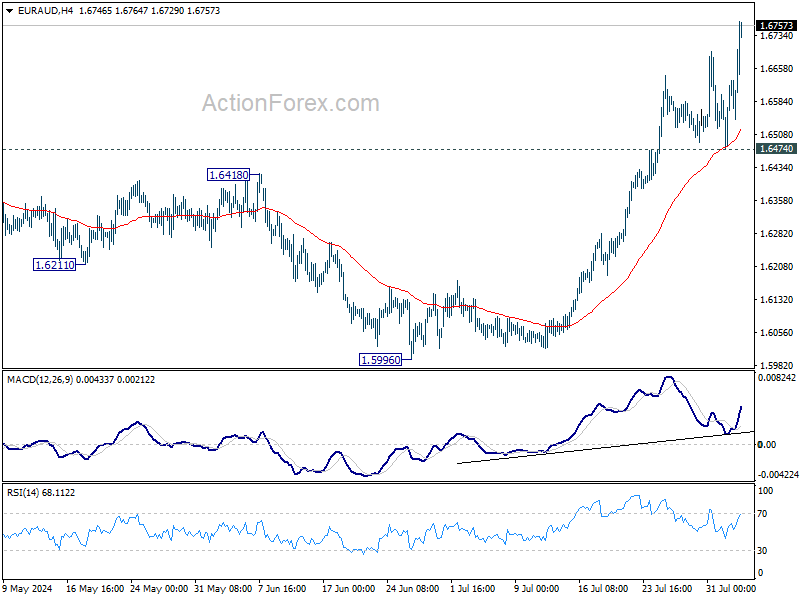
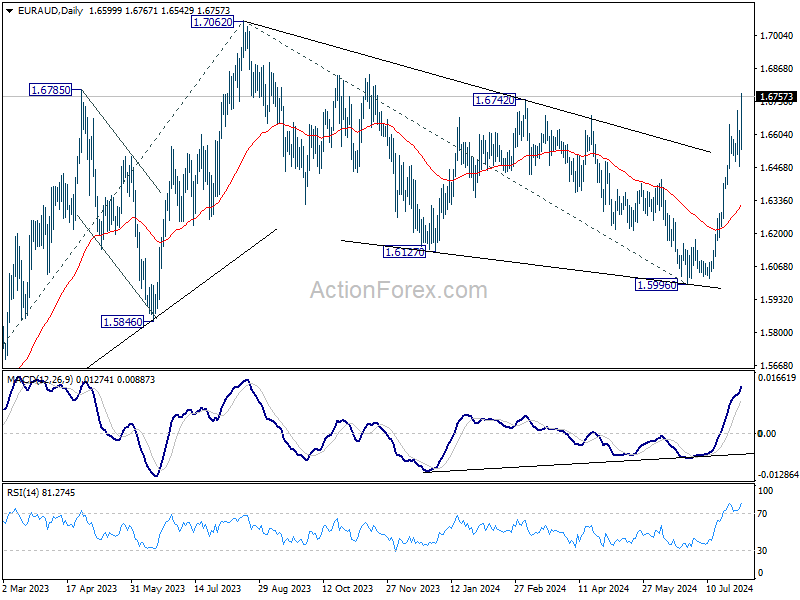
In the bigger picture, fall from 1.7062 medium term top is seen as a correction to the up trend from 1.4281 (2022 low) and could have completed after hitting 38.2% retracement of 1.4281 to 1.7062 at 1.6000. On resumption next target will be 61.8% projection of 1.4281 to 1.7062 from 1.5996 at 1.7715. This will now remain the favored case as long as 1.6474 support holds.
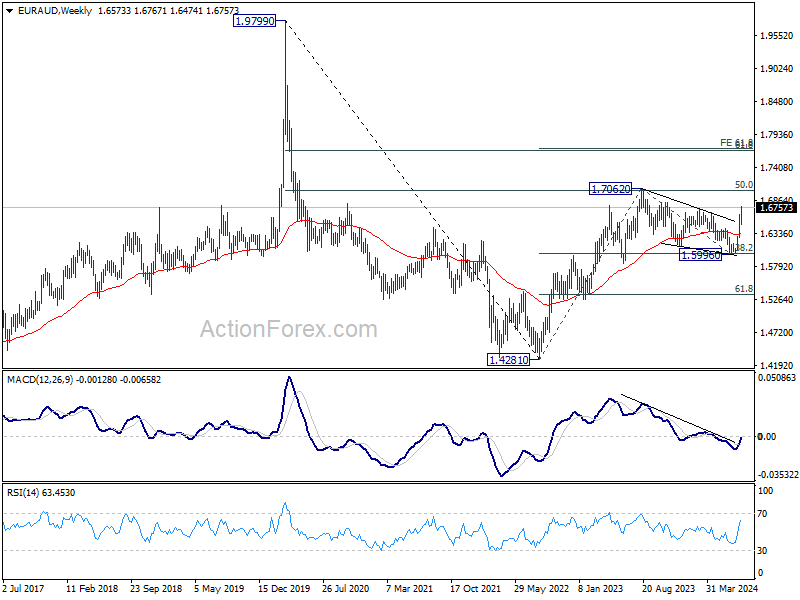
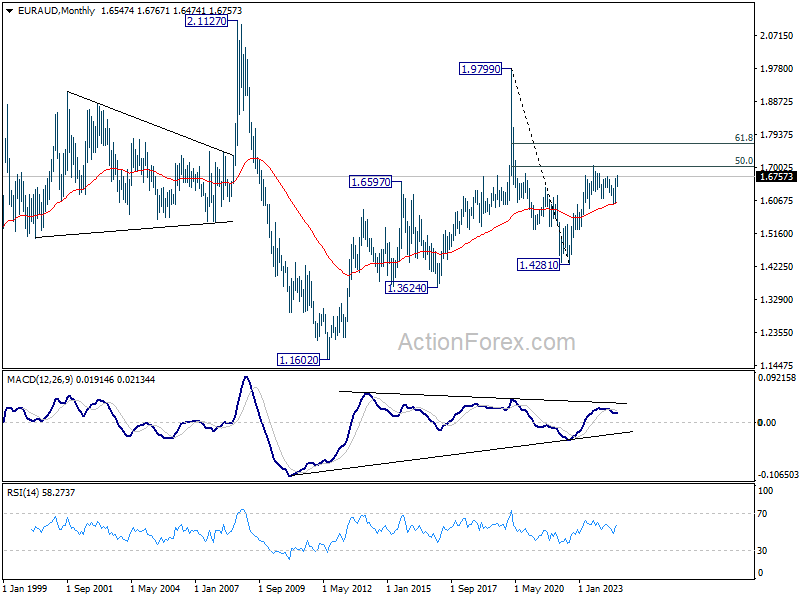
In the longer term picture, price actions from 1.9799 (2020 high) are seen as a long term decline at the same scale as the rise from 1.1602 (2012 low). Rebound from 1.4281 is seen as the second leg. As long as 55 M EMA (now at 1.5987) holds, this second leg could still extend higher. However, sustained trading below 55 M EMA will open up the bearish case for extending the decline through 1.4281 low.
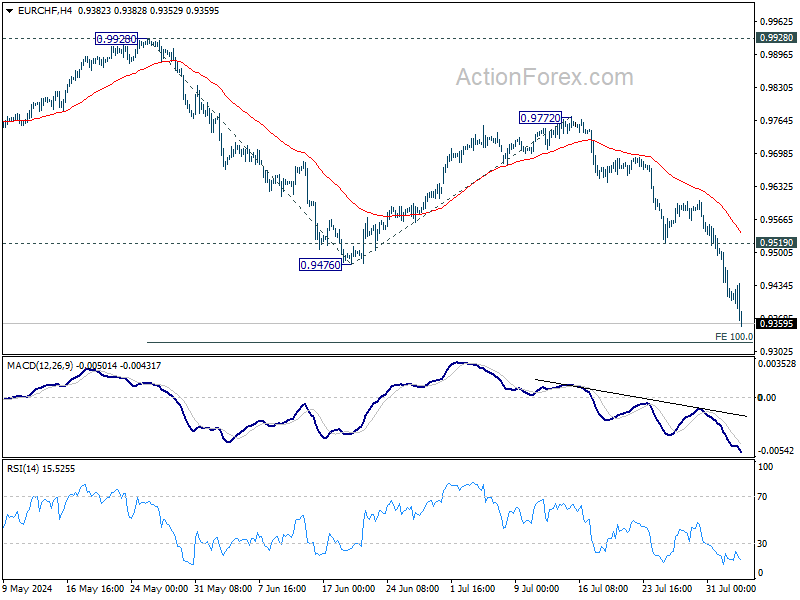
EUR/CHF Weekly Outlook
EUR/CHF's decline form 0.9928 resumed last week and accelerated to as low as 0.9352. Initial bias remains on the downside this week for 100% projection of 0.9928 to 0.94767 from 0.9772 at 0.9320.Strong support could emerge above 0.9252 low to bring rebound. But near term outlook will now stay bearish as long as 0.9519 support turned resistance holds, in case of recovery.
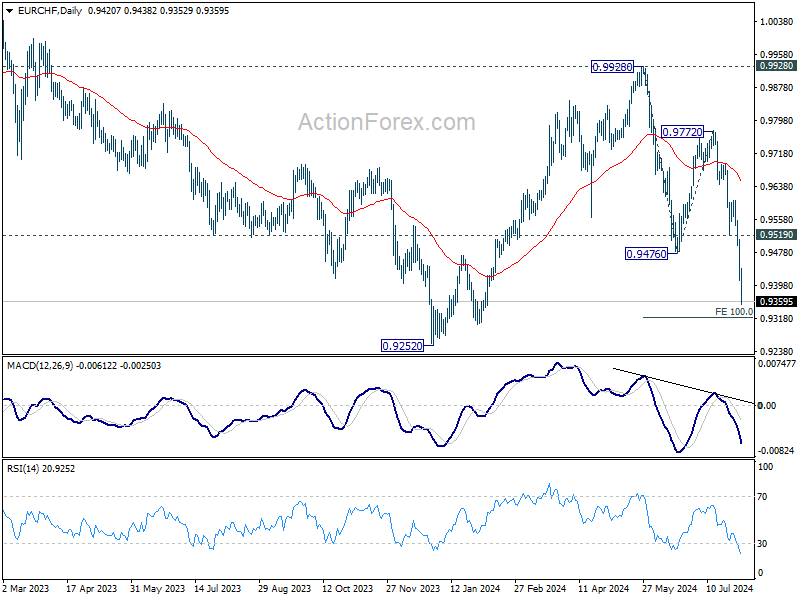
In the bigger picture, current downside acceleration argues that medium term corrective pattern from 0.9407 (2022 low) might have completed with three waves to 0.9928. Decisive break of 0.9252 (2023 low) will confirm long term down trend resumption. Next target will be 61.8% projection of 1.1149 to 0.9407 from 0.9928 at 0.8851. For now, outlook will stay bearish as long as 0.9928 resistance holds, even in case of strong rebound.
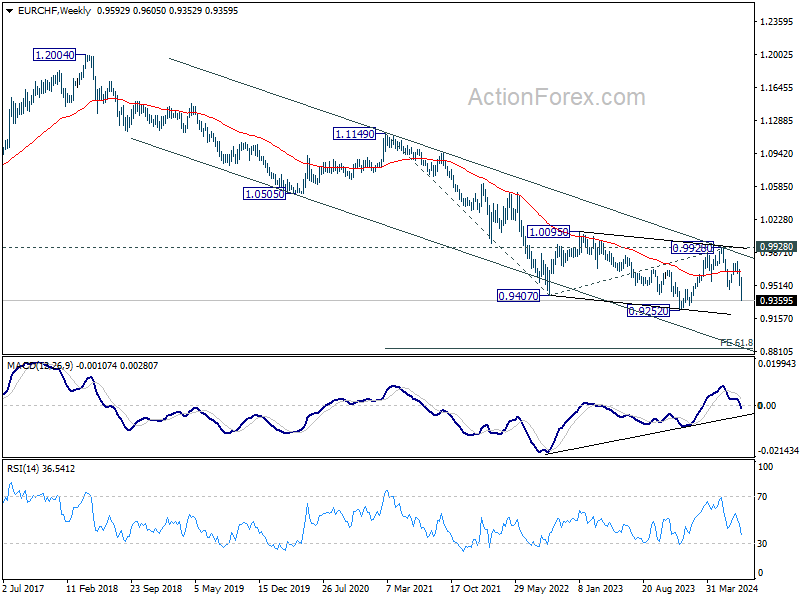
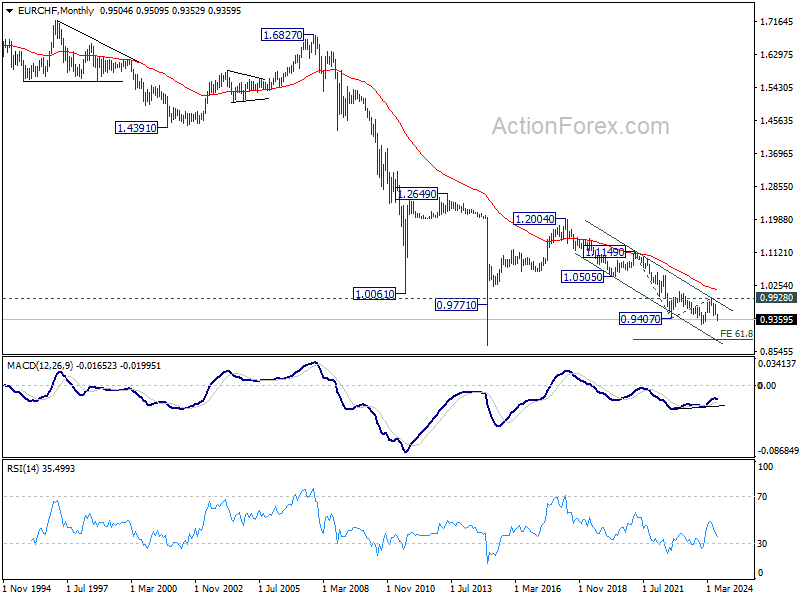
In the long term picture, fall from 1.2004 (2018 high) is part of the multi-decade down trend. Firm break of 0.9928 resistance is needed to be the first sign of long term bottoming. Otherwise, outlook will remain bearish.
Markets Weekly Outlook – Rising US Job Fears, Geopolitics in the Spotlight
- US jobs data underwhelmed, triggering the SAHM rule, signaling a likely recession.
- The Magnificent 7 tech companies have lost nearly $1.75 trillion in market capitalization over the past 10 days.
- Rate cut bets for the US face significant revisions with recessionary fears weighing on global markets.
- Reserve Bank of Australia (RBA) next week. Will the RBA deliver a dovish pivot.
Week in Review: US Unemployment Rate Triggers Recession Fears
US jobs data underwhelmed on Friday triggering the SAHM rule, which is used to identify the start of a recession based on changes in the unemployment rate.
Named after economist Claudia Sahm, the SAHM rule specifies that a recession is likely underway if the three-month moving average of the national unemployment rate rises by 0.5 percentage points or more relative to its lowest point in the previous 12 months. This metric is designed to provide an early and reliable signal of economic downturns, enabling policymakers to respond more swiftly.
As you can see from the chart below, the July unemployment rate has seen the SAHM rule triggered hinting that the US is already in a recession with a print of 0.53.
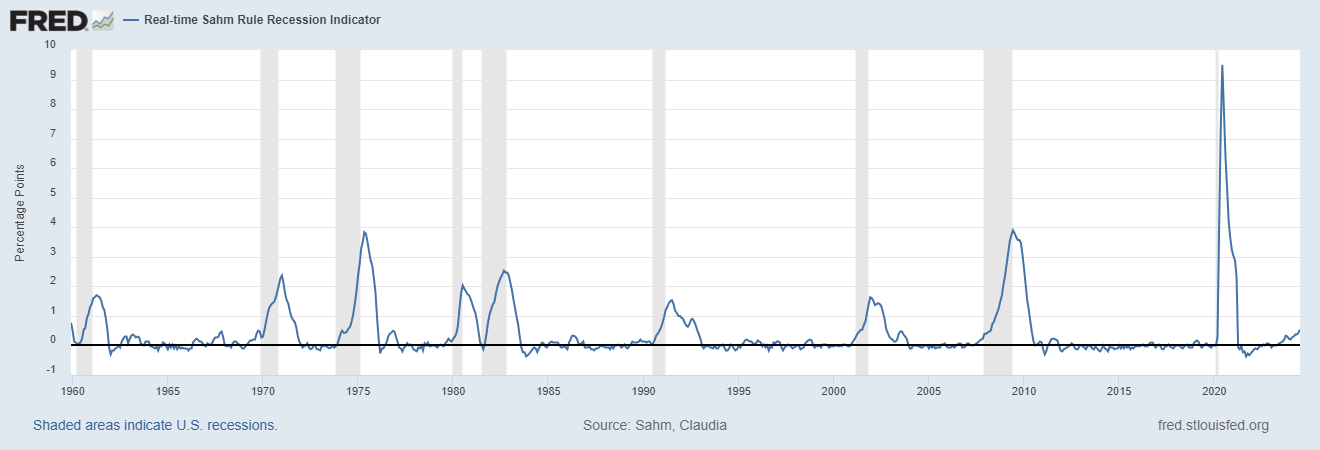
Source: Federal Reserve Bank of St. Louis.
The unemployment rate rose to 4.3% while the NFP print missed estimates, coming in at a measly 114k with a downward revision of around 29k for the past two months. By my calculation we have now had downward revisions in 5 of the last 6 job reports with unemployment at a 3 year high.
The impact of which has seen rate cut bets for the US face significant revisions with recessionary fears weighing on global markets. Market participants are now pricing in a 71.5% chance of a 50bps rate cut in September with further cuts at the November and December. The data accelerated the early week selloff in US Equities, with both the S&P 500 and Nasdaq 100 deep in the red for the day (at the time of writing.)
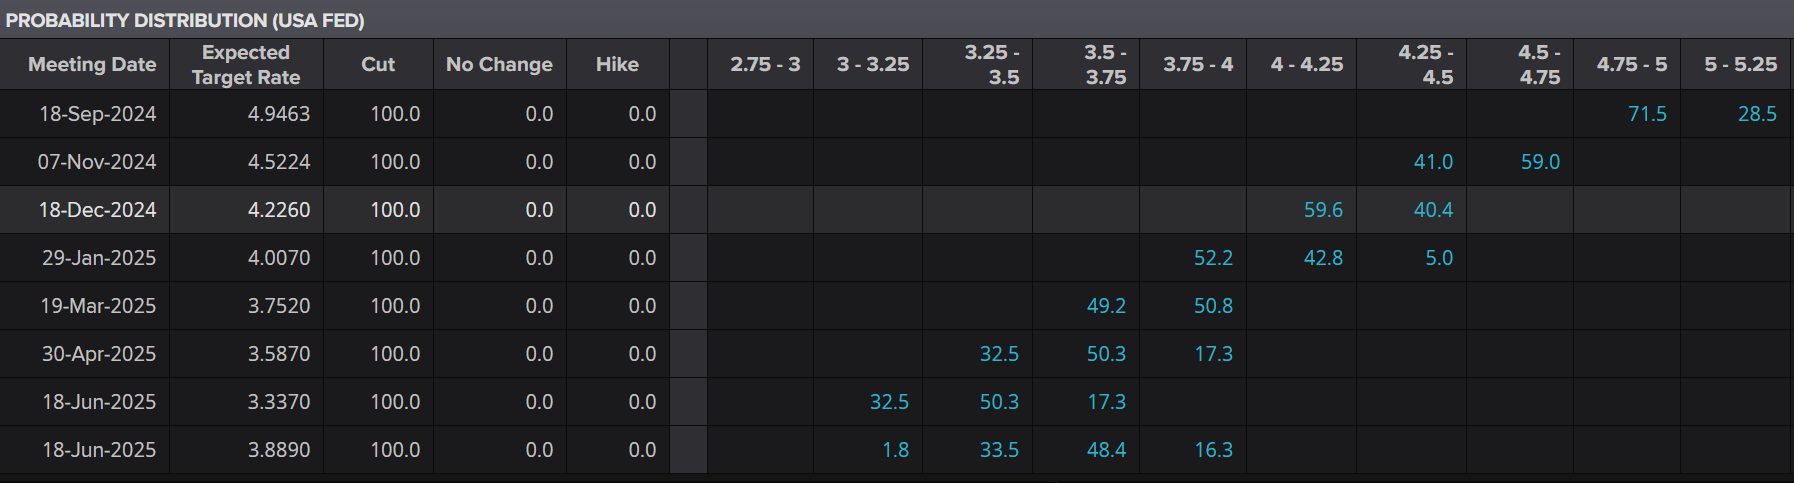
Source: LSEG
For context, the Magnificent 7 (Apple, Microsoft, Alphabet, Amazon, Nvidia, Tesla, and Meta) have collectively shed nearly $1.75 trillion in market capitalization over the past 10 days. To put that in perspective, this loss is almost 50% of Apple’s total market cap, the world’s largest company. On Wednesday alone, they experienced their biggest daily loss in history, totaling $750 billion.
On the FX front, the US Dollar finally broke below support at the 104.00 level, trading around 103.100 at the time of writing. This allowed the EUR and GBP to recoup some of their early-week losses against the greenback, finishing the week on a high note.
Commodities had a mixed day, with gold surging sharply toward the $2480/oz level following the jobs data, only to experience a significant selloff as the US session progressed. This rally was likely driven by substantial profit-taking ahead of the weekend. With the potential for escalating tensions in the Middle East, market participants may have been reluctant to hold significant positions over the weekend.
Overall, it was not the best week for markets, with mega-cap tech shares among the biggest losers along with the US dollar. It appears that market participants correctly anticipated rate cuts, while the Fed may be slower to act on reducing rates.
The Week Ahead: Rising Recessionary Fears, Geopolitics and Asia Pacific Data
The upcoming week promises to be intriguing given the recent developments. The weekend could bring additional complications if there are signs of escalating tensions in the Middle East. Such indications may boost the appeal of safe havens, potentially creating gaps in the US Dollar Index and gold prices.
Recessionary fears combined with a broader regional conflict could be key market drivers, especially with limited data releases from both the EU and the US next week. The primary data releases will come from the Asia Pacific region.
Asia Pacific Markets
In Asia, the week will start with the release of the Caixin Services PMI in China on Monday before the focus shifts to Australia. On Tuesday, the Reserve Bank of Australia (RBA) meeting takes center stage, particularly since the Australian central bank has been considering rate hikes at its previous two meetings.
Following this week’s rate decisions by the Bank of Japan (BoJ) and the Bank of England (BoE), market participants will be closely monitoring the RBA meeting. The possibility of a dovish pivot by the RBA remains a prominent topic of discussion.
Although the BoJ summary of opinions may not typically be a major economic release, it is expected to garner more attention than usual following the recent rate hike by the BoJ. Market participants will be eager to hear any plans for further hikes or insights into the BoJ’s expected future policy path.
Europe + UK + US
Looking ahead to the Euro Area, the US, and the UK, the economic calendar is relatively sparse. Markets are likely to focus on any hints from Fed policymakers following the recent series of weak data releases.
In the absence of high-impact data, geopolitical tensions are expected to be a significant factor influencing markets next week.
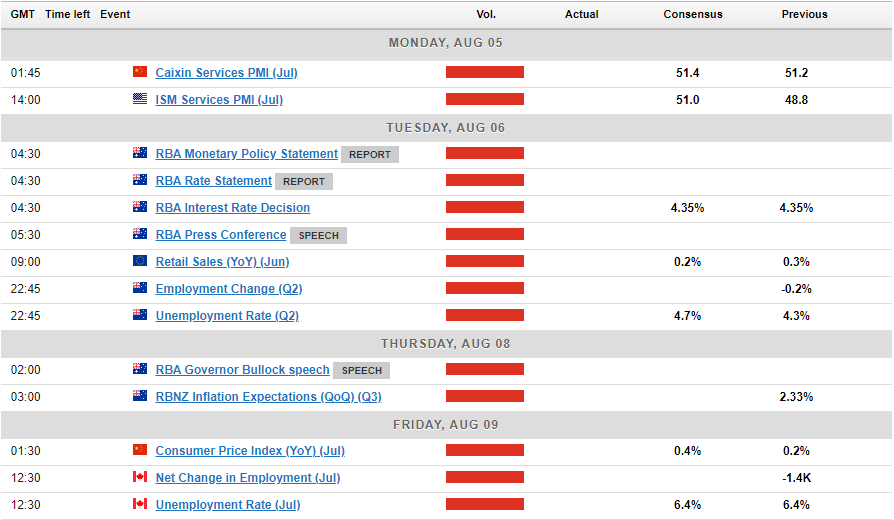
Chart of the Week
The chart of the week that I will be focusing on is the US Dollar Index (DXY). Following weak data prints and adjustments to rate cut expectations, next week could be crucial for the DXY.
Currently, the DXY is hovering just above a key support level at 103.00, with additional support around 102.64. A break below this could potentially lead to a retest of the psychological 100.00 level.
On the upside, any recovery attempt faces resistance around 103.50, followed by the 200-day moving average (MA) at 104.29. The 100-day MA is positioned just below the key psychological level of 105.00.
US Dollar Index (DXY) Daily Chart – June 28, 2024
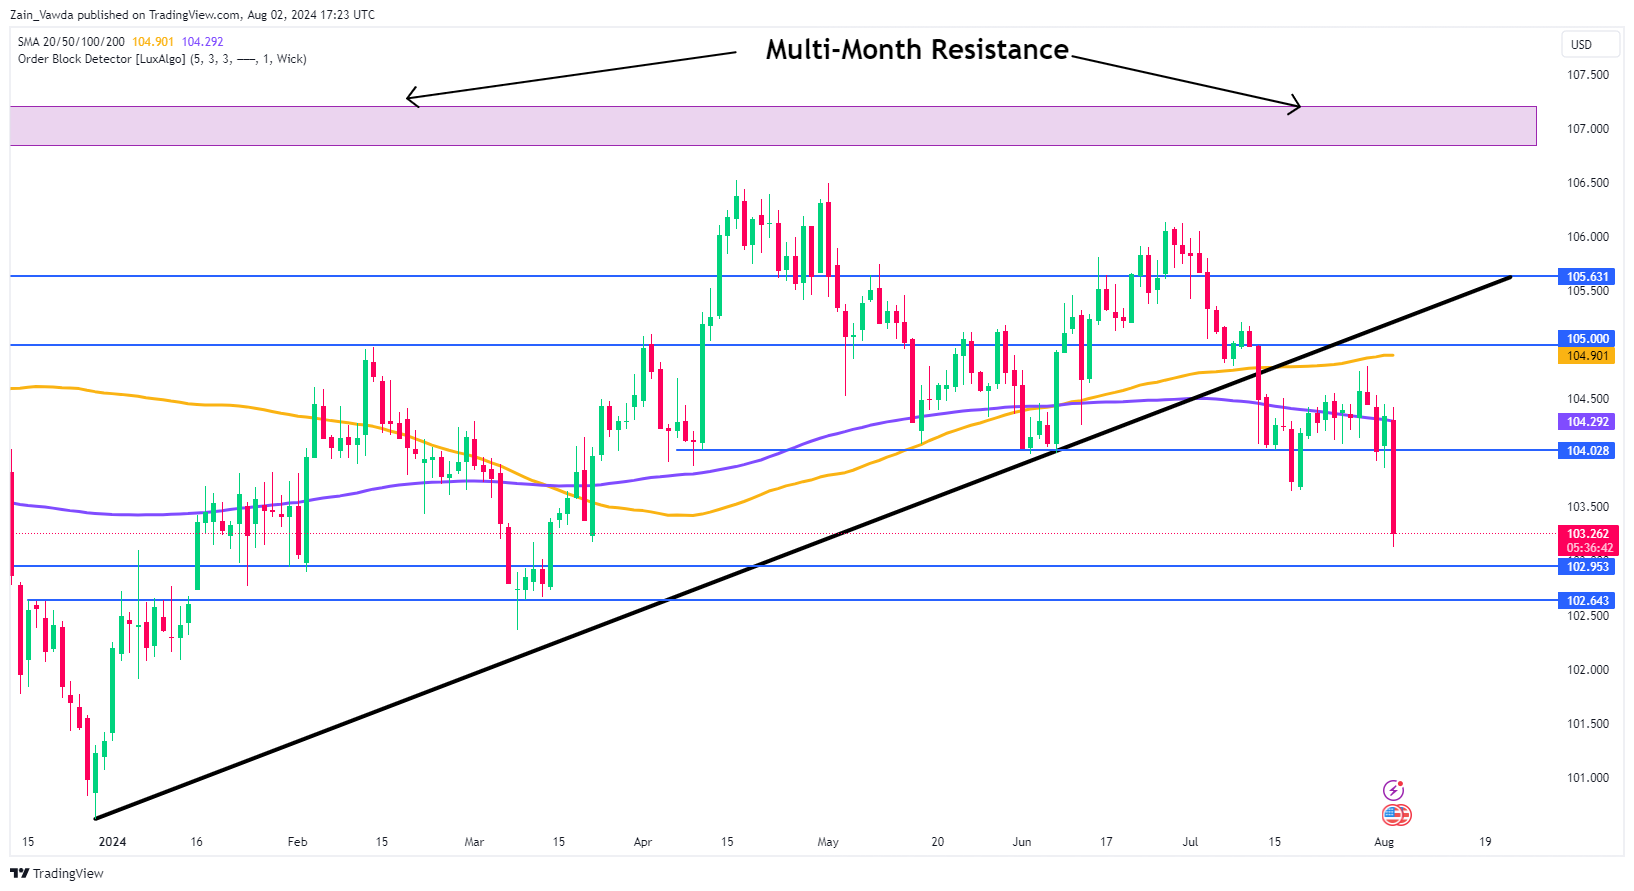
Source:TradingView.Com (click to enlarge)
Key Levels to Consider:
Support:
- 103.00
- 102.64
- 101.50
Resistance:
- 103.50
- 104.29
- 105.00
The Weekly Bottom Line: It’s A Different World
U.S. Highlights
- Nonfarm payroll gains came in lower than expected in July, with the unemployment rate heading higher. The numbers add to other data suggesting that the U.S. labor market is losing steam.
- While the Federal Reserve held rates steady at their July meeting as widely expected, Chair Powell gave the strongest indication yet that a September rate cut is on the table.
- The manufacturing sector continued to struggle, as the ISM manufacturing index remained in contraction territory.
Canadian Highlights
- This week’s market action was influenced by events south of the border. The Fed decision and weak U.S. jobs report lead Canada’s 10-year and 5-year government bond yields more than 30 basis points lower.
- The key Canadian economic report, monthly GDP by industry, exceeded expectations and solidified stronger-than-expected growth in the second quarter.
- Looking ahead to next week’s jobs report, the Bank will likely be focused on the degree of slack in the labour market as they calibrate the pace of interest rate cuts.
U.S. – It’s A Different World
The main highlights of the week were developments in the labor market and a mid-week update from the Federal Reserve. Several reports showed that conditions in the labor market were cooling, while the Fed largely lived up to expectations by holding rates steady. Their signals about a possible cut at the September meeting were generally of more interest to markets. In response to the September signal, stock markets rallied, and bond yields pulled back. This morning’s jobs number was even more of a market mover, with 10-year yields down 13 basis points relative to yesterday’s close.
What a difference a year makes. The U.S. economy today, with annualized growth slowing from about 4% towards a more trend-like 2%, inflation down and unemployment ticking up, looks starkly unlike it did a year ago according to Fed Chair Powell. After issuing a statement keeping the policy rate unchanged, at his press conference, Powell noted that last year, it was a completely different economy with higher inflation and a robust job market. Now, he notes, on the employment front, indicators show the job market has gradually normalized from “overheated” conditions and the Fed is able to weigh prices and the labor market more equally as inflation has cooled.
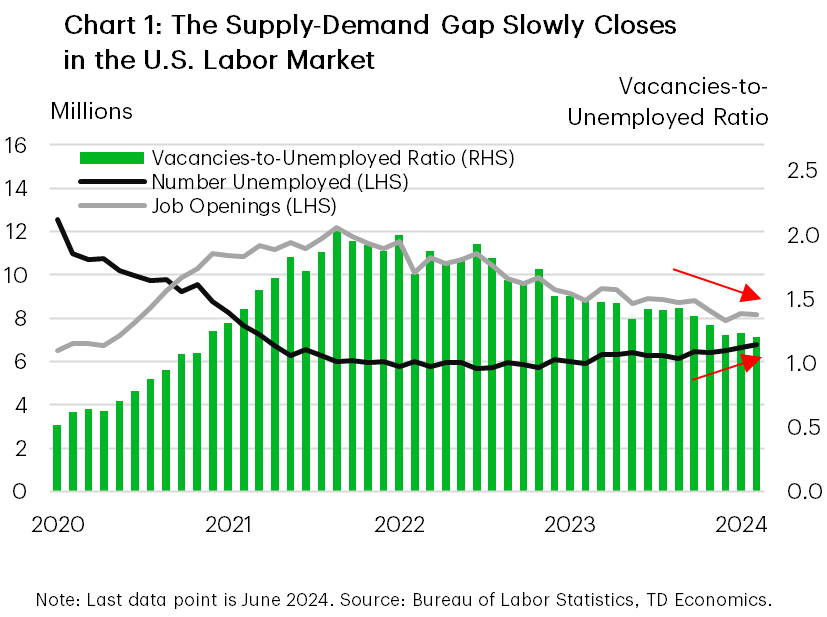
Reports out this week supported his statements on the job market. First up, the more backward-looking JOLTS data showed that the number of job openings in June inched down relative to May. While there are still plenty of jobs available relative to the more than 6.8 million unemployed job seekers in June — the gap has narrowed with the vacancies-to-unemployed ratio falling relative to its value in May (Chart 1). Other elements of the report also supported a softening labor market narrative – the hires rate ticked down and the quits rate was unchanged from May’s downwardly revised 2.1% (which is below where it was immediately prior to the pandemic). Additionally, the Employment Cost Index (ECI) report, which the Fed watches closely for wage trends, slowed at a faster-than-expected pace in Q2.
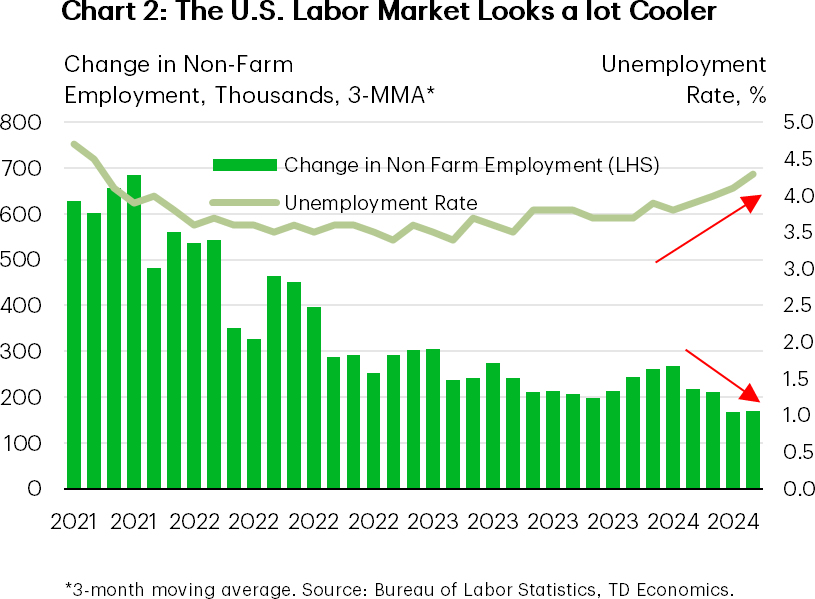
The signal from the more recent July payrolls report was generally in line with the JOLTS and ECI data. The economy added 114k jobs in July, missing expectations (Chart 2). The unemployment rate rose for the fourth consecutive month and annual wage growth decelerated to the slowest pace in over three years. Together, the three employment reports suggest that demand for workers continued to slow and add further evidence that the labor market is cooling.
On the production side, the ISM Manufacturing Index declined again in June. The series fell 1.7 points to 46.8, marking its fourth consecutive month in contraction territory after a short-lived reprieve in March. Demand continued to slow and output conditions worsened. Persistent contraction in the manufacturing sector alongside slowing consumer demand, present downside risks to US growth, which has already come off the above trend pace of last year.
As Chair Powell hinted at, the U.S. economy is in a different world now. As both sides of the Fed’s dual mandate come into sharper focus, a September cut is almost a guarantee and the chance for three rate cuts this year has certainly risen.
Canada – Strong Second Quarter Unlikely to Move the Needle on Rate Decision
This week’s market action was heavily influenced by the U.S. Federal Reserve’s interest rate decision, Chair Powell’s subsequent press conference, and Friday’s employment report. Canada’s bond market mirrored the rally of its southern counterpart, rising throughout the week and accelerating on Friday. Given the inverse relationship to prices, Canada’s 10-year and 5-year government bond yields fell by roughly 30 basis points.
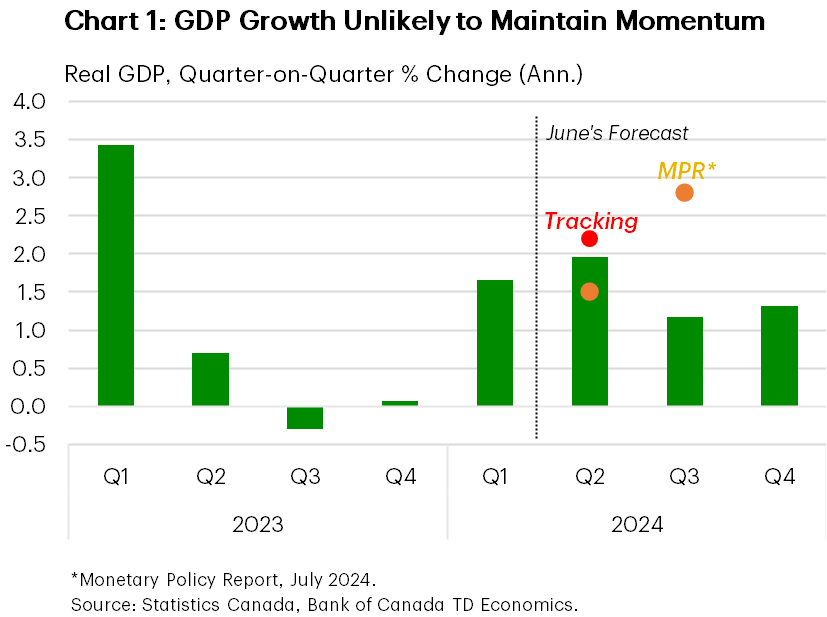
On Canada’s economic front, the key report was the monthly GDP by industry. Growth exceeded expectations, showing a 0.2% month-on-month growth in May, with the advance estimate for June suggesting a 0.1% increase. Assuming no revisions, this report solidifies expectations that second-quarter GDP will be stronger than previously anticipated, around 2.2% annualized, and growth in the third quarter is now looking a bit stronger than we had expected at the time of our June forecast. The Bank of Canada (BoC), on the other hand expects a solid out turn for the economy in Q2, forecasting 2.8% growth in its recent Monetary Policy Report (Chart 1).
Economic growth was broad-based in May, with both goods-producing and services-providing sectors expanding. The most significant contributions came from non-durable manufacturing, particularly petroleum refineries, which rebounded after maintenance work in April. On the services side, aside from the public sector’s significant contribution, the largest impacts came from accommodation & food services as well as finance & insurance, driven by investment activity in bonds and mutual funds. An interesting detail highlighted by Statistics Canada was the increase in arts, entertainment, & recreation sector, which was bolstered by three Canadian teams playing in the NHL playoffs in May. While these contributions are noteworthy, some of them share a common characteristic of being temporary effects. So while the report shows that there is still resilience in the economy, the momentum is not strong enough to push economic growth above trend levels.
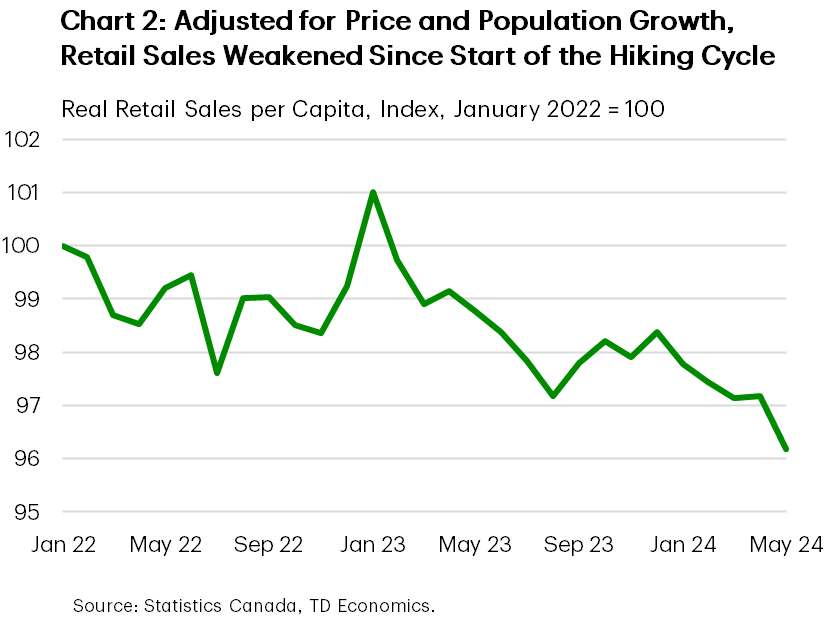
For another perspective, consider the state of the Canadian consumer. Higher frequency data on consumption, including spending at retail stores and restaurants, as well as our own card spending data, indicates a more cautious consumer who may still be spending, but without extravagance. Furthermore, one factor masking consumer weakness is population growth, which has exceeded estimates for several quarters and partly explains positive economic surprises. In fact, when adjusted for price and population gains, retail spending has weakened since the start of the Bank’s hiking cycle and contracted for most of this year (Chart 2). With new government restrictions on non-permanent residents taking effect, slower population growth is likely to become a headwind for the economy.
Next week it’s Canada’s turn for jobs numbers. Canada has been seeing cooler labour market conditions for a while now. The Bank will be focused on the degree of slack in the labour market and wage growth trends as they calibrate the pace of interest rate cuts. Market consensus suggests that the BoC is likely to proceed with a third consecutive rate cut in September.
Weekly Economic and Financial Commentary: The Downside Risks to the Employment Mandate Are Real Now
Summary
United States: "The Downside Risks to the Employment Mandate Are Real Now"
- We have just concluded what will become a historic week. The July employment report brought with it a crossing of the Sahm Rule threshold. That means we're either headed for recession, or about to break yet another recession rule this unique cycle. Either way, the Fed is getting ready to cut. We still see a 25 bps cut in September, though growing risks to the employment side of the Fed's mandate suggest more and/or a faster pace of easing may be warranted.
- Next week: ISM Services (Mon.), Trade Balance (Tue.)
International: Global Central Banks Getting Busy
- It was a busy week for global central banks. The Bank of Japan raised its policy rate to around 0.25%, while the Bank of England delivered an initial 25 bps rate cut to 5.00%. In Latin America, the Brazilian Central Bank held its policy rate steady, the Chilean Central Bank paused its easing cycle and Colombia's central bank kept up its 50-bps-per-meeting easing pace.
- Next week: Reserve Bank of Australia Policy Rate (Tue.), Japan Labor Cash Earnings (Tue.), Banxico Policy Rate (Thu.)
Interest Rate Watch: Open Door to a September Cut, Where Have I Heard That?
- This week's Fed meeting noted progress on inflation and opened the door to a rate cut in September. Why does this sound so familiar?
Credit Market Insights: A HELOC Helping Hand
- Given how the consumer has surprised to the upside before in this cycle, how might consumers today look beyond their income to increase purchases if pandemic-era savings are gone and credit is less widely available? One option may be increased use of home equity lines of credit (HELOCs).
Topic of the Week: The Host with the Most: An Economic Overview of France
- The XXXIII Olympiad kicked off last Friday in Paris and will continue until Aug. 11. Though Paris is the host city, events are being held in 16 additional cities across France, with one subsite in Tahiti, French Polynesia. In honor of this year's games, we provide an economic overview of the host country.