Sample Category Title
Swiss Q1 GDP Beats Expectations as Manufacturing Drives Growth
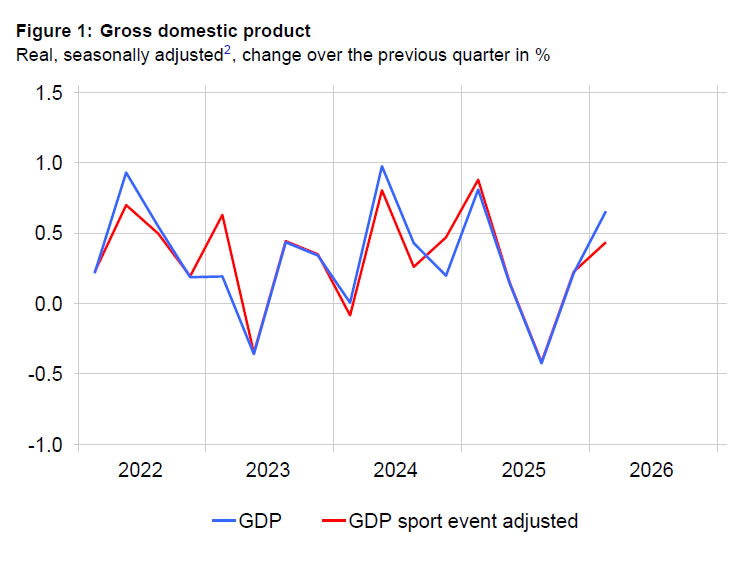
Switzerland's economy expanded faster than expected in the first quarter, with GDP excluding sporting events rising from 0.2% qoq to 0.7% qoq, well above the 0.5% qoq consensus forecast. On a sport-adjusted basis, GDP accelerated from 0.2% qoq to 0.4% qoq. The data suggest the Swiss economy entered 2026 with stronger momentum than anticipated, though the composition of growth reveals a mixed picture beneath the headline.
The industrial sector was the main driver of the improvement. Industrial value added rose 1.3%, supported by a 1.5% increase in manufacturing output. Growth was particularly strong in the broader manufacturing sector outside chemicals and pharmaceuticals, where value added jumped 4.6%. Several industrial segments reported higher exports and revenues, helping offset weakness in Switzerland's key pharmaceutical industry. Chemical and pharmaceutical output fell 3.4% as exports from the sector declined sharply at the start of the year, contributing to an overall 2.2% drop in goods exports.
Domestic demand, however, remained soft. Final domestic demand grew just 0.1%, while both equipment investment and construction investment declined 0.2%. Private consumption was essentially flat, reflected in weaker retail activity and softer demand for accommodation and food services. The services sector expanded only modestly by 0.2%, with gains in transport and financial services offset by weakness in trade and tourism-related industries. The figures suggest Switzerland's recent growth is being driven primarily by industrial activity rather than broad-based strength across the economy.
| Indicator | Previous | Latest |
|---|---|---|
| GDP (Excluding Sporting Events) | +0.2% qoq | +0.7% qoq |
| GDP (Sport-Adjusted) | +0.2% qoq | +0.4% qoq |
| Industrial Sector Value Added | +1.3% | |
| Manufacturing Value Added | +1.5% | |
| Other Manufacturing | +4.6% | |
| Chemical & Pharmaceutical Industry | -3.4% | |
| Goods Exports | -2.2% | |
| Services Sector Value Added | +0.2% | |
| Transport Services | +1.9% | |
| Financial Services | +1.3% | |
| Trade Sector | -0.8% | |
| Retail Trade | -1.3% | |
| Accommodation & Food Services | -0.6% | |
| Services Exports | +0.5% | |
| Domestic Final Demand | +0.1% | |
| Government Consumption | +0.9% | |
| Equipment Investment | -0.2% | |
| Construction Investment | -0.2% | |
| Imports | -2.4% |
Sunrise Market Commentary
Markets
President Trump retreated in the Situation Room last Friday to make a “final determination” on a preliminary agreement that would, amongst others, extend the April ceasefire but reportedly left the room without having made any decision. No one really knows what conclusions to draw but markets in any case aren’t too worried about it. US and German bonds finished the week higher with the latter slightly outperforming the former. Net daily changes stayed confined to less than 3 bps though. Oil prices eased to their lowest level since mid-April, supporting the small upleg in core bonds. US-Iran optimism held up the main US stock indices as well with minor gains between 0.2 and 0.7%. The US dollar trailed most of its biggest peers but trading was technically insignificant. EUR/USD flipped between gains and losses before eventually having closed slightly higher around 1.166. DXY mirrored those moves around the 99 barrier. Sterling steadied around EUR/GBP 0.8665.
The weekend saw some skirmishes in the Middle East again. The US struck some Iranian radar and drone sites on Qeshm island and in southern Iran. It branded the move as a defensive one, in response to Iran taking out a US drone earlier. Iran’s semi-official Fars news agency this morning said the country in retaliation targeted US air bases. This ongoing sparring creates some doubt over a potential deal and pushes up the price of oil marginally at today’s open. Brent is currently trading around $93/b. The market’s view, however, remains an agreement will be found either way. The US dollar holds a slight edge this morning and US Treasury yields eke out a couple of basis points, basically undoing the Friday declines.
This week’s economic calendar is usually an interesting one. A new month traditionally kicks off with an US economic update, starting with the US manufacturing ISM scheduled for release today. JOLTS job vacancies are on tap tomorrow, followed by the ADP job report and services ISM on Wednesday. Friday’s payrolls report are the typical cherry on the cake. We assume the data to combine a solid economy with a resilient labour market that will ultimately end up in a more neutral bias from the Fed in its June policy statement – the first one with chair Warsh at the helm. The European economic calendar features the ECB’s consumer inflation survey today. A further rise in expectations is the most likely outcome, adding further pressure, insofar still needed, on the central bank going into its meeting next week. Our in-house KBC Nowcast model points to a 3.3% Y/Y reading (up from 3%) for the euro zone HICP print on Tuesday. That would be the highest reading since September 2023, moving further away from the ECB’s 2% inflation target. For goods, we expect Y/Y price growth to increase to 0.9%, driven by higher commodity prices. Despite a modest decline in price expectations (surveys), we expect services inflation to rise from 3% to 3.2%. Underlying core CPI is expected to pick up from 2.2% to 2.4%.
News & Views
Rating agency S&P affirmed the Hungarian BBB- rating while also keeping the negative outlook on the lowest possible investment grade rating. “The negative outlook reflects our view of risks to Hungary’s fiscal and economic stability over the next two years. Large budgetary deficits, high debt, and elevated interest expense continue to limit Hungarian authorities’ policy flexibility to manage endogenous and exogenous pressures”. Net general government debt is set to peak at 74% in 2027 before starting to decline. For 2026, the general government deficit is set to worsen to 6.75% of GDP due to pre-election spending, including untargeted subsidies and tax relief on household energy consumption. In 2027, the deficit is expected to remain elevated at 5.25% of GDP. A successful exit from the European Commission's excessive deficit procedure (EDP) is contingent on the government's ability to implement ongoing expenditure restraint and a credible multi-year framework. S&P believes that will only happen in 2030.
The FT reports that Bulgaria will be placed under the EC’s excessive deficit procedure only months after joining the Eurozone for breaching fiscal rules. More specifically for a budget deficit above the 3% of GDP threshold. The Bulgarian budget deficit widened to 3.5% of GDP last year and is seen increasing further this year (4.1%) and next (4.3%). Other countries in the EDP-procedure are Romania, Poland, Belgium, France, Hungary, Slovakia, Austria, Finland and Italy.
ECB’s Schnabel Strengthens Case for June Hike as Inflation Expectations Risk Becoming Unanchored
ECB Executive Board member Isabel Schnabel reinforced her hawkish stance on Monday, arguing that policymakers can no longer treat the inflation impact of the Iran conflict as a temporary shock. Speaking at a conference in Seoul, Schnabel said, "We can no longer look through this shock," warning that "the risk of de-anchoring inflation expectations is rising." Her remarks further solidify expectations that the ECB will raise interest rates at its June 10-11 meeting.
Schnabel argued that the current energy shock differs from previous episodes because it is increasingly feeding through global supply chains and production costs rather than remaining confined to oil prices alone. She warned that rising producer-price pressures in China and elsewhere are beginning to create broader inflationary forces. "We are seeing globally that pipeline pressures are rising," she said, adding that these pressures "will exert inflationary pressure basically all over the world."
While supporting further tightening, Schnabel stopped short of providing guidance on how many additional rate hikes may follow. "It's too early to say that it's a certain number of hikes and then it's done," she said.
US Manufacturing Activity is Holding Up
In focus today
In the US, ISM Manufacturing index will be released for May. Regional Fed indices are pointing towards another uptick despite the energy supply uncertainty.
In the euro area, we receive data on unemployment in April. We expect 6.2%, in line with consensus. While unemployment is low, the labour market has softened, with slower employment growth and weaker expectations from firms after the war in Iran. We also get the final manufacturing PMI for May, which we expect to confirm the flash estimate at 51.4.
For the remainder of the week, focus turns to euro area flash HICP on Tuesday. In the US, labour market data is due throughout the week, culminating in the jobs report on Friday. Closer to home, attention turns FX reserve data in Denmark due Tuesday, the Danske Bank Nordic Outlook on Wednesday and Sweden's CPI on Thursday. All this unfolds against the backdrop of developments in the Middle East, which continue to be a key market driver.
Economic and market news
What happened overnight
China released PMIs from both the official NBS and the private RatingDog on Sunday and overnight, respectively. RatingDog manufacturing eased from 52.2 to 51.8 (cons: 51.6), while NBS manufacturing declined from 50.3 to 50.0 (cons: 50.0). The NBS details point to softer demand, with new and export orders back below 50, while employment remains weak and input costs elevated despite some moderation. On the services side, the non‑manufacturing PMI moved back into expansion at 50.1, supported by holiday‑related spending and continued resilience in services and high‑tech sectors.
What happened over the weekend
In the euro area, May flash inflation data from Germany, France, Italy and Spain (around 75% of the aggregate print) showed headline inflation rising mainly on the back of energy. France, Italy and Spain came in close to expectations, while German regional CPI surprised on the downside. Overall, the data suggest that the ECB can take more time to assess the impact of the energy shock before acting. While a June hike is seeming like a done deal, a second hike already in July is becoming less likely.
In Sweden, significant revisions to national accounts data showed stronger historical growth but slightly weaker momentum at present. In Q1, GDP fell 0.2% q/q while rising 2.0% y/y, with the weakness reflecting mainly a larger decline in government consumption and investments after the strong uptick in Q4. Household consumption, the most important demand component right now, grew more than expected, rising 0.6% q/q. Overall, the release was more solid than headline figures suggest, and the need for further stimulus should be re-assessed on the back of these numbers. Given the Riksbank's unusually large focus on resource utilisation and the slow recovery, the data should be seen as hawkish on the margin.
In Norway, the seasonally adjusted unemployment rate was unchanged at 2.1% in May, as expected, with the gross number of unemployed falling by 900. While this signals a tight labour market, the figure is marginally weaker than Norges Bank's projection in the March MPR (2.0 %) but is unlikely to affect the monetary policy decision on 18 June. Retail sales came in higher than we expected at 0.3% m/m in April, taking the underlying trend to -0.8% 3m/3m (prior: 0%). With households facing headwinds from higher inflation and signals of higher mortgage rates, we expect consumption growth to be more muted going forward.
Fed speakers on Friday were broadly in line with the shift we outlined in last week's Reading the Markets USD, 26 May, where we argued that the balance of risks has moved towards faster inflation and tighter monetary policy. Kashkari and Schmid leaned hawkish after the strong April PCE print and the latest energy shock, while Bowman (dove) noted that a prolonged Iran-related energy shock could change her rate outlook. Paulson and Daly both see policy as well positioned but note that a lasting conflict and higher oil prices are key upside risks to inflation that could increase the need for further tightening.
Equities: Global equities ended the week on a firmer footing rising 0.4% on Friday, supported by gains in IT and financials. S&P 500 advanced 0.2%, with tech leading the sector table, up 1.9%. This marked the ninth consecutive week of positive gains for the S&P 500. Nasdaq rose 0.2%, Russell2000 declined -0.6%. Overnight, Asian equities and US futures are in green.
FI and FX: It was a relatively quiet end to the week in FX markets. NZD was the big mover on Friday, while the rest of G10 was steady. EUR/USD ended the week around 1.1650 following the big drop in oil prices. US interest rates fell back last week with the 10Y Treasury yield falling to 4.43% down more than 20bp from the top in mid-May. The impact on EUR/USD FX swaps was limited as interest rates in the euro area also fell. Scandies were steady on Friday, with EUR/SEK trading around 10.77 and close to the low from April.
Markets Face Twin Tests: US Jobs Data and an Unsigned Iran Deal
Markets enter the new week balancing two major uncertainties: whether a proposed US-Iran ceasefire extension can evolve into a formal agreement, and whether incoming economic data will push the Federal Reserve closer toward another rate hike. Last week, investors aggressively embraced the peace trade. Oil prices collapsed, Treasury yields retreated, and equities surged as markets increasingly priced a normalization of energy flows through the Strait of Hormuz. Yet despite the optimism, the agreement at the center of that repricing still does not exist.
Over the weekend, fresh reports suggested negotiations remain difficult. US President Donald Trump reportedly requested additional changes to the proposed framework, particularly regarding the reopening of the Strait of Hormuz and the disposal of Iran's highly enriched uranium stockpile. Iranian negotiators pushed back, insisting that Tehran would not accept any arrangement that failed to fully protect Iranian rights. A White House Situation Room meeting intended to make a final determination on the framework ended without a clear decision, reinforcing the impression that significant hurdles remain.
Trump's own comments added another more uncertainty. While he said he believes a deal can eventually be reached, he also stressed that he is "in no hurry" and warned that military action remains an alternative if negotiations fail. That combination of patience and threat highlights the risk facing markets this week. Oil has already unwound a large portion of its geopolitical premium, with Brent falling from above 112 to below 90. The question now is whether diplomacy can catch up with market expectations.
The geopolitical backdrop arrives just as investors face one of the most important weeks for US macro data this year. Fed officials have shifted a more hawkish tone in recent weeks, but most have also emphasized that there is currently no need for an immediate rate hike. With Fed funds still sitting at 3.50%-3.75% under Chair Kevin Warsh, markets have already abandoned rate-cut expectations. The debate is now centered on whether the Fed simply holds rates higher for longer or eventually tightens again if inflation pressures persist.
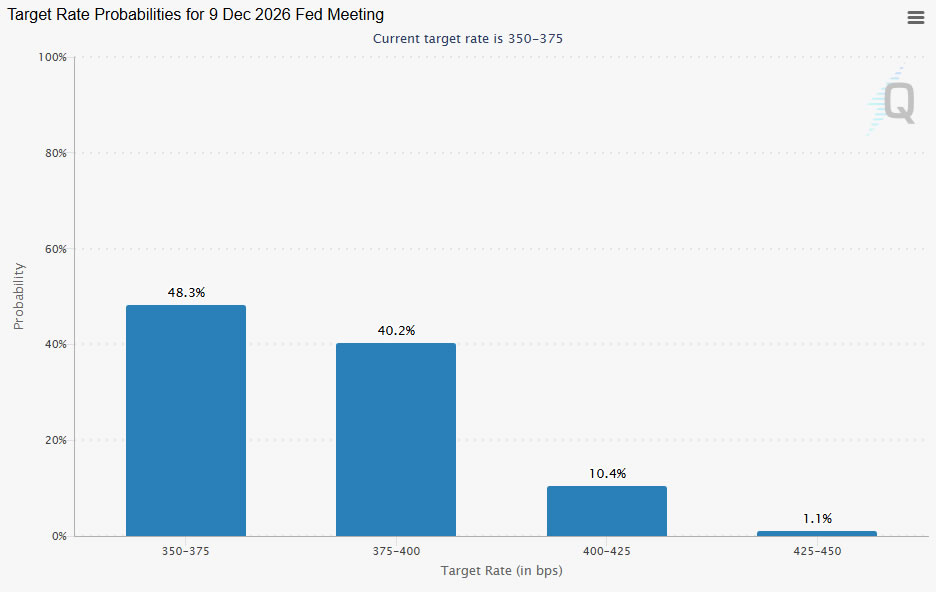
That makes Friday's Non-Farm Payrolls report the week's defining event. A strong labor market would allow the Fed to keep focusing on inflation risks, particularly if wage growth remains elevated while oil-related cost pressures continue filtering through the economy. Treasury yields and Dollar pricing could become sensitive to any signs that labor demand remains too strong to comfortably return inflation toward target.
The market path last week was straightforward: lower oil, lower yields, stronger equities. This week could prove more complicated. If diplomacy stalls while economic data surprises to the upside, investors may need to reassess both the pace of disinflation and the assumption that the Middle East risk premium has already disappeared.
Data Calendar: Inflation, Jobs and Growth Take Center Stage
USD
The US calendar dominates the week. Monday's ISM Manufacturing PMI will be watched closely for signals on industrial demand and, more importantly, the Prices Paid component, which could offer an early indication of whether raw material inflation is accelerating again.
Attention then shifts to Wednesday's ADP Employment Change and ISM Services PMI. ADP serves as an imperfect but closely watched preview of Friday's payrolls report, while the services survey will provide insight into how higher energy costs are affecting the largest part of the US economy. Markets will also focus on pricing components within the report given ongoing inflation concerns.
Friday's Non-Farm Payrolls and unemployment rate release stands as the main event. Strong hiring and firm wage growth would reinforce the view that the Fed has room to remain restrictive and potentially consider tightening if inflation proves sticky. Weakening employment conditions, however, would reduce pressure on policymakers and likely support the recent decline in yields.
EUR
Euro traders face a critical inflation test on Tuesday. ECB officials have spent weeks preparing markets for a June rate hike, and May Flash CPI is expected to provide the final validation. Consensus forecasts point to inflation accelerating from 3.0% to 3.3%, which would reinforce the ECB's concern that higher energy costs are feeding into broader price pressures.
AUD
Australia's focus turns to Q1 GDP on Wednesday. Expectations for a June RBA pause are firmly established following softer than expected inflation data and weaker labor market readings. As a result, growth data now carries greater importance. A stronger GDP outcome could revive expectations for another rate hike later this year, likely in August, while weak growth would strengthen the argument that policy tightening is finally beginning to bite.
CAD
Canada's labor market report arrives simultaneously with US payrolls on Friday, setting the stage for potentially sharp USD/CAD volatility. With the Bank of Canada's June 10 meeting approaching, the employment data serves as the final major policy input. Markets broadly expect the BoC to remain on hold, meaning it would likely require a significant surprise in either employment or wages to materially alter policy expectations.
Economic Calendar Highlight: Week of June 1, 2026
| Date | Currency | Key Event |
| Mon, June 1 | USD | ISM Manufacturing PMI (May) |
| CHF | Q1 GDP Growth Rate | |
| Tue, June 2 | EUR | Flash CPI Inflation YoY (May) |
| Wed, June 3 | AUD | Q1 GDP |
| USD | ISM Services PMI (May) | |
| USD | ADP Employment Change | |
| Thu, June 4 | CHF | CPI Inflation YoY (May) |
| Fri, June 5 | USD | Non-Farm Payrolls (NFP) |
| USD | Unemployment Rate & Wages | |
| CAD | Employment Change & Unemployment |
EUR/USD Bounce Runs Into Trouble As Resistance Strikes Back
Key Highlights
- EUR/USD started a recovery wave and tested the 1.1675 resistance.
- An expanding triangle is forming with resistance at 1.1675 on the 4-hour chart.
- GBP/USD is still struggling to clear the 1.3550 resistance zone.
- Gold could start a fresh decline unless it closes above $4,600.
EUR/USD Technical Analysis
The Euro found support at 1.1575 against the US Dollar. EUR/USD started a recovery wave above 1.1600 and 1.1620, but it faces many hurdles.
Looking at the 4-hour chart, the pair climbed above the 38.2% Fib retracement level of the downward move from the 1.1787 swing high to the 1.1576 low. However, the bears seem to be active near the key hurdle at 1.1675.
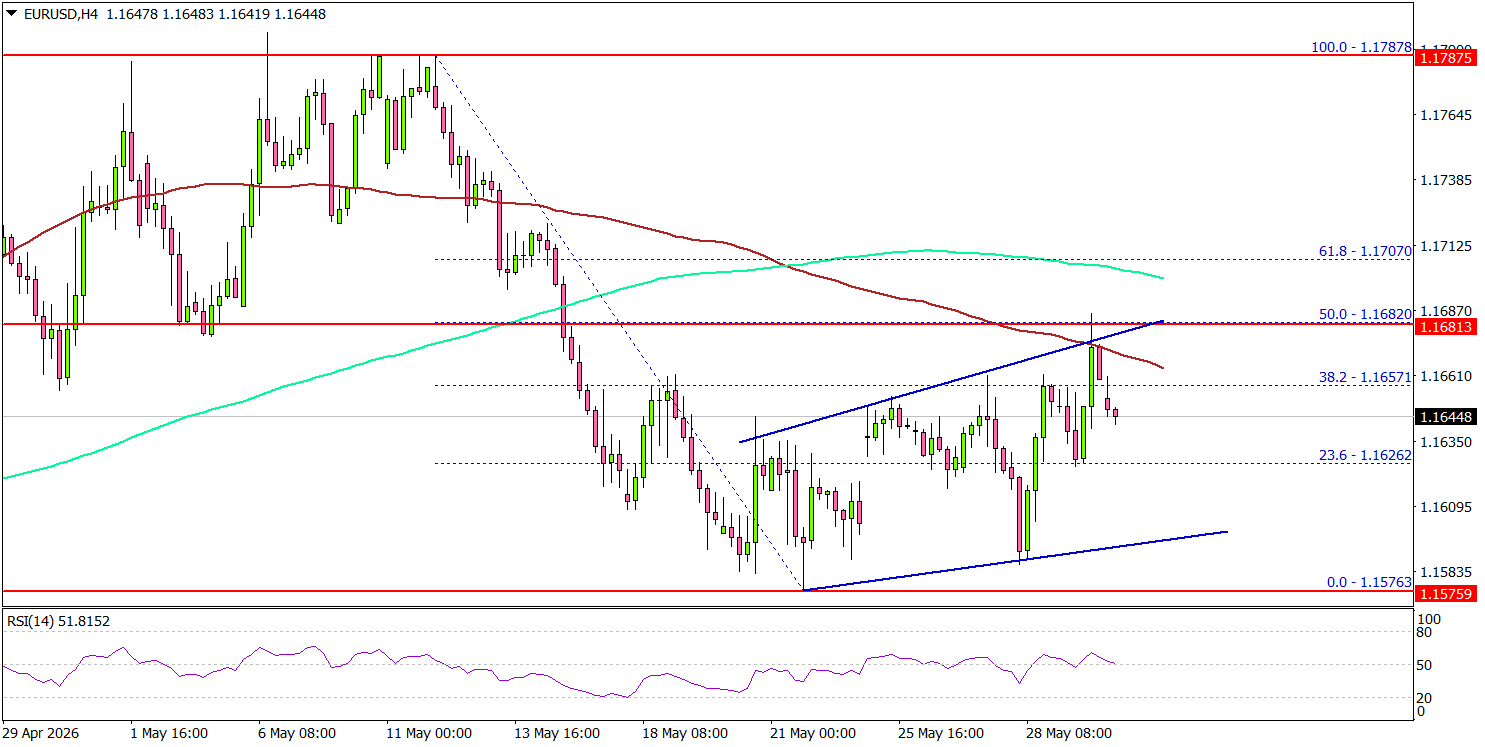
There is also an expanding triangle forming with resistance at 1.1675. It coincides with the 50% Fib retracement level of the downward move from the 1.1787 swing high to the 1.1576 low.
The pair is now trading below the 100 simple moving average (red, 4-hour) and the 200 simple moving average (green, 4-hour). To continue higher, it must settle above 1.1675.
The next major resistance could be 1.1700. A close above 1.1700 could open doors for gains above 1.1750. In the stated case, the bulls could aim for a move to 1.1800.
On the downside, the pair could find bids near 1.1620. The first major support might be 1.1600. A close below 1.1600 might initiate a drop to 1.1550. Any more losses might open the doors for a drop toward the 1.1420 zone.
Looking at GBP/USD, the pair is attempting to recover some losses, but it faces a major hurdle near the 1.3550 region.
Upcoming Key Economic Events:
- US ISM Non-Manufacturing Index for May 2026 – Forecast 52.6, versus 52.7 previous
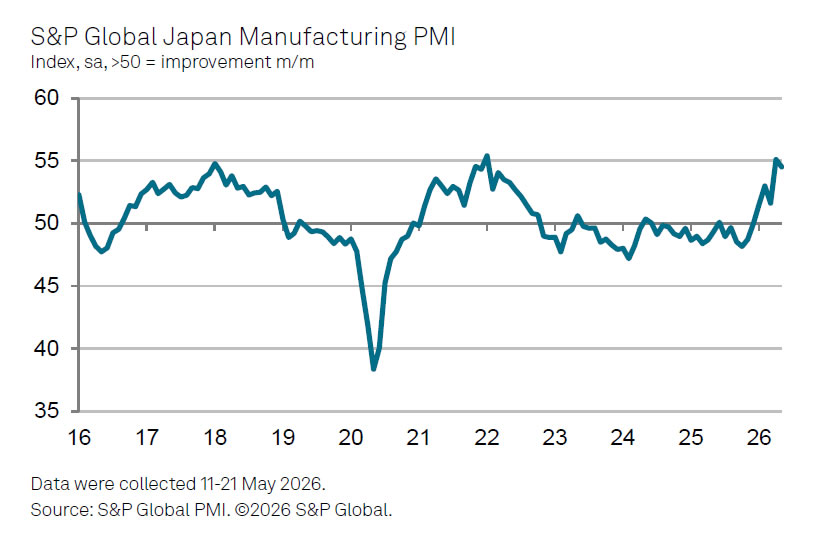
Japan Manufacturing PMI Finalized at 54.1, Strong Growth Despite Rising Cost Pressures
Japan's manufacturing sector delivered another strong performance in May, with PMI Manufacturing finalized at 54.4, slightly down from April's 55.1. The latest reading signaled a fifth straight month of improving business conditions as both output and new orders expanded at historically strong rates. The data suggest Japanese manufacturers continue to benefit from resilient demand, particularly in technology-related industries linked to ongoing investment in AI and electronics.
Yet the survey also revealed that some of the recent strength may be temporary. Firms reported increasing inventories across supply chains as manufacturers and customers sought to guard against potential disruptions and rising costs stemming from the Middle East conflict. This precautionary stockpiling helped lift production but may also have brought forward some demand that would otherwise have occurred later in the year.
The survey painted a more cautious picture beneath the headline strength. Input costs and selling prices surged, with both inflation gauges reaching levels rarely observed since data collection began more than two decades ago. Meanwhile, confidence about future output improved only slightly from April's recent low. While manufacturers remain optimistic that technology investment will continue to support activity, elevated costs and sluggish global demand are emerging as key risks to Japan's manufacturing outlook.
| Indicator | Previous | Latest |
|---|---|---|
| PMI Manufacturing | 55.1 | 54.4 |
| Manufacturing Conditions | Improving | Improving |
| Output | Expansion | Strong Expansion |
| New Orders | Expansion | Strong Expansion |
| Inventory Building | Elevated | Elevated |
| Input Prices | High | Near Record High |
| Output Prices | High | Near Record High |
| Future Output Sentiment | Recent Low | Slightly Improved |
China PMIs Signal Slower Growth as Export Demand Weakens
China's latest PMI surveys suggest the economy navigated the second quarter with a growing split between domestic and external demand. Manufacturing activity slowed in May while services improved, indicating that consumer spending at home is helping offset mounting pressure from weaker overseas markets. The data reinforce signs from April activity indicators that growth momentum has cooled despite earlier resilience in exports.
NBS PMI Manufacturing fell from 50.3 to 50.0, the weakest reading in three months. While production remained solid at 51.2, new orders slipped from expansion into contraction at 49.9. The sharpest deterioration came from foreign demand, with new export orders falling from 50.3 to 48.6.
Consumer goods producers experienced particularly pronounced weakness, underscoring the challenges facing Chinese exporters as global demand softens.
In contrast, NBS PMI Non-Manufacturing rose from 49.4 to 50.1, helped by strong travel spending during the May Day holiday period, while the services component climbed to a nine-month high of 50.3.
The private RatingDog PMI Manufacturing survey echoed the official findings. The index eased from 52.2 to 51.8 as growth in production and new orders moderated. Firms benefited from slightly easing inflation pressures, but export demand weakened noticeably. New export orders contracted for the first time in five months, providing an early signal that higher energy prices and slower global demand are beginning to affect overseas sales.
| Indicator | Previous | Latest |
|---|---|---|
| NBS PMI Manufacturing | 50.3 | 50.0 |
| Production Sub-Index | 51.2 | |
| New Orders Sub-Index | 49.9 | |
| New Export Orders | 50.3 | 48.6 |
| NBS PMI Non-Manufacturing | 49.4 | 50.1 |
| NBS Services Activity | N/A | 50.3 |
| RatingDog PMI Manufacturing | 52.2 | 51.8 |
| Production (RatingDog) | Expansion | Expansion |
| New Orders (RatingDog) | Expansion | Expansion |
| New Export Orders (RatingDog) | Expansion | Contraction |
| Inflation Pressures | Elevated | Eased |
U.S.-Iran Talks, BoJ Intervention Risk, and Jobs Data in Focus
The shorter trading week, due to U.K. and U.S. holidays, had no major economic releases, but the data that did come out was mixed. U.S. GDP was weaker than expected, while durable goods orders were stronger than forecast.
Recent market trends continued. U.S. and Japanese equities moved higher, while USD/JPY tested higher levels as the Bank of Japan stayed on the sidelines and did not intervene. Optimism around reports that the U.S. and Iran were moving toward a 60-day ceasefire extension, along with a possible reopening of traffic through the Strait of Hormuz, helped push oil prices lower and supported risk appetite through much of the week.
U.S.-Iran deal optimism also contributed to a fall in longer-term U.S. interest rates. However, Fed officials remained cautious on inflation. Fed Governor Lisa Cook said she was prepared to raise rates if inflation continued moving in the wrong direction, reminding markets that rate-cut hopes may still be premature.
Markets This Week
U.S. Stocks
The Dow posted another week of gains, and the outlook remains positive for now. There is always a risk of surprise news, but while the current uptrend remains in place, buying near the 10-day moving average remains the preferred strategy. Resistance levels are at 51,200, 51,500 and 52,000. Support is seen at 50,000, 49,500, 49,000, 48,500 and 48,000.
Japanese Stocks
Japanese equities remain popular with investors around the world, with the Nikkei rising 4% last week and now up more than 25% this year. The strong uptrend remains in place, so buying on weakness remains the preferred strategy for both short-term and long-term traders. Resistance is seen at 67,000, 68,000, 69,000 and 70,000, while support is at 64,000, 62,000, 61,000, 60,000 and 59,000.
USD/JPY
Despite the risk of Bank of Japan intervention, traders continued to focus on the large interest rate gap between the U.S. and Japan. Comments from a Fed official about the possibility of rate hikes if inflation stays high also encouraged buying. However, the Bank of Japan still remains likely to support the yen if USD/JPY moves above 160. A selling opportunity could appear if the pair falls below the 10-day moving average and breaks the recent uptrend from the past few weeks. Resistance is at 160.00, 160.50, 162.00 and 165.00, while support is seen at 158.00, 157.00, 156.00, 155.50 and 155.00.
Gold
Gold volatility increased as the market fell below the May lows, encouraging technical selling in the middle of the week. However, a fall in long-term U.S. interest rates, as crude oil moved lower toward the end of the week, helped gold recover and finish the week close to unchanged. The quick rebound was positive, and with long-term U.S. rates falling, gold is more likely to trade sideways to higher this week. Resistance is at $4,600, $4,665, $4,750 and $4,900, while support is at $4,500, $4,450, and $4,350.
Crude Oil
WTI crude oil fell significantly as reports that Washington and Tehran had tentatively agreed to extend a ceasefire reduced fears of supply disruption. The market remained volatile because the deal was not final and still needed approval from President Trump. However, the downward trend is becoming stronger, so selling into strength may be the preferred strategy in the current environment, as long as the Iran situation does not worsen. Resistance is at $95, $100, $105, $110 and $120, while support is at $90, $80, $75, $70, and $67.50.
Bitcoin
Bitcoin selling continued last week as investor interest kept falling. The technical picture also remained bearish, with the 10-day moving average pointing lower and the market breaking below support at $75,000. The downtrend is worth following for now, so selling into strength remains the preferred strategy as long as prices stay below the 10-day moving average. Resistance is at $75,000, $80,000, $85,000, and $90,000, while support is at $65,000, $60,000, and $55,000.
This Week’s Focus
- Monday: Japan Capital Spending, E.U. HCOB Eurozone Manufacturing PMI and Unemployment Rate, U.K. S&P Global Manufacturing PMI, U.S. S&P Global Manufacturing PMI and ISM Manufacturing PMI
- Tuesday: Australia Current Account and Building Approvals, E.U. CPI, U.S. JOLTS Job Openings
- Wednesday: Japan S&P Global Services PMI, Australia GDP, E.U. HCOB Eurozone Services PMI, U.K. S&P Global Composite PMI, U.S. ADP Nonfarm Employment Change, S&P Global Services PMI, Factory Orders and Beige Book
- Thursday: Australia Trade Balance, U.K. S&P Global Construction PMI
- Friday: Japan Household Spending, E.U. GDP, U.S. Nonfarm Payrolls
Markets have been quiet recently, but volatility could rise soon. The main focus remains on U.S.-Iran negotiations and whether oil supply could increase. USD/JPY will also stay important, as further yen weakness could raise the risk of Bank of Japan intervention. Traders will also be watching the key U.S. employment data released on Friday.
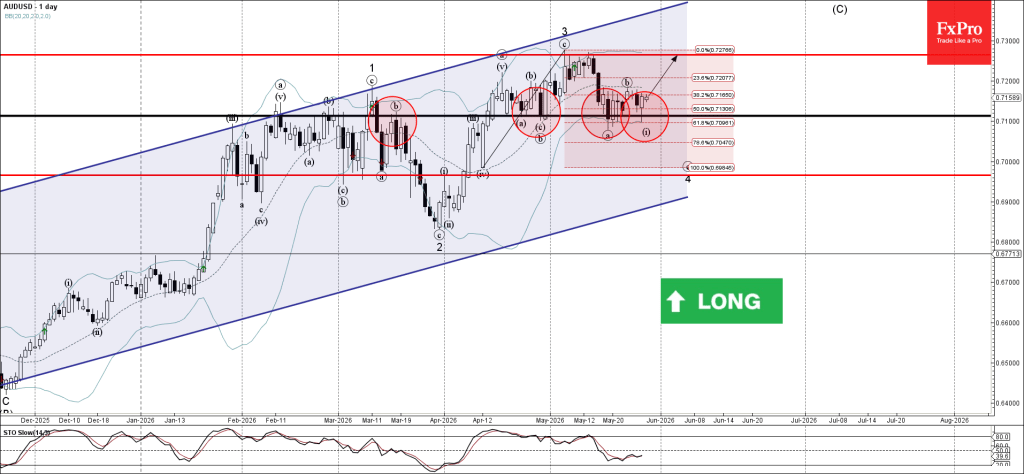
AUDUSD Wave Analysis
AUDUSD: ⬆️ Buy
- AUDUSD reversed from support area
- Likely to rise to resistance level 0.7265
AUDUSD currency pair recently reversed from the support area between the key support level 0.7100 (which has been reversing the price from the end of April), lower daily Bollinger Band and the 61.8% Fibonacci correction of the upward impulse from April.
The upward reversal from this support zone created the daily Japanese candlesticks reversal pattern Piercing Line.
Given the clear daily uptrend and the bearish US dollar sentiment seen today across the FX markets, AUDUSD currency pair can be expected to rise to the next resistance level 0.7265 (top of the previous impulse wave 3).