

Sample Category Title
Sunset Market Commentary
Markets
The euro zone’s four largest countries today released May inflation numbers. On a monthly basis, the pace slowed but most annual numbers rose further. French inflation increased by 0.1% M/M to 2.8% Y/Y (from 2.5%; highest since February 2024). Spanish inflation moved at the same monthly pace but hit 3.6% Y/Y (from 3.5%; second highest since May 2024). Italian prices rose by 0.4% M/M to 3.3% Y/Y (highest since September 2023). German inflation was exception to the rule with a 0.1% M/M-decline and a 2.7% Y/Y (from 2.9%) outcome. Overall, today’s numbers printed near consensus with our in-house KBC Nowcast model pointing to a 3.3% Y/Y reading (up from 3%) for the euro zone on Tuesday. That would be the highest reading since September 2023, moving further away from the ECB’s 2% inflation target. For goods, we expect Y/Y price growth to increase to 0.9%, driven by higher commodity prices. Despite a modest decline in price expectations (surveys), we expect services inflation to rise from 3% to 3.2%. Underlying core CPI is expected to pick up from 2.2% to 2.4%. Today’s numbers and more ECB comments further cement the case for a June 25 bps rate hike. Italian ECB Panetta, usually a dovish profile, said that the outlook seems to call for a rate recalibration to counter the risk of persistent inflationary tensions. More an more governors also point to depleted fuel stocks and rising price expectations as reasons to hike rates. The depleted stocks argument fits with the narrative that we’re just at the end of the beginning of the energy crisis, even if the US and Iran reach some kind of interim agreement. ECB Simkus is the first to look beyond the June meeting, at which he’ll likely support a rate hike. He argues that a second rate hike is more likely than not, but didn’t elaborate on the timing of such move (back-to-back or together with the September Monetary Policy Report?). EMU money markets currently prefer the second option. In our view, if the crisis persists, back-to-back seems to be the more likely and better path to follow.
Overall trading was muted today in anticipation of US President Trump’s (dis)approval of the interim deal. Brent crude hovers around $92/b. Daily changes on core bond yield curves are confined to 1 bp with UK gilts slightly outperforming after BoE governor Bailey said that the central bank can temporarily tolerate higher inflation. EUR/USD treads water near 1.1650. Stock markets have a guarded positive bias.
News & Views
The Swiss Kof economic barometer improved marginally in May from 97.8 to 98. After a sharp drop in March, the index already improved last month. Even so, the outlook for the Swiss economy remains muted as the index remains below its medium term average. Different bundles in the indicator showed mixed developments. On the production side, indicators for manufacturing are particularly under pressure but this is cushioned by a positive outlook in the indicators for financial and insurance services. On the demand side, the indicators for foreign demand are reported the show more favourable developments, but indicators on private consumption experience a setback. After strengthening to the EUR/CHF 0.90 area at the start of the conflict in the Middle East, the franc from mid-March weakened to settle in a relatively tight range roughly between EUR/CHF 0.90 and EUR/CHF 0.925 (currently 0.9125) as the Swiss National Bank warned that it has a greater willingness to intervene in the FX market as necessary to execute its inflation policy. The next SNB monetary policy decision will be released on June 18.
Swedish GDP decreased by 0.2% Q/Q (+2.0% Y.Y) in Q1. Inventories (0.8% positive contribution) and household consumption (+0.6% growth) were the main positives. Gross fixed capital formation dropped 2.3% Q/Q, driven by declines for investments in buildings and constructions. General government consumption decreased by 7.6%. Net exports also contributed negatively (-0.1%) as exports rose 2.2% while imports grew 2.5%. The head of the national accounts commented that the decline in Q1 followed large increases in central government expenditure in the preceding quarter (overall growth in Q4 2025 was 0.8% Q/Q). In a supply side approach, value added in the business sector decreased 0.2% as added value in goods-producing rose 1.1% , but with a 0.8% decrease in services producing industries. Government value added fell by 0.2%. Even as solid household consumption is a positive, today’s mixed growth report supports the Riksbanks’ assessment that “there is scope to wait until there is a clearer picture of the effects of the war and the supply shocks it entails (May policy decision)”.The Riksbank has its next policy meeting on June 17. Markets discount no rate move at that meeting. For August about 75% of a 25 bps rate hike is discounted. After a protracted decline in the February/early April period, the krone recently regained its composure with EUR/SEK since mid-May easing from 11.00 to currently trad near 10.78.
Canada’s GDP Stalls in Q1 amid Import Surge and Weak Domestic Demand
The Canadian economy was essentially flat in Q1 2026 (-0.1% q/q annualized), coming in below both the consensus forecast (1.5% q/q) and the Bank of Canada’s 1.5% projection. Weakness reflected a sharp rise in imports, which offset a sizable inventory restocking, while underlying domestic demand was soft, with final domestic demand declining 0.4% q/q annualized.
Consumer spending grew 1.5% q/q (annualized) in Q1, easing from 2.9% in Q4. The gain was driven by services (+2.0%), while goods spending was much weaker (+0.7%), with declines in durable goods partially offset by gains in non-durables.
Residential investment declined 7.9% q/q (annualized), marking another weak quarter. The pullback was led by a sharp drop in ownership transfer costs (-9.9% q/q), alongside a small decline in new construction (-0.1%), reflecting slow resale activity and softer housing turnover.
Non-residential structures, equipment and machinery investment fell 3.2% q/q (annualized). A steep decline in engineering structures (-4.6% q/q) outweighed gains in machinery and equipment (+2.5%). Intellectual property products investment rose a healthy +13.8%.
Government spending declined modestly, with overall consumption down 1.0% q/q (annualized) and government investment dropping 9.6% q/q annualized, reversing the very strong gains seen in Q4 (24.6%). The pullback reflected lower investment in weapons systems following elevated levels late last year.
Net trade was a significant drag on growth. Exports fell 0.5% q/q (annualized) while imports surged 12.0%, driven in part by gold imports. As a result, net trade subtracted materially from GDP, more than offsetting the positive contribution from inventories.
On the monthly side, March industry GDP reported a 0.1% month-on-month (m/m) decline, while April's flash estimate points to a significant bounce-back (+0.4% m/m) to start Q2. On the industry side, GDP growth was +0.5% q/q in Q2 (annualized).
Key Implications
Well, that's certainly a disappointing report. The surge in first quarter imports was expected to drag on growth, but with residential investment, government spending and non-residential structures investment all posting contractions, there was no room for growth. That said, the wedge between the industry and expenditure measures of GDP, together with the strong flash estimate for April, suggest that growth should bounce back in the second quarter.
The disappointing first quarter figure likely overstates the weakness in the economy as net trade remains noisy and materially subtracted from first quarter growth. Domestic demand growth posted a small contraction but has vacillated between growth and small contractions since late 2024. Looking to Q2, some bounce-back should be expected. Nonetheless, the Canadian economy continues to operate well below capacity, posting a contraction in Q4 and no growth in Q1 – flirting with a technical recession. This suggests that ample slack remains, providing some offset to the inflationary forces coming from the energy shock. Our view remains that as the economy continues to operate below capacity, and if the inflation shock fades, the Bank of Canada will remain on the sidelines.
Stocks Celebrate Peace and AI Boom, FX Markets Stay More Cautious
Global markets are ending the week firmly in risk-on mode, but the enthusiasm is far from evenly distributed. Equity investors are aggressively embracing both AI-driven optimism and growing hopes that the United States and Iran are moving closer to a formal agreement extending the current ceasefire. Reports that negotiators have drafted a 60-day memorandum of understanding, including provisions to reopen the Strait of Hormuz and normalize Iranian oil exports, have fueled another leg lower in oil prices. Brent crude is now approaching the key $90 support level as traders increasingly price a normalization of global energy flows.
The biggest beneficiaries have been equity markets, particularly those tied to the AI theme. KOSPI and Nikkei surged to fresh record highs. Strong US futures suggest that S&P 500 and NASDAQ are going to extend their record-setting runs. European markets are participating in the rally too, but with considerably less enthusiasm. Investors appear to be focusing on the positive implications of lower energy costs, reduced shipping disruptions, and stronger technology demand. For stocks, the combination of peace optimism and AI investment is a powerful tailwind.
Foreign exchange markets, however, are telling a more nuanced story. Kiwi and Aussie are leading weekly performance tables, benefiting from the broader risk-on backdrop. New Zealand Dollar received an additional boost after senior RBNZ officials suggested today that not only is a July rate hike live, but policymakers could potentially consider a larger move if inflation risks continue to build. Aussie has also recovered despite softer domestic inflation data earlier in the week, suggesting investors remain comfortable holding cyclical currencies while risk appetite stays firm.
Yet the broader currency response remains remarkably restrained. Dollar has numerous reasons to weaken, including falling oil prices, easing geopolitical tensions, and record equity markets. Nevertheless, it is only modestly lower for the week and shows little sign of accelerating downside momentum. Part of the explanation is that FX traders remain more skeptical than equity investors about the durability of the peace process. Another factor is that recent inflation data and Fed commentary have significantly reduced expectations for policy easing, helping preserve Dollar's yield advantage.
Elsewhere, Swiss Franc outperforms despite easing geopolitical risks, reflecting expectations that lower oil prices could narrow inflation pressures and limit the need for tighter policy abroad. At the other end of the spectrum, Yen is the weakest performer of the week, though selling pressure remains surprisingly contained as traders remain wary of provoking intervention from Japanese authorities. Loonie is the second worst performer, dragged down by falling oil prices and disappointing Canadian GDP data.
The contrast between asset classes is apparent. Equity markets are pricing a future where diplomacy succeeds, oil prices normalize, and the AI investment boom continues uninterrupted. Currency markets appear far less willing to embrace that best-case scenario. For now, stocks are celebrating peace and technology, while FX traders continue to hedge against the possibility that the story may not unfold quite so smoothly.
Canada GDP Contracts in March, But Early April Rebound Signals Resilience
Canada's economy stumbled in March, but an estimated 0.4% rebound in April suggests the slowdown may not be lasting. Read More.
Fed's Schmid Warns Against Assuming Energy Shock Will Fade Quickly
Kansas City Fed President Jeffrey Schmid warned against assuming the energy-driven inflation shock will fade quickly, saying inflation remains too hot and policymakers must stay vigilant. Read More.
Bailey Pushes Back Against Rate Hike Expectations as BoE Waits for More Evidence
The BoE expects inflation to rise further, yet Bailey is signaling patience rather than preparing markets for tighter policy. Read More.
EUR/USD Stalls Below 1.1660 as Dollar Refuses to Break Despite US-Iran Ceasefire Extension
EUR/USD had every reason to break higher this week. Falling oil, peace optimism, and record stocks still were not enough to crack Dollar resilience. Read More.
Swiss KOF Barometer Edges Higher to 98.0, But Outlook Remains Subdued
Switzerland's KOF Barometer rose again in May, but weak manufacturing and softer consumer demand continue to cloud the outlook. Read More.
RBNZ Hints at Bigger Hikes as Kiwi Surge Accelerates: NZD/JPY and AUD/NZD Analysis
Hawkish RBNZ comments pushed Kiwi sharply higher, putting NZD/JPY near a major breakout and AUD/NZD under renewed pressure. Read More.
RBNZ Hawks Signal Rate Hikes Are Coming, July Meeting Now Live
Fresh comments from policymakers suggest the hurdle for a July rate hike may be lower than markets assume. The next six weeks of data could determine whether the RBNZ begins tightening soon. Read More.
New Zealand ANZ Business Confidence Turns Positive, Inflation Pressures Stay Contained
New Zealand business confidence jumped back into positive territory in May, while inflation and wage expectations eased despite ongoing economic uncertainty. Read More.
Tokyo Inflation Cools Further, But Strong Growth Data Keeps BoJ Normalization on Track
Tokyo inflation cooled for a sixth consecutive month, but stronger production, retail sales, and employment data suggest the BoJ's normalization path remains intact. Read More.
AUD/USD Daily Report
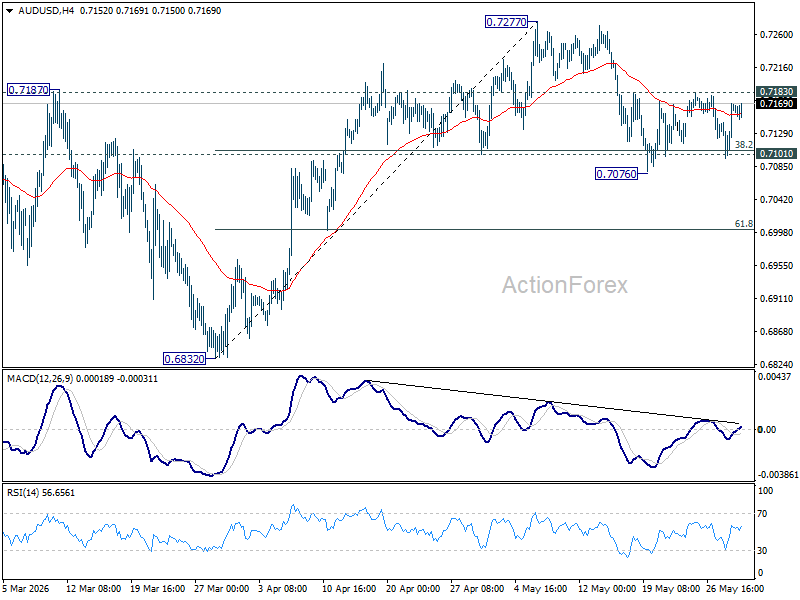
Range trading continues in AUD/USD and intraday bias stays neutral. On the upside, firm break of 0.7183 resistance will suggest that pullback from 0.7277 has completed. Stronger rally should then be seen to retest 0.7277 high. However, decisive break of 0.7076 will indicate that larger scale correction is underway and target 0.6832 support instead.
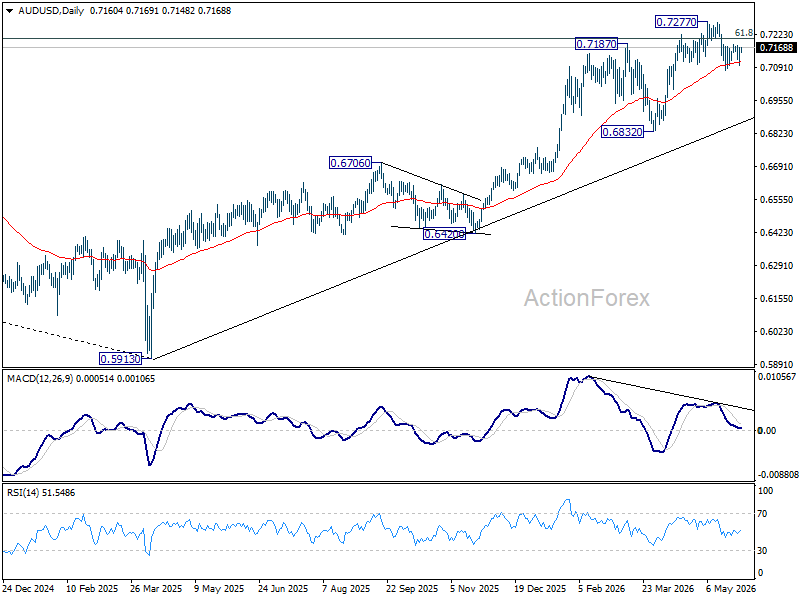
In the bigger picture, rise from 0.5913 (2024 low) is still in progress. Decisive break of 61.8% retracement of 0.8006 to 0.5913 at 0.7206 will solidify the case that it's already reversing the down trend from 0.8006 (2021 high). Further rally should then be seen to retest 0.8006. For now, outlook will remain bullish as long as 0.6832 support holds, in case of pullback.
Canada GDP Contracts in March, But Early April Rebound Signals Resilience
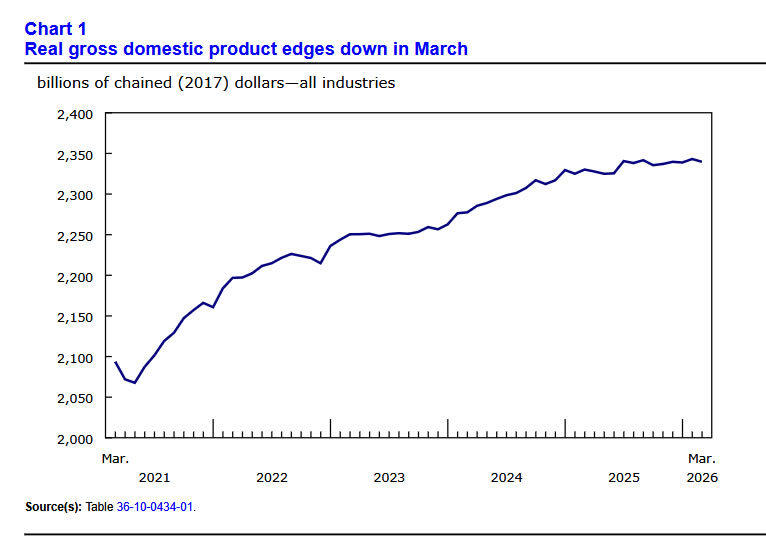
Canada's economy unexpectedly contracted by -0.1% mom in March, missing expectations for a 0.1% expansion and partially reversing February's 0.2% gain. The weakness was concentrated in goods-producing industries, which fell -0.8% and recorded their fifth decline in the past six months.
Lower activity in mining, quarrying, oil and gas extraction, as well as construction, accounted for much of the pullback. Services-producing industries provided some support, edging up 0.1% on stronger wholesale trade, but the gains were not enough to offset the broader weakness, with 8 of 20 industrial sectors posting declines.
The disappointing March figure capped a sluggish first quarter, with real GDP unchanged after a -0.2% contraction in Q4. Meanwhile, GDP per capita rose 0.2% qoq as Canada's population declined for a second consecutive quarter.
There was also a more encouraging signal from the start of Q2. Statistics Canada's advance estimate points to a 0.4% increase in April GDP, driven by gains in mining, oil and gas extraction, manufacturing, and transportation and warehousing. While some sectors, including agriculture and forestry, remained weak, the early rebound suggests March's contraction may prove temporary rather than the start of a broader downturn.
| Indicator | Previous | Actual | Expected |
|---|---|---|---|
| March GDP (MoM) | 0.2% | -0.1% | 0.1% |
| April GDP (Advance Estimate) | -0.1% | 0.4% | |
| Q1 GDP (QoQ) | -0.2% (Q4) | 0.0% | |
| GDP Per Capita (QoQ) | N/A | 0.2% |
Crypto: Just Enough Optimism to Halt the Decline
Market Overview
The crypto market capitalisation rose by 1% over the past 24 hours, rebounding from the local lows reached the previous day, thanks to a shift towards riskier assets. However, the cryptocurrency market remains 10% below its local peak in early May and 43% below its global peak in October last year. By comparison, over the same period, the Nasdaq 100 gained 4% and 21% respectively, challenging the notion of a direct correlation between these indices. This by no means indicates widespread negativity, as over the past 24 hours Stellar has gained 23%, IOTA 13% and Algorand 10%, whilst the worst-performing coins among those actively traded were Bitcoin Cash (-6.3%), Tron (-3.3%) and Filecoin (-2%).
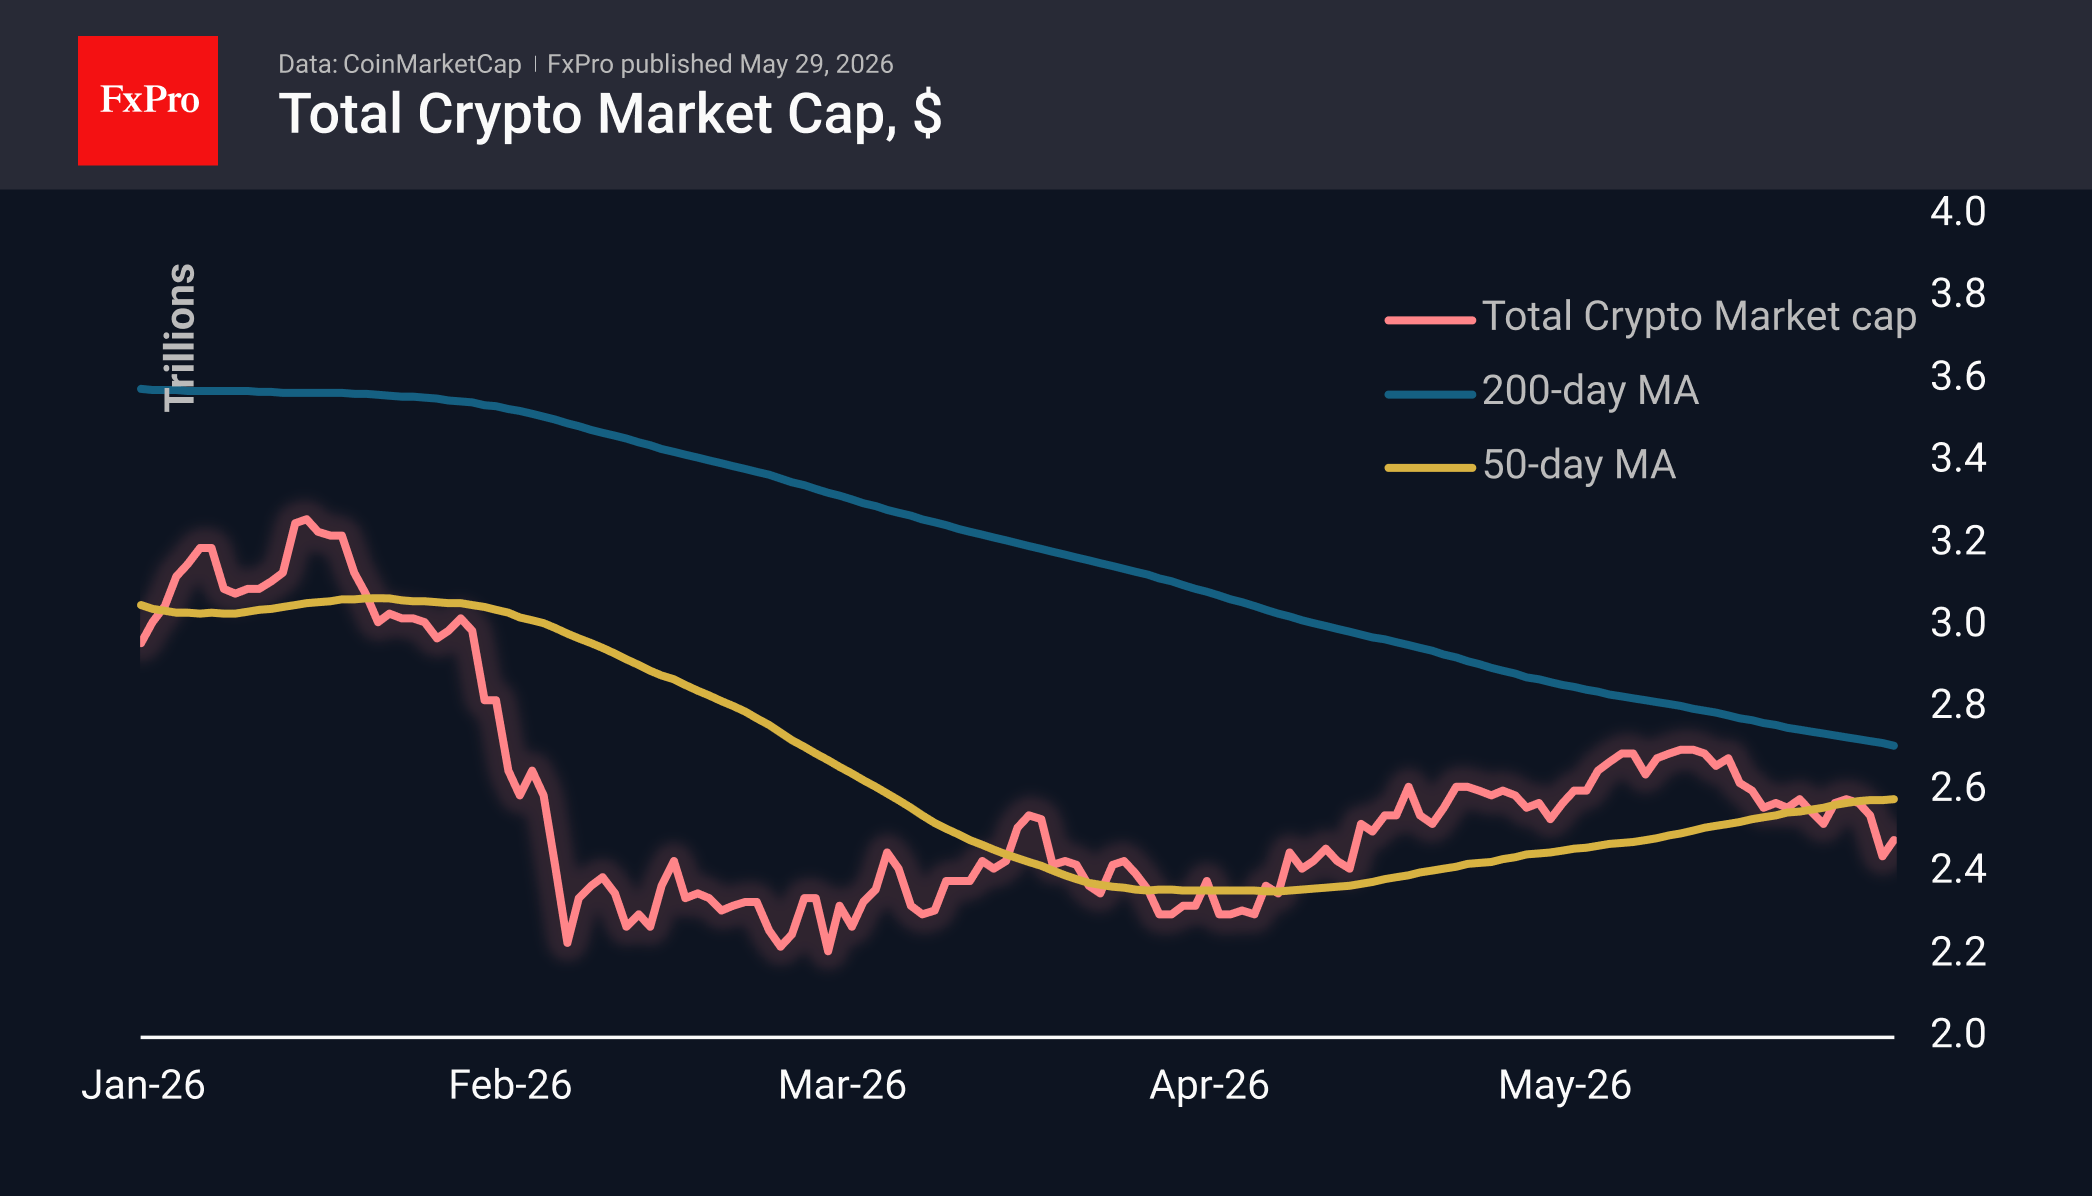
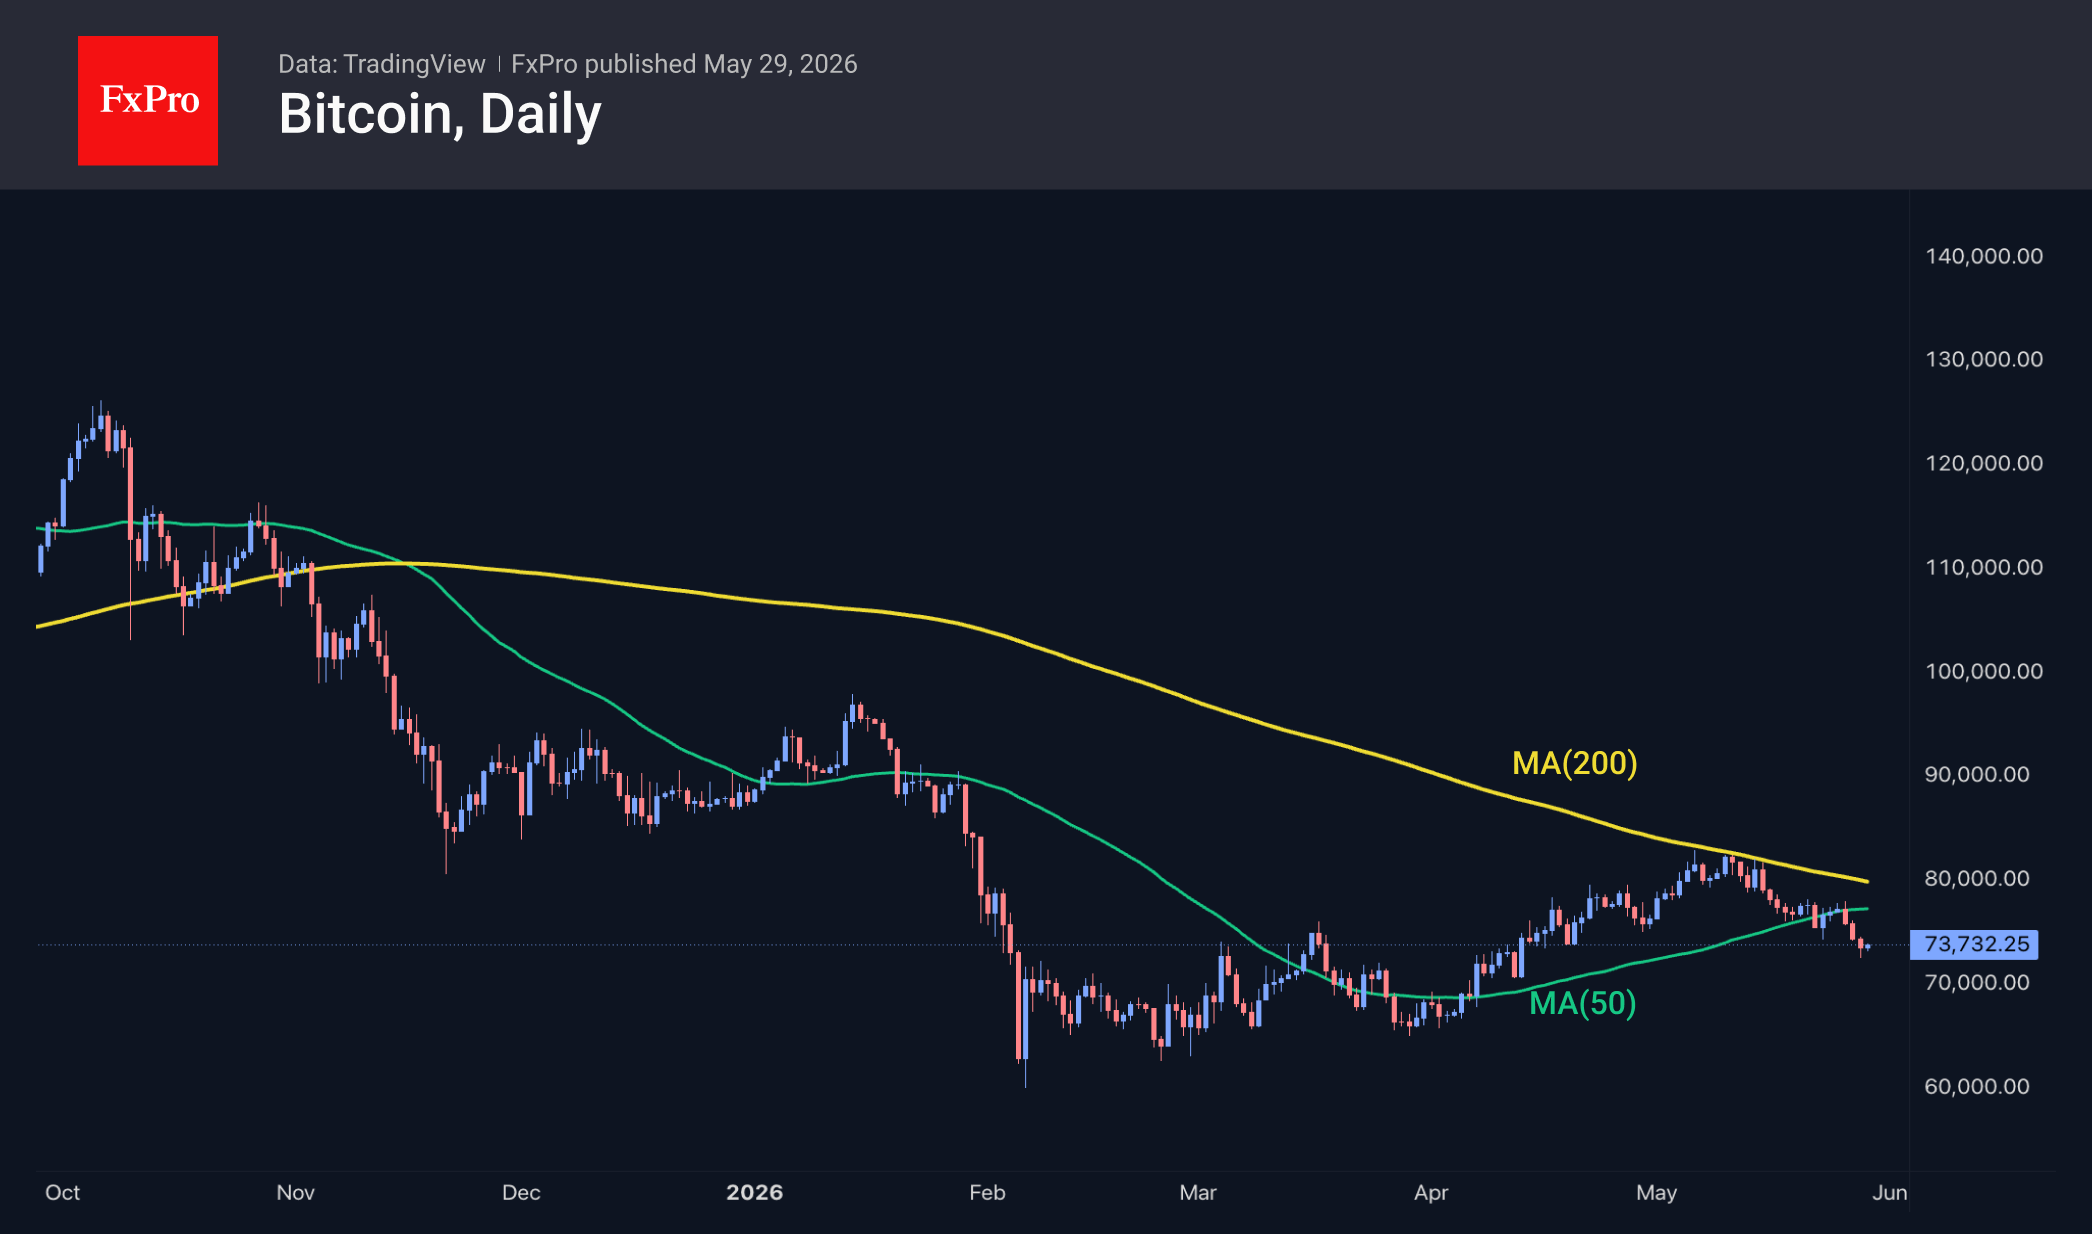
Bitcoin dipped below $73K on Thursday and is trading just above that level at the start of Friday. Weak performance against a backdrop of record highs in equities points to underlying demand weakness, entirely consistent with reports of outflows from institutional investors. Technicals are also on the sellers’ side, who are continuing to recoup the failure below the 50-day moving average following the failed attempt to breach the 200-day moving average earlier in May. Such buyer apathy keeps the possibility of a decline to the $65-67K range as the main scenario.
News Background
Bitcoin could fall to $60K by October, and only then will a new bullish trend begin, according to analyst Benjamin Cowen. In his view, the market is still moving within the framework of the ‘historical model’ of a four-year cycle, despite the launch of ETFs and growing demand from large investors.
The cryptocurrency industry is not ready for the transition to post-quantum cryptography, despite progress in post-quantum cryptography, according to developers at Quantus. They estimate that a direct transition to post-quantum signatures without changes to the BTC network architecture would drastically reduce the number of transactions per block.
According to Arkham Intelligence, US authorities have transferred altcoins totalling around $1.9 million to Coinbase Prime, the largest US crypto exchange. The Department of Justice may sell off altcoins before Bitcoin, as it considers BTC a reserve asset for long-term storage.
The crypto industry is stepping up pressure on US politics ahead of the congressional elections. Hundreds of millions of dollars have already been directed to supporting loyal candidates, and the balance is increasingly shifting towards the Republicans, notes CoinDesk.
EUR/USD Daily Outlook
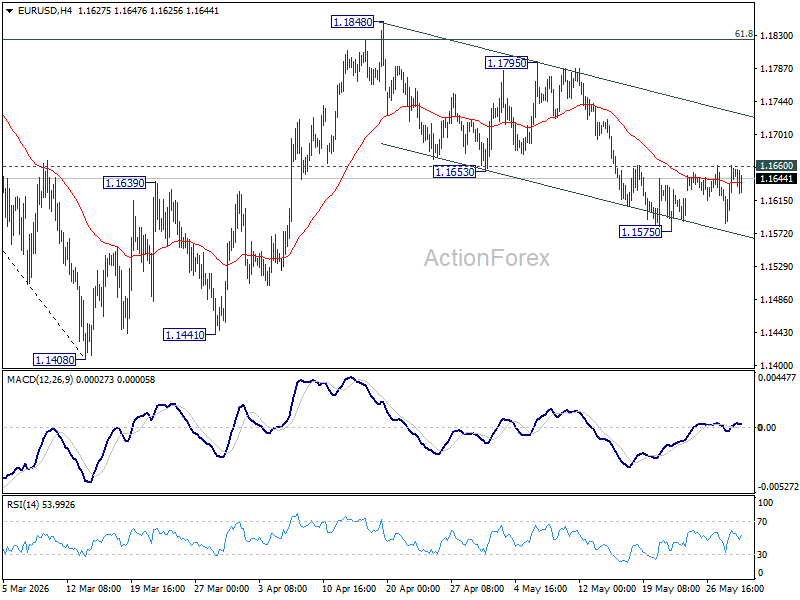
EUR/USD is still bounded in range of 1.1575/1660 and intraday bias remains neutral. On the upside, firm break of 1.1660 resistance will argue that fall from 1.1848 has completed as a correction at 1.1575. Intraday bias will be back on the upside for 1.1795 resistance first. On the downside, break of 1.1575 will solidify the case that rebound from 1.1408 has completed at 1.1848, and bring deeper fall back to retest 1.1408 low.
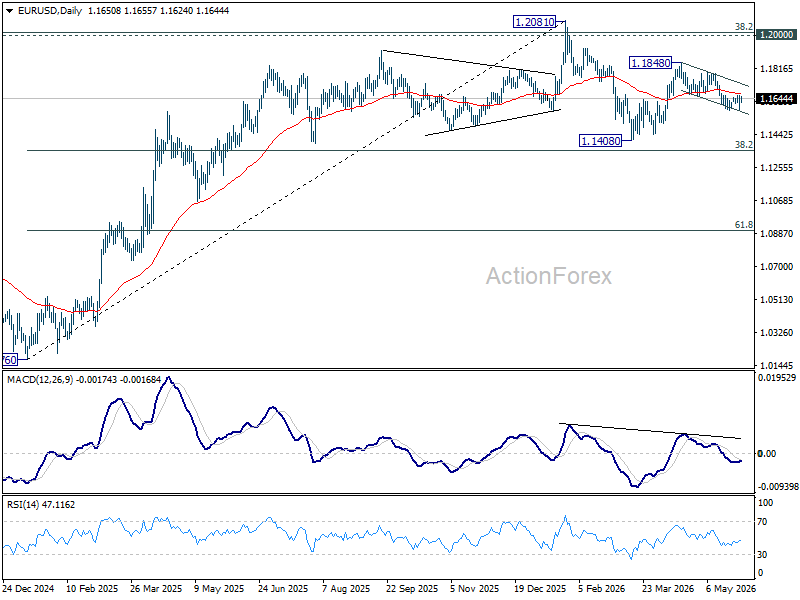
In the bigger picture, the strong support from 38.2% retracement of 1.0176 to 1.2081 at 1.1353 suggests that the pullback from 1.2081 is more likely a corrective move. Strong support was also found in 55 W EMA (now at 1.1544). Focus is back on 1.2 key cluster resistance level. Decisive break there will carry long term bullish implications. Nevertheless, break of 1.1408 support will revive the case of medium term bearish trend reversal.
USD/JPY Daily Outlook
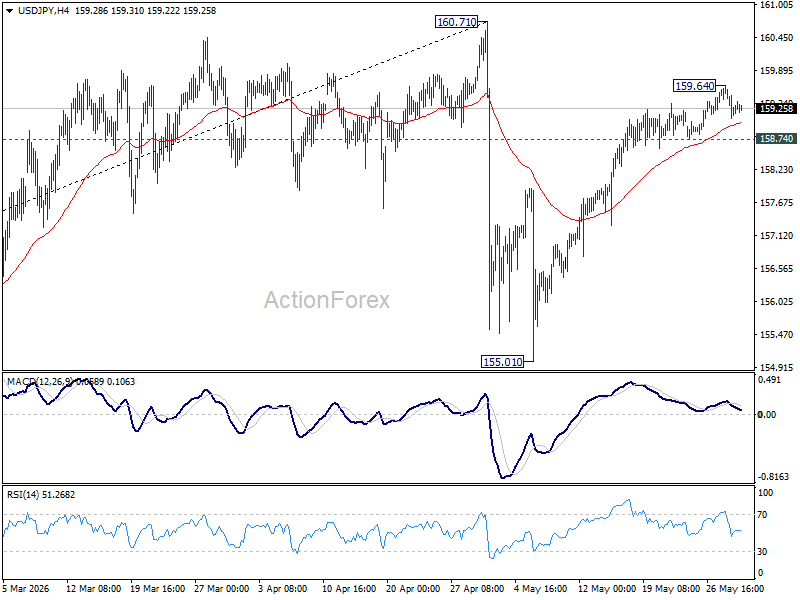
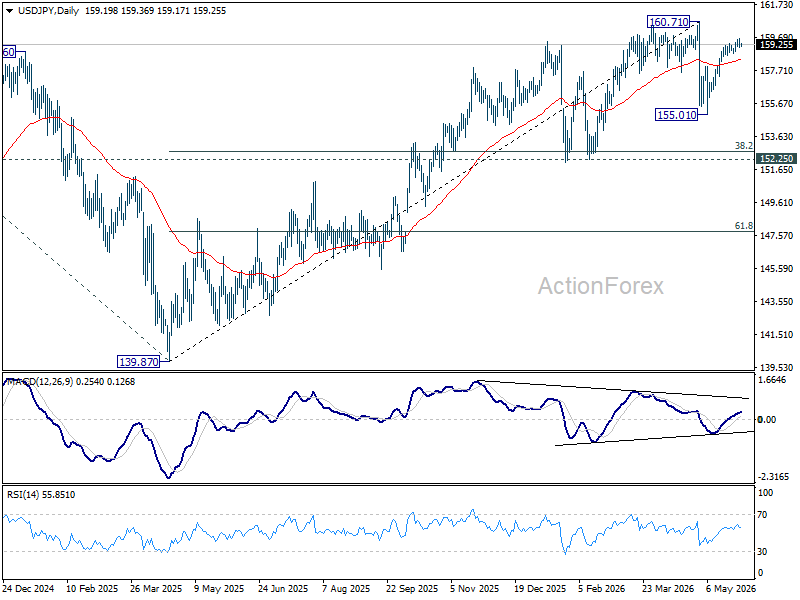
Intraday bias in USD/JPY is turned neutral with current retreat. Rise from 155.01 is seen as the second leg of the corrective pattern from 160.71. While another rise cannot be ruled out, upside should be limited by 160.71 resistance. On the downside, break of 158.74 minor support will turn bias to the downside for 55 D EMA (now at 158.36) and below.
In the bigger picture, for now, corrective pattern from 161.94 (2024 high) is still seen as completed at 139.87. Rise from there is seen as resuming the long term up trend. So, break of 161.94 is expected at a later stage to resume the long term up trend. However, sustained break of 55 W EMA (now at 154.53) will dampen this view and bring deeper fall back towards 139.87 to extend the pattern from 161.94.
GBP/USD Daily Outlook
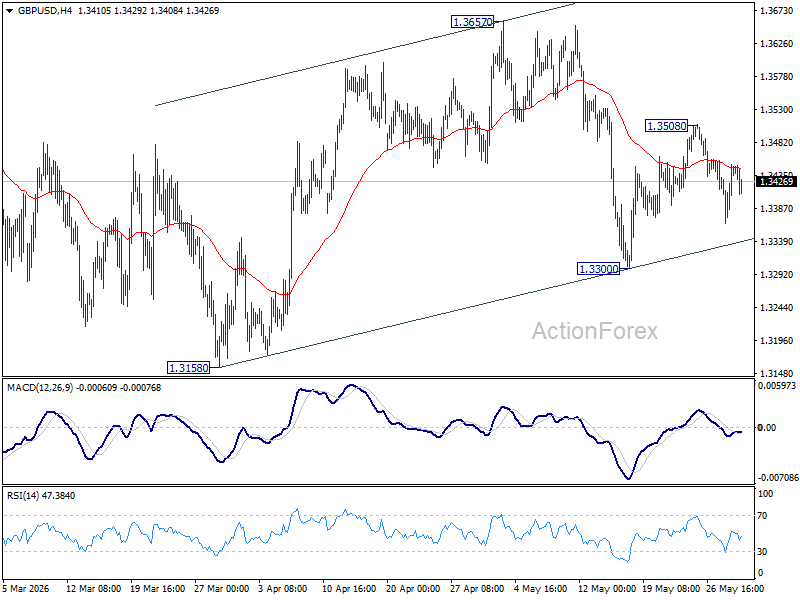
Intraday bias in GBP/USD is turned neutral first with current recovery. On the downside, break of 1.3300 will extend the fall from 1.3657 to 1.3158. On the upside above 1.3508 will extend the rebound from 1.3300 to 1.3657 resistance first.
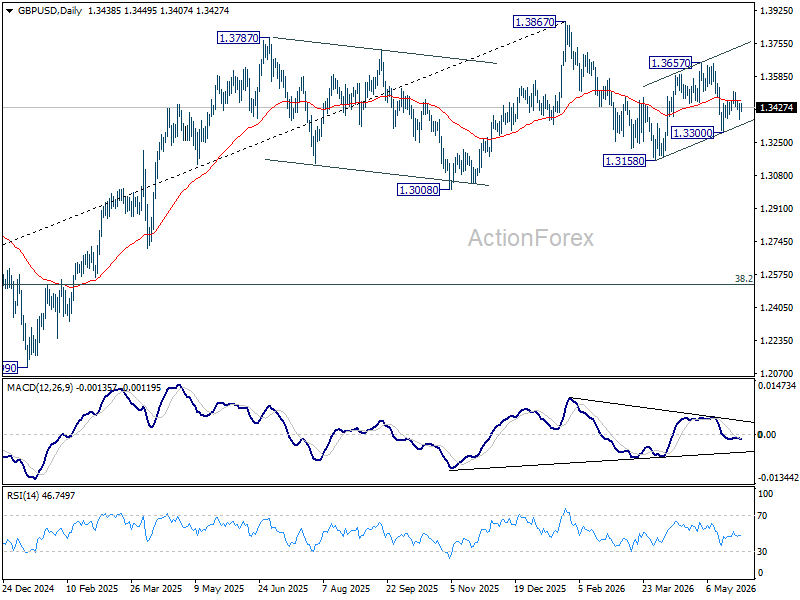
In the bigger picture, current development suggests that price actions from 1.3867 are merely a corrective pattern within the broader up trend from 1.0351 (2022 low). With 1.3008 support intact, medium term bullishness is maintained and break of 1.3867 is in favor for a later stage, towards 1.4248 key resistance (2021 high). However, firm break of 1.3008 will at least bring deeper fall to 38.2% retracement of 1.0351 to 1.3867 at 1.2524, with increased risk of bearish reversal.
USD/CHF Daily Outlook
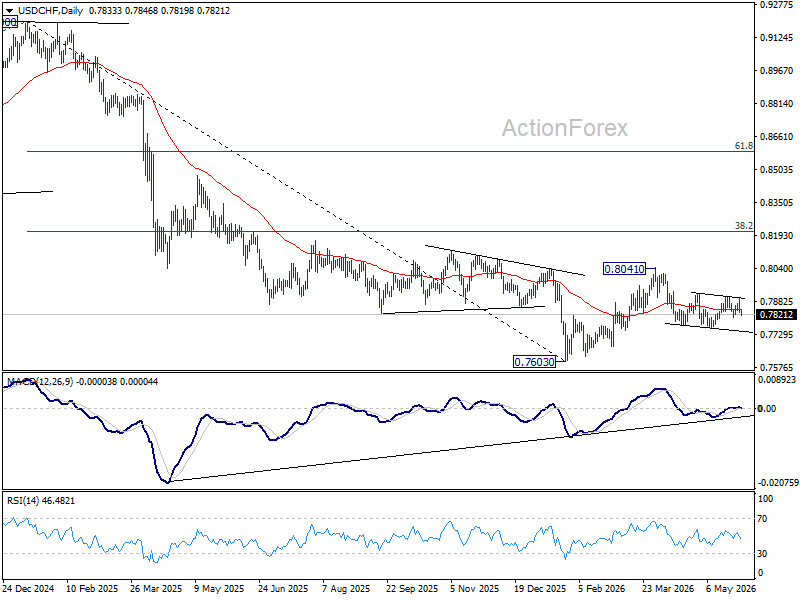
USD/CHF reversed after failing to break through 0.7906 resistance, but stays above 0.7807. Intraday bias remains neutral first. On the downside, firm break of 0.7807 will suggest that fall from 0.8041 is ready to resume through 0.7760. Nevertheless, decisive break of 0.7906/23 will indicate that fall from 0.8041 has already completed as a correction.
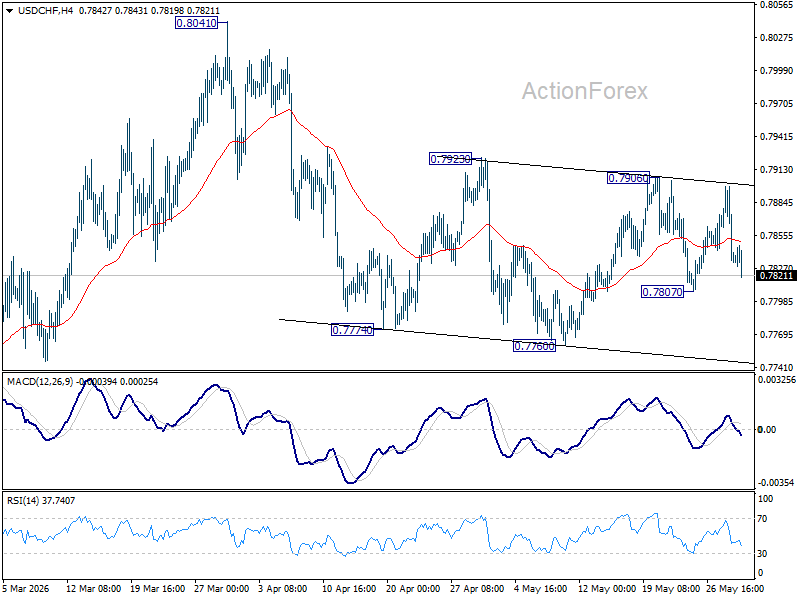
In the bigger picture, as long as 55 W EMA (now at 0.8035) holds, fall from 0.9200 is expected to continue, as part of the larger down trend. Firm break of 0.7603 will target 100% projection of 1.0146 (2022 high) to 0.8332 from 0.9200 at 0.7382.
AUD/USD Daily Report
Range trading continues in AUD/USD and intraday bias stays neutral. On the upside, firm break of 0.7183 resistance will suggest that pullback from 0.7277 has completed. Stronger rally should then be seen to retest 0.7277 high. However, decisive break of 0.7076 will indicate that larger scale correction is underway and target 0.6832 support instead.
In the bigger picture, rise from 0.5913 (2024 low) is still in progress. Decisive break of 61.8% retracement of 0.8006 to 0.5913 at 0.7206 will solidify the case that it's already reversing the down trend from 0.8006 (2021 high). Further rally should then be seen to retest 0.8006. For now, outlook will remain bullish as long as 0.6832 support holds, in case of pullback.