

Sample Category Title
Tokyo Inflation Cools Further, But Strong Growth Data Keeps BoJ Normalization on Track
Japan's inflation picture softened further in May, but the broader economy continued showing surprising resilience. Tokyo CPI core (excluding fresh food), widely viewed as a leading indicator of nationwide inflation trends, slowed from 1.5% yoy to 1.3% yoy, below expectations and marking the sixth consecutive month of deceleration. Headline inflation eased from 1.5% yoy to 1.4% yoy, while the closely watched core-core measure, excluding both fresh food and energy, slowed from 1.9% yoy to 1.6% yoy.
The decline in inflation was largely driven by government subsidies aimed at reducing utility, water, and tuition costs. However, policymakers are unlikely to take too much comfort from the softer readings. Analysts generally expect inflation to reaccelerate later this year as the impact of surging oil prices and a weak Yen feeds through to import costs. The persistence of Middle East-related energy risks remains particularly important for Japan, which remains heavily dependent on imported energy.
At the same time, activity indicators released for April painted a considerably stronger picture of the economy than expected. Industrial production rose 0.8% mom, sharply outperforming forecasts for a contraction. Manufacturers surveyed by the government expect output to surge another 5.1% in May. Retail sales also surprised to the upside with a 2.1% yoy increase, suggesting consumer demand remains relatively healthy despite higher living costs. The labor market also strengthened, with the unemployment rate falling from 2.7% to 2.5%, its lowest level in several months.
Taken together, the data reinforces that underlying economic conditions remain firm even as inflation temporarily cools. While softer CPI may reduce pressure for immediate tightening, resilient growth, a tight labor market, and expectations of renewed energy-driven inflation should keep policy normalization firmly on the table in coming months.
| Indicator | Previous | Forecast | Actual |
|---|---|---|---|
| Tokyo CPI Core (YoY) | 1.5% | 1.5% | 1.3% |
| Tokyo CPI Core-Core (YoY) | 1.9% | 1.6% | |
| Tokyo CPI Headline (YoY) | 1.5% | 1.4% | |
| Industrial Production (MoM) | -0.4% | 0.8% | |
| Industrial Production Outlook (May) | 5.1% | ||
| Industrial Production Outlook (June) | -0.4% | ||
| Retail Sales (YoY) | 1.4% | 1.3% | 2.1% |
| Unemployment Rate | 2.7% | 2.7% | 2.5% |
Gold (XAUUSD) Price Action Strong Elliott Wave Impulsive Reaction from Key Support Zone
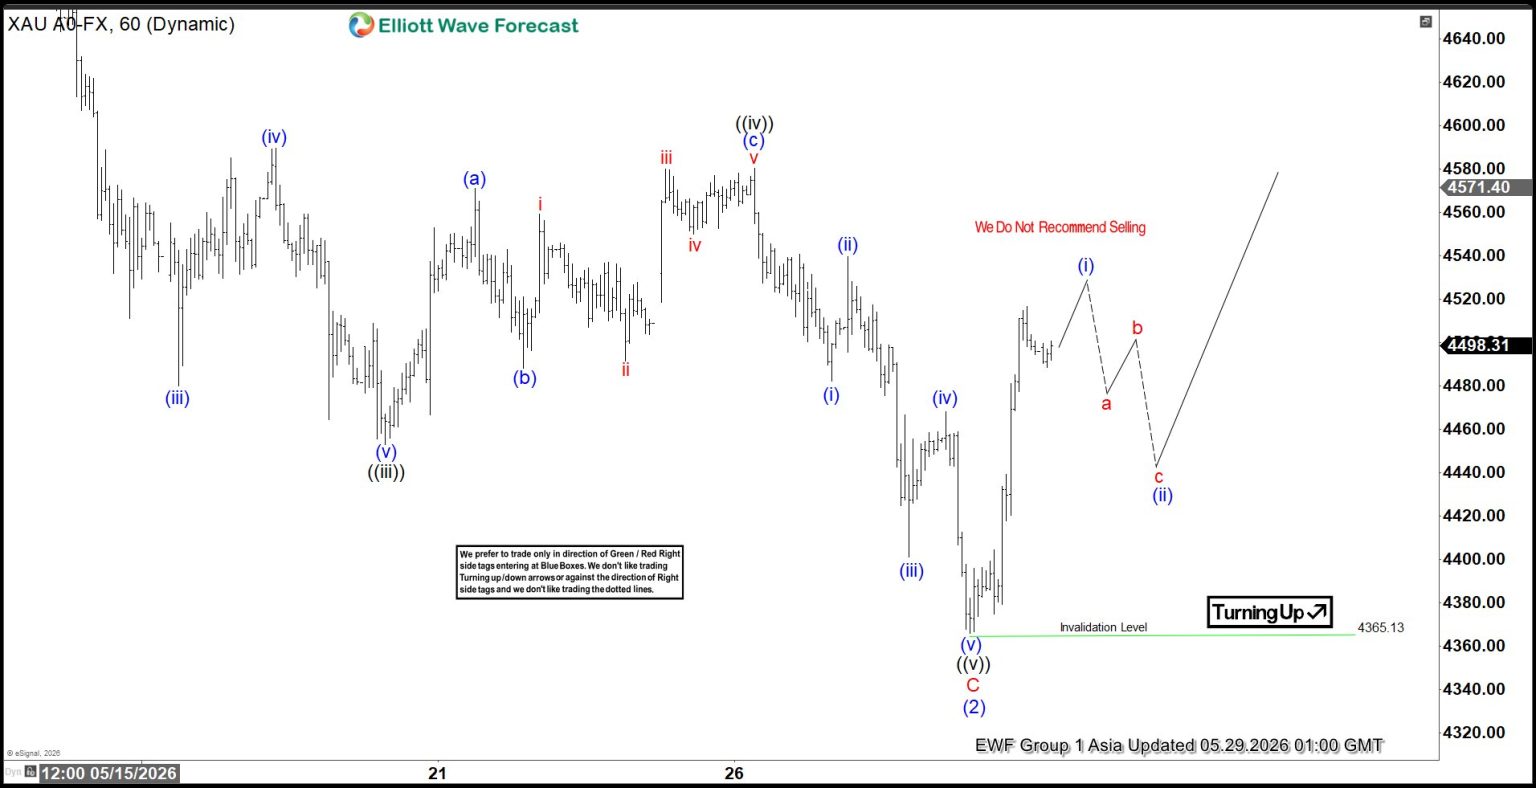
The short‑term Elliott Wave view in Gold (XAUUSD) shows that the yellow metal has completed a three‑swing correction from the April 17, 2026 high. The pullback unfolded as a zigzag, with wave A ending at $4499.92 and wave B at $4773.58. Gold then declined in wave C to $4365.13, completing wave (2) as seen on the one‑hour chart. This level sits inside the key support zone, where wave C equals the 100%–161.8% Fibonacci extension of wave A. The broader support area spans $4137–$4380.
After testing this zone, Gold began a strong impulsive rally. The advance signals renewed momentum, but confirmation requires a break above the April 17 peak at $4890.97, which marked the end of wave (1). In the near term, wave (i) of the new cycle should finish soon. A corrective pullback in wave (ii) is expected, addressing the cycle from the May 28, 2026 low before the rally resumes. As long as the pivot at $4365.13 holds, pullbacks should attract buyers. These retracements are likely to form in three or seven swings, supporting further upside. The structure suggests Gold has shifted from correction to impulsive advance, with the support zone providing the base for the next bullish phase.
Spot Gold (XAUUSD) 60-Minute Elliott Wave Chart
XAUUSD Elliott Wave Video:
https://www.youtube.com/watch?v=aOmnScRdvPw
Cliff Notes: AI Goes From Strength to Strength
Key insights from the week that was.
Australia’s main market event this week was the April CPI which came in slightly below consensus on a headline basis (0.4%, 4.2%yr). Volatile, policy-driven components related to travel drove the outcome – the Federal Government’s temporary halving of fuel excise and some state governments offering free public transport, while cancelled flights and refunds for holiday travel provided a partial offset. These dynamics were also the main factors behind household spending's April decline.
Trimmed mean inflation meanwhile met expectations (0.3%, 3.4%yr). Pass-through of higher fuel costs is evident in some areas – home-building costs registered its strongest monthly gain since November 2023. However, the pass-through is not unfolding as rapidly as we initially feared. While April’s outcome will give the RBA space to pause and assess in June, the risk of a larger and faster pass-through in coming months is material. We believe the RBA will feel compelled to resume raising the cash rate in the second half of the year as these risks crystalise.
In the run-up to Q1 GDP next Wednesday, we also received two partial indicators for investment.
Construction activity rose 3.4% in Q1, pushing annual growth to 6.3%yr. This outsized gain was mostly driven by a large mining infrastructure installation in WA – lumpy completions like these have a much smaller impact on National Accounts estimates which are reported on an accrual basis. Activity was weak elsewhere, residential construction dipping 0.6% despite a solid project pipeline, and public infrastructure works trending lower, down –3.2%.
Private CAPEX subsequently surprised to the upside, surging 6.5% in Q1 to be up 14.6% over the year. Data centres were responsible for almost all the increase: machinery and equipment spending in the information and telecommunications sector almost tripling (+196%) in Q1 alone. It should be noted that the net impact on GDP will be limited given the high import component of the data centre build-out. The second estimate of 2026/27 CAPEX plans provided an upgrade; adjusting for inflation, real investment intentions remained resilient as the Middle East conflict began.
While these headline estimates have their caveats, the underlying detail suggests there is some modest upside risk to Q1 GDP. Our preview will be published later today on Westpac IQ.
This week’s offshore data provided little fresh signal and, for the market, paled in significance to perceived progress towards a truce in the Middle East. Intermediated negotiations between the US and Iran continued throughout the week despite several US strikes on Iranian military assets in the Strait, which were perceived to be active threats to shipping and dealt with. The successful transiting of several ships was instead focused upon as evidence to an end to the conflict was near. Having tested the top of 2026’s range early last week, circa US$110 per barrel, the price of Brent crude has since fallen to around US$94.
As we go to press, reports suggest a 60-day ceasefire has been agreed to by the US and Iran, but this time it includes a full resumption of shipping through the Strait within a month. The intent is to allow supply of energy and other goods to resume, alleviating stress on the Iranian and global economy, while negotiations continue over Tehran’s nuclear program. President Trump still needs to agree to the deal, however. And, further ahead, while November’s US mid-term elections will, if necessary, arguably warrant an extension of the ceasefire to year end, the complexity and significance of the nuclear negotiations could see the conflict flare again in 2027. For the foreseeable future, the price of oil and downstream margins are likely to depend not only on the current balance of physical demand and supply, but also a heightened awareness of political risk.
Of this week’s US data, releases related to the consumer were most notable. The second estimate for US GDP was revised down from 2.0% annualised to 1.6%, in large part due to weaker consumption growth. At 1.4% annualised, the current consumer pulse is well below the historic trend circa 2.5% and looks to be entrenched – real personal consumption up just 0.1% in April as wage growth failed to keep pace with inflation (0.2%). Housing is also clearly under pressure, S&P Cotality house prices falling for a second consecutive month (-0.2%, +0.8%yr), and new home sales down 6.2% in April after March’s gain was halved from 7.4% to 3.4%.
FOMC members prioritising inflation risks is notable given the subdued pulse for housing demand. While market participants have been debating the probability of a fed funds rate hike(s) over the coming year, for activity it is the implications for the long end of the yield curve that matter most. The FOMC may find they do not need to hike, as we currently forecast, because inflation risks and fiscal uncertainty result in a modest uptrend in the US 10-year yield. Since mid-April, the US 10-year has risen as much as 40bps to 4.67% because of these factors. Now at 4.44%, we see it rising to 4.75% by mid-2028.
Peering Below the Surface
Topline data, on their own, can mislead. It pays to look below the surface to see the underlying trend.
- Headline data can sometimes mislead. One needs to delve into the detail to get the full story. Headline inflation was softer than expected in April, but underlying trends told a different story. Likewise, employment growth was weak in the month, but this was mostly seasonal and hours worked told a different story. Productivity growth is also likely to have been weak in Q1; again, business investment data give reason not to despair about the trend.
- The RBA has the knowledge and resources to delve into the detail and not be misled by the surface figures. It is clearly concerned about the possibility that the energy price shock will pass through to other prices at scale, keeping inflation high. New detailed datasets have become available that allow its staff to quantify some important relationships more accurately.
- The economy is a complicated thing, though, and it is possible that the RBA’s analysis of the outlook is missing some important trends and relationships. Structural change is especially hard to grapple with. Shifts in labour market trends and the consequences of the data centre boom might be being misunderstood, though hopefully not for long.
Recent data have tended to tell a different story than the headline figures would suggest. Headline inflation was soft in April, but underlying measures were still too high and, if anything, still drifting up. Employment was even weaker than seasonal patterns implied in the month, but the hours worked data told the opposite story. And productivity growth is likely to be reported to have been weak in the March quarter, but this is partly because much data centre investment is in the build phase, and will only add to GDP and productivity later.
These contrasts are all examples of why one can be misled by focusing on a few headline figures. Accurately assessing the state of the economy requires a considered view of the whole picture. There is no substitute for delving into all the data detail.
In doing so, one must also guard against seizing on the data detail that fits your preferred narrative. For example, we remain concerned that pass-through of fuel prices to the prices of other goods and services will be extensive, and we are seeing some evidence of pass-through in homebuilding costs and hospitality already in the April CPI. It is nonetheless also true that pass-through has so far been a bit less than we feared.
The RBA understands the subtleties of Australia’s economic data and has the resources to look below the surface properly. It will not jump to rash conclusions based on headline numbers. It will, however, want to take a pause to assess how dominant and lasting these below-the-surface trends will be.
To the extent that we can glean anything from the RBA’s latest communications, it is that – like us – they are worried about second-stage pass-through of energy costs. Recent research, which was presented to the May meeting of the Monetary Policy Board and discussed in a subsequent speech by the RBA’s chief economist, highlights that pass-through is larger and faster following a large shock than after a small one.
This is not exactly a new result. The RBA has known that the “Phillips curve” relationship between inflation and labour market slack is nonlinear for about three decades. Their main whole-economy model incorporates this nonlinearity, though it does not seem to be in the model used in the speech to highlight the different behaviour of inflation that it implies. And the linkage of this nonlinear relationship to the size of the shock is an implication of so-called “menu cost” models that has been known to other central banks for at least 20 years, both in theory and in other countries’ data, though this link wasn’t recognised when the original RBA nonlinearity paper was published.
Quantifying this effect accurately arguably had to wait until the dataset used in the recent research paper became available. The 1990s-era empirical result means it is nonetheless unlikely that the RBA’s existing forecasting framework would have entirely missed faster pass-through of larger supply shocks, even if the theory behind it was not fully recognised at the time. But the recent communication does speak to the balance of risks that the RBA perceives.
It is possible, though, that the RBA’s current analysis misses some other trends under the surface.
As highlighted by Westpac Economics colleague Ryan Wells’ note yesterday, as best as we can tell, official family forecasters’ views about the outlook for labour supply have diverged. Commonwealth Treasury shares our view that the underlying trend in the participation rate is up. This is a departure from its longstanding assumption that population ageing shrinks the workforce. As we have been highlighting for a while, the opposite is true in Australia and most other advanced economies. By contrast, the RBA’s forecast is for a flat participation rate this year and a decline next year as job opportunities diminish. The labour demand effect is assumed to dominate.
To be fair, Assistant Governor Hunter’s speech did acknowledge that extra labour supply is a possible response to cost-of-living pressures, citing a recent IMF working paper that used Australian data to show this. But they acknowledge it only as a risk, not as their base case. It is also a cyclical factor, not the underlying trend discussed above. Past RBA communication has acknowledged this upward trend, but the latest Statement on Monetary Policy did not mention it. As Ryan commented in his note, the labour demand effect will have to work hard to offset this trend and generate the decline the RBA assumes.
(As an aside, I find it interesting that this paper was released as an IMF Working Paper and not an RBA Research Discussion Paper. Yes, three of the authors are from the IMF, but one is the deputy head of the RBA’s Economic Research department and likely the only one authorised to access the detailed tax and Census linked dataset directly. Likewise, it is interesting that the speech cited the paper in the context of cost-of-living pressures, not the – admittedly small at a macro level – positive labour supply response to monetary policy that the paper focused on.)
It is also possible that the RBA’s forecasting framework has not fully absorbed the implications of the build phase of the AI boom. Capex data released recently shows a huge contribution from data centres and IT investment more broadly – bigger than even our top-of-market expectation. Business investment will be strong, but as Westpac Economics colleague Pat Bustamante points out today, the imported component is very large, especially in the fit-out stage. A fixed view of potential growth in supply capacity will interpret this growth as adding to capacity pressures, even though it is literally building capacity. And like the mining investment boom, the build phase actually drags on measured productivity, as workers labour to build capital stock that is not yet producing anything.
Will a weak outcome for measured labour productivity in Q1 nudge the RBA to become even gloomier about ongoing productivity trends, even though it is likely a temporary lag?
Let’s hope the team at the RBA remember to look below the surface.
Memorandum Is Finalized but Its Agreement Is Still Pending – Dow Jones, Nasdaq and S&P 500 Intraday Levels
- Markets are rallying due to the finalization of the Peace Memorandum, but final agreement by Trump and Khamenei are still awaited
- While Nasdaq continues to price heaven and shoot for it, the DJIA is surprisingly unchanged
- Exploring Technical Levels for the Dow Jones, Nasdaq and S&P 500
Stock Markets are rallying after major diplomatic progress, as negotiators have finalized the draft of the much-anticipated US-Iran Peace Memorandum. Still, the deal is not yet official.
Axios reports that while the main framework is set, final approval is needed from both President Trump, who has asked for a few more days to review the terms, and Supreme Leader Khamenei, before the agreement is signed.
The draft shows a more balanced agreement, still tilting towards the US. The main points include keeping the Strait of Hormuz open and gradually lifting the US naval blockade over the next 30 days.
The draft also calls for Iran to get rid of its highly enriched nuclear material and allows for free commercial transit in the region.
In return, Iran will have key financial assets unfrozen, some economic sanctions lifted, and new systems set up for more humanitarian aid.
Even with this major diplomatic breakthrough, energy markets are reacting quietly today. WTI Crude Oil is almost unchanged and remains below $90 as traders wait for clear signs that the strait will reopen. Brent crude fell sharply and is now trading close to WTI, as the international risk premium has disappeared.

Daily Market Performance (14:28). May 28, 2026 – Courtesy of Finviz
The tech-focused Nasdaq is rising quickly, led by gains in semiconductor and large tech companies, running for yet another all-time high, but the rise isn’t uniform, with the Dow Jones Industrial Average mostly flat.
Outside of the tech sector, most of the market is quiet, as big investors wait for the final diplomatic approvals by the respective US and Iran leaders.
Now, let’s take a look at the intraday charts and trading levels for the Dow Jones Industrial Average, Nasdaq Composite, and S&P 500.
Current Session's Stock Heatmap
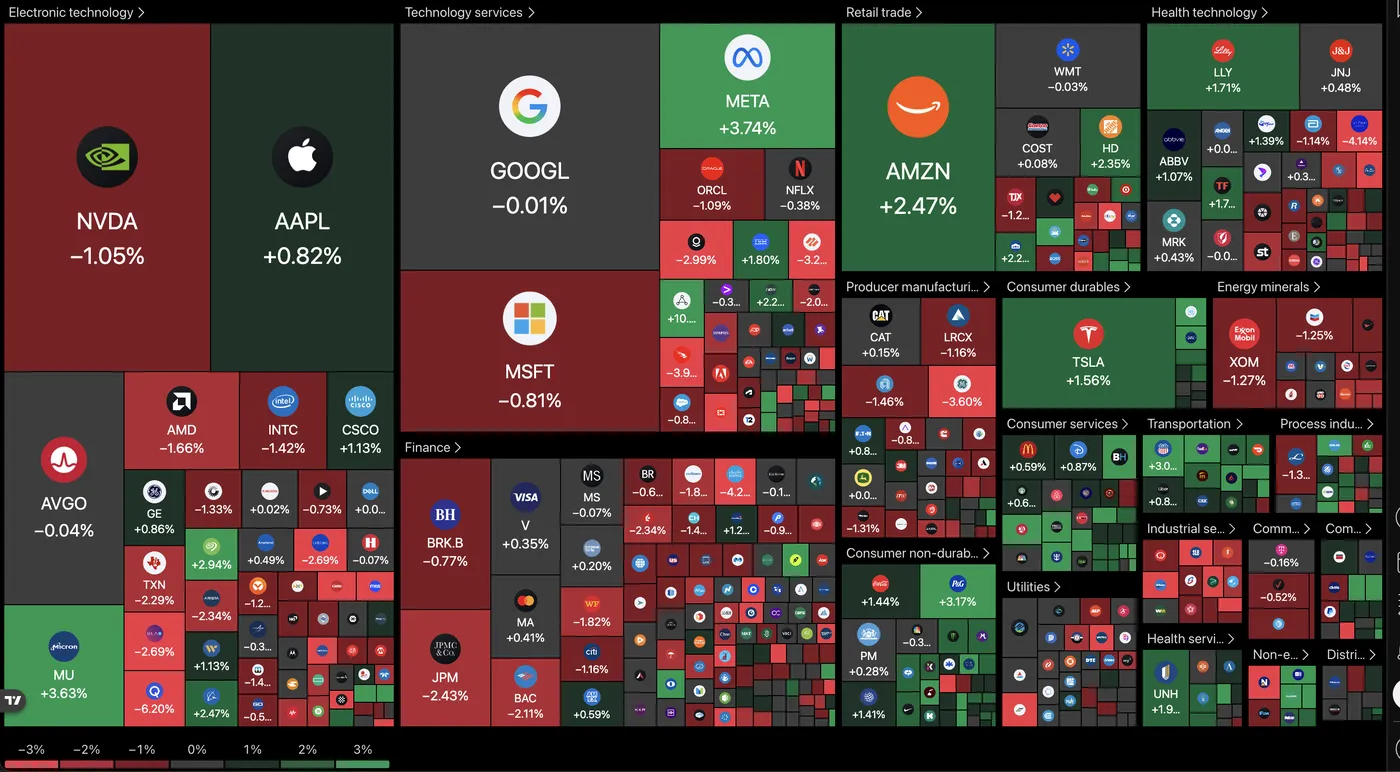
Current picture for the Stock Market (14:32) – Source: TradingView – May 28, 2026
Dow Jones 4H Chart and Trading Levels
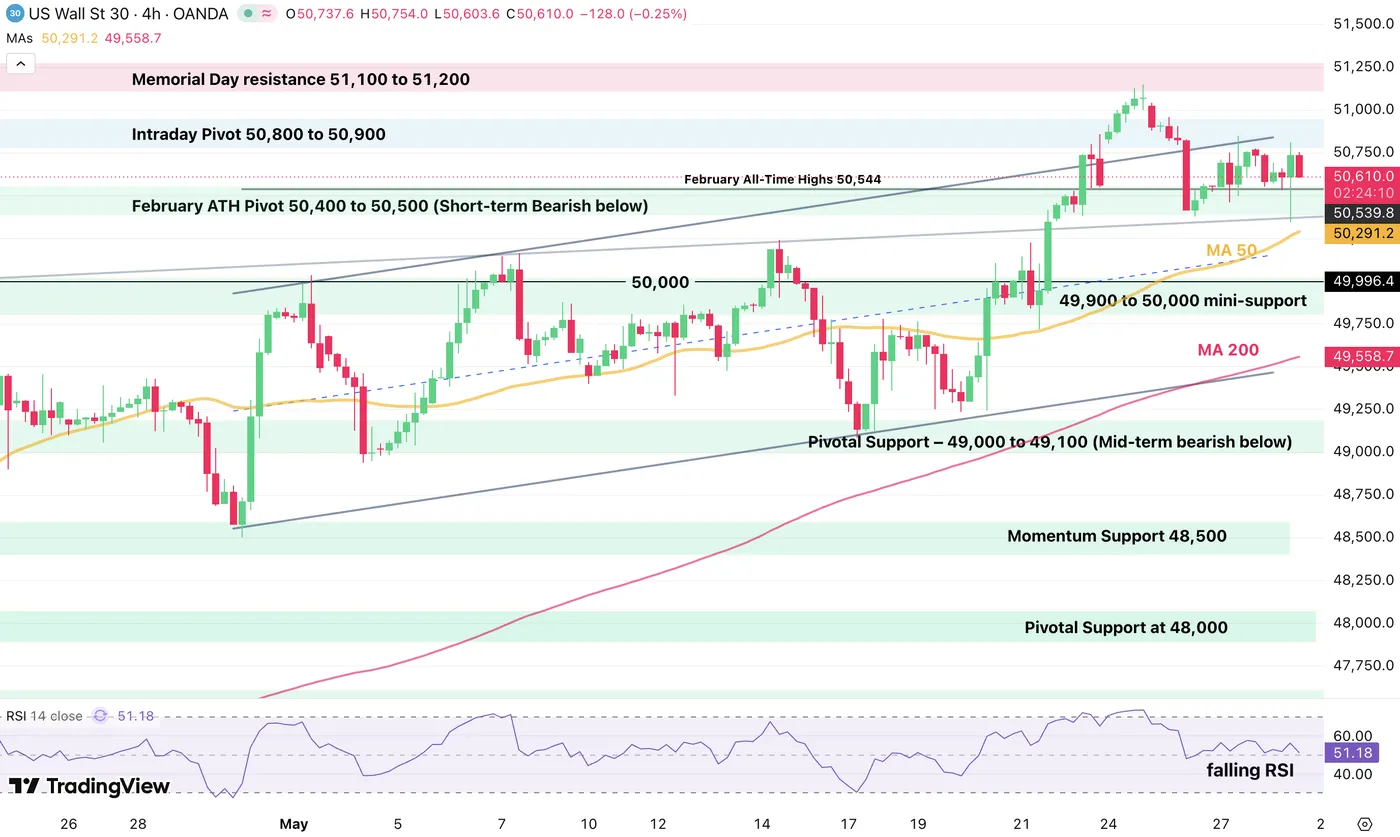
Dow Jones (CFD) 4H Chart – May 28, 2026 – Source: TradingView
Bulls are actually struggling to push the DJIA above the 50,750 major momentum pivot, despite a strong morning candle.
This indicates a potential for a wider pullback, particularly if sellers push the action below the 4H 50-period MA (50,291).
Dow Jones technical levels for trading:
Resistance Levels
- Intraday Pivot 50,750 to 50,900 (morning highs)
- Memorial Day resistance 51,100 to 51,200
Support Levels
- February ATH Pivot 50,400 to 50,500 (Short-term Bearish below)
- Pivotal Support – 49,000 to 49,100 (mid-term bearish below)
- Momentum Support 48,500
- Pivotal Support at 48,000
- Mini Support 47,400 to 47,600
Nasdaq 4H Chart and Trading Levels
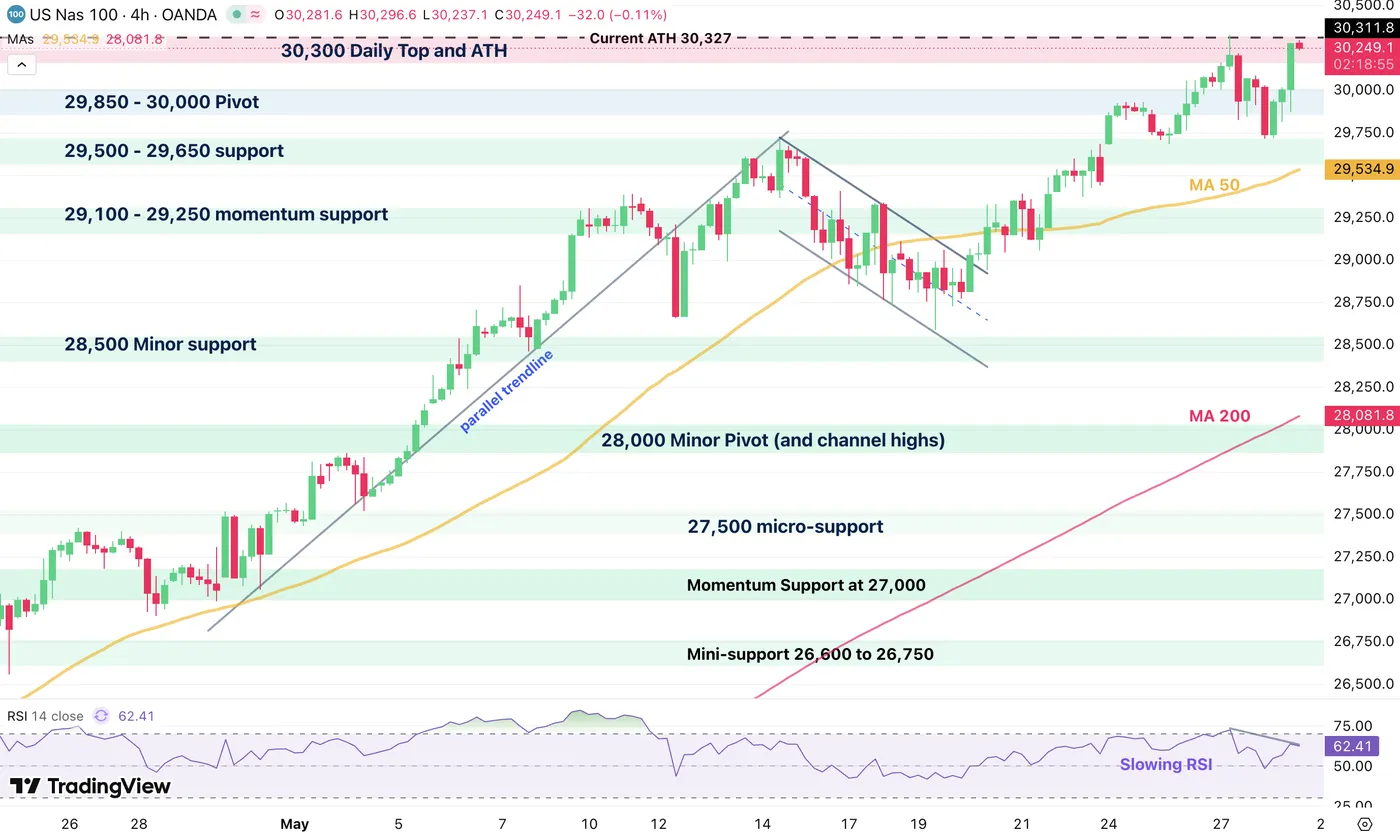
Nasdaq (CFD) 4H Chart – May 28, 2026 – Source: TradingView
Nasdaq is attempting a run to new record highs but the action is stalling as we speak right around the previous 30,300 ATH.
Forming a bearish divergence, bulls will actually want to see a clean break in order to push for more price discovery – A rejection however would lead to at least a 29,535 retest (4H 50-Period MA)
Nasdaq technical levels of interest:
Resistance Levels
- 30,300 Daily Top and ATH
- Current ATH 30,327 on the CFD
Support Levels
- 29,535 retest (4H 50-Period MA)
- 29,500 - 29,650 Pivot
- 29,100 - 29,250 momentum support (short-term bearish below)
- 28,000 minor support
- Prior ATH Support 26,200 to 26,300
S&P 500 4H Chart and Trading Levels
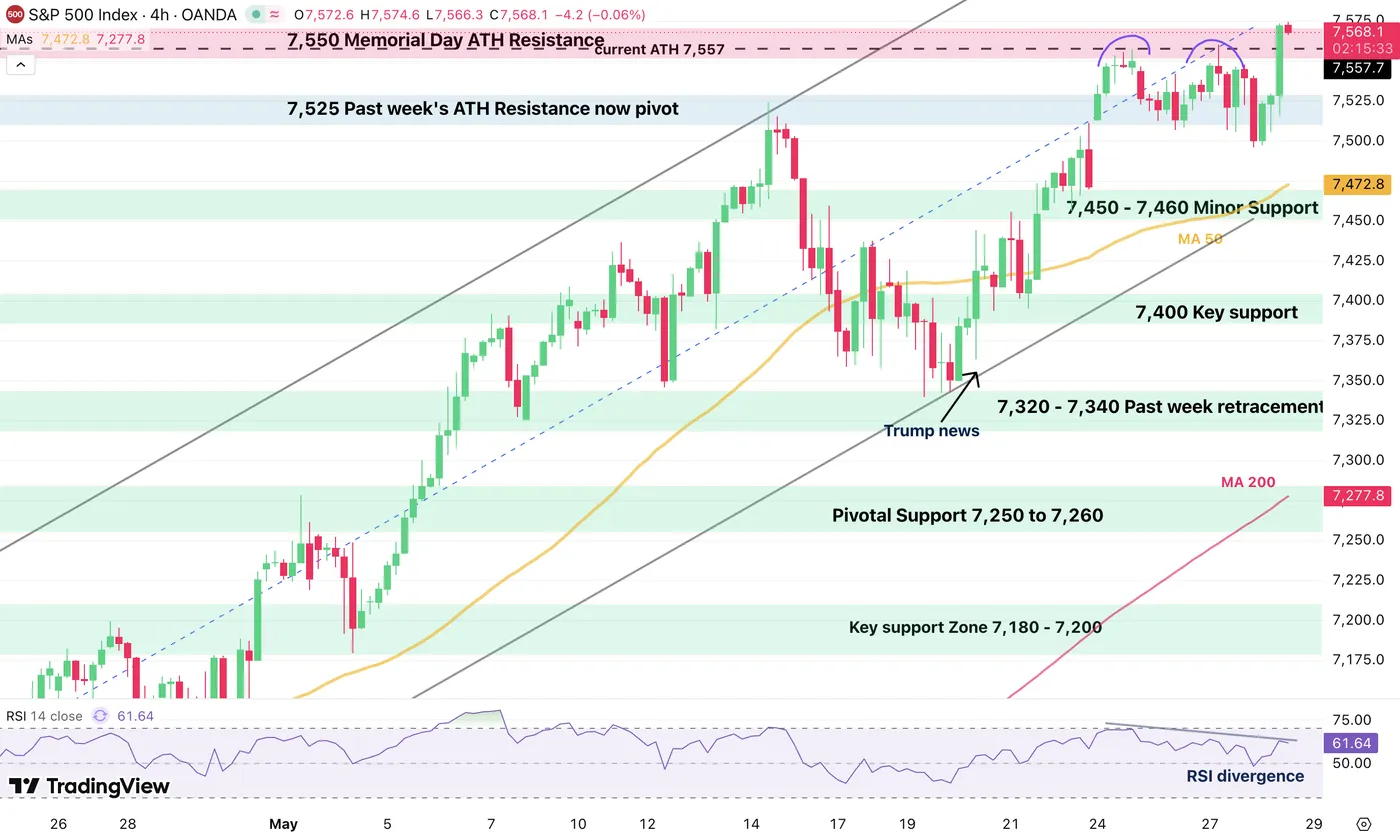
S&P 500 (CFD) 4H Chart – May 28, 2026 – Source: TradingView
The S&P 500 is actually the only index reaching new record highs in today's session, but also forming a bearish divergence at the same time.
This indicates that despite the new record, momentum is not as strong as indicated – This could precede a larger pullback to 7,500.
If the bullish action continues however, 7,600 is the next step.
S&P 500 technical levels of interest:
Resistance Levels
- 7,550 - 5,770 Memorial Day ATH Resistance (double top!)
- current ATH 7,575
Support Levels
- 7,525 Past week's ATH Resistance now pivot
- 7,450 - 7,460 Minor Support (Short-term bearish below – 4H 50-period MA (7,448)
- 7,400 Key support
- Pivotal Support 7,250 to 7,260
- Prior ATH Pivot 7,000 to 7,020
Keep track of WTI Crude and the latest headlines throughout the week to stay ahead of the game.
These are my final pieces on MarketPulse, so thank you for all who enjoyed the posts since a bit more than a year – I wish you success in the World of Trading and a long life in Markets.
Eco Data 5/29/26
| GMT | Ccy | Events | Act | Cons | Prev | Rev |
|---|---|---|---|---|---|---|
| 23:30 | JPY | Tokyo CPI Y/Y May | 1.40% | 1.50% | ||
| 23:30 | JPY | Tokyo CPI Core Y/Y May | 1.30% | 1.50% | 1.50% | |
| 23:30 | JPY | Tokyo CPI Core-Core Y/Y May | 1.60% | 1.90% | ||
| 23:30 | JPY | Unemployment Rate Apr | 2.50% | 2.70% | 2.70% | |
| 23:50 | JPY | Industrial Production M/M Apr P | 0.80% | -0.30% | -0.40% | |
| 23:50 | JPY | Retail Trade Y/Y Apr | 2.10% | 1.30% | 1.70% | 1.40% |
| 01:00 | NZD | ANZ Business Confidence May | 10 | -10.6 | ||
| 01:00 | NZD | ANZ Activity Outlook May | 25.6 | 19.6 | ||
| 05:00 | JPY | Housing Starts Y/Y Apr | 11.40% | 14.70% | -29.30% | |
| 05:00 | JPY | Consumer Confidence Index May | 33.6 | 32.5 | 32.2 | |
| 06:45 | EUR | France GDP Q/Q Q1 | -0.10% | 0.00% | 0.00% | |
| 07:00 | CHF | KOF Leading Indicator Apr | 98 | 98 | 97.9 | 97.8 |
| 07:55 | EUR | Germany Unemployment Change Apr | -12K | 10K | 20K | |
| 07:55 | EUR | Germany Unemployment Rate Apr | 6.30% | 6.40% | 6.40% | |
| 12:00 | EUR | Germany CPI M/M May P | -0.20% | 0.10% | 0.60% | |
| 12:00 | EUR | Germany CPI Y/Y May P | 2.60% | 2.80% | 2.90% | |
| 12:30 | CAD | GDP M/M Mar | -0.10% | 0.10% | 0.20% | |
| 12:30 | USD | Goods Trade Balance (USD) Apr P | -82.4B | -88.6B | -87.9B | -85.3B |
| 13:45 | USD | Chicago PMI May | 62.7 | 51.3 | 49.2 |
| 23:30 | JPY |
| Tokyo CPI Y/Y May | |
| Actual | 1.40% |
| Consensus | |
| Previous | 1.50% |
| 23:30 | JPY |
| Tokyo CPI Core Y/Y May | |
| Actual | 1.30% |
| Consensus | 1.50% |
| Previous | 1.50% |
| 23:30 | JPY |
| Tokyo CPI Core-Core Y/Y May | |
| Actual | 1.60% |
| Consensus | |
| Previous | 1.90% |
| 23:30 | JPY |
| Unemployment Rate Apr | |
| Actual | 2.50% |
| Consensus | 2.70% |
| Previous | 2.70% |
| 23:50 | JPY |
| Industrial Production M/M Apr P | |
| Actual | 0.80% |
| Consensus | -0.30% |
| Previous | -0.40% |
| 23:50 | JPY |
| Retail Trade Y/Y Apr | |
| Actual | 2.10% |
| Consensus | 1.30% |
| Previous | 1.70% |
| Revised | 1.40% |
| 01:00 | NZD |
| ANZ Business Confidence May | |
| Actual | 10 |
| Consensus | |
| Previous | -10.6 |
| 01:00 | NZD |
| ANZ Activity Outlook May | |
| Actual | 25.6 |
| Consensus | |
| Previous | 19.6 |
| 05:00 | JPY |
| Housing Starts Y/Y Apr | |
| Actual | 11.40% |
| Consensus | 14.70% |
| Previous | -29.30% |
| 05:00 | JPY |
| Consumer Confidence Index May | |
| Actual | 33.6 |
| Consensus | 32.5 |
| Previous | 32.2 |
| 06:45 | EUR |
| France GDP Q/Q Q1 | |
| Actual | -0.10% |
| Consensus | 0.00% |
| Previous | 0.00% |
| 07:00 | CHF |
| KOF Leading Indicator Apr | |
| Actual | 98 |
| Consensus | 98 |
| Previous | 97.9 |
| Revised | 97.8 |
| 07:55 | EUR |
| Germany Unemployment Change Apr | |
| Actual | -12K |
| Consensus | 10K |
| Previous | 20K |
| 07:55 | EUR |
| Germany Unemployment Rate Apr | |
| Actual | 6.30% |
| Consensus | 6.40% |
| Previous | 6.40% |
| 12:00 | EUR |
| Germany CPI M/M May P | |
| Actual | -0.20% |
| Consensus | 0.10% |
| Previous | 0.60% |
| 12:00 | EUR |
| Germany CPI Y/Y May P | |
| Actual | 2.60% |
| Consensus | 2.80% |
| Previous | 2.90% |
| 12:30 | CAD |
| GDP M/M Mar | |
| Actual | -0.10% |
| Consensus | 0.10% |
| Previous | 0.20% |
| 12:30 | USD |
| Goods Trade Balance (USD) Apr P | |
| Actual | -82.4B |
| Consensus | -88.6B |
| Previous | -87.9B |
| Revised | -85.3B |
| 13:45 | USD |
| Chicago PMI May | |
| Actual | 62.7 |
| Consensus | 51.3 |
| Previous | 49.2 |
Fed’s Musalem Rejects AI Optimism as Substitute for Vigilant Monetary Policy
St. Louis Federal Reserve President Alberto Musalem pushed back against growing optimism that artificial intelligence-driven productivity gains could eventually solve the inflation problem and justify easier monetary policy. Speaking at an economic conference in Reykjavik, Musalem warned that it would be dangerous for the Fed to rely on hypothetical future productivity improvements while inflation remains well above target and inflation expectations continue drifting higher. “I believe it would be risky to rely on the prospect of higher productivity growth in the future to solve our inflation problem today,” he said.
Musalem argued that the better approach is to maintain “a vigilant monetary policy focused on restoring price stability.” His remarks highlight an increasingly important debate emerging inside the Federal Reserve between policymakers who believe AI could eventually become structurally disinflationary and officials who insist the Fed cannot base current policy on uncertain future technological gains. Musalem acknowledged that AI could eventually improve productivity, but stressed that “the jury is out” on how much benefit it will ultimately generate. In the meantime, he noted that AI investment is already contributing to stronger demand for chips, data centers, and infrastructure, potentially adding to inflation pressures rather than reducing them.
The St. Louis Fed president also warned that prematurely easy monetary policy could damage the Fed’s inflation-fighting credibility. “Moving or holding policy rates too low could actually cause longer-term interest rates to rise,” Musalem said, if investors begin questioning whether the central bank is truly committed to returning inflation to the 2% target.
Sunset Market Commentary
Markets
In the ‘glass half full, glass half empty’ dynamics, markets this morning titled to a more risk averse bias as mutual attacks and accusations of breaching the ceasefire between the US and Iran suggested that there was little progress on the way to a sustainable deal. Applying the standard reaction function, oil prices, yields and the dollar gained. Equities ceded some ground. Even so, moves were very modest and even evaporated throughout the session. Brent oil at $96.3 stays below the $100 barrier. A tentative USD rebound was also (more than) reversed (DXY currently 99.15, EUR/USD rebounded from sub 1.16 to currently 1.1635). The Eurostoxx 50 cedes 0.4%. (US) yields opened higher but already traded off intraday ‘highs’ at time of the US data releases. These data were mixed. Headline April durable goods orders were strong (7.9% M/M) but shipments (non-defense ex aircraft) were less impressive (0.4% M/M). Weekly jobless claims stayed low (215k). April spending/income data and price deflators also were a mixed bag. Income was unchanged M/M (negative 0.5% in real terms), but spending held up (0.5%, real 0.1% real). April price deflators rose further (headline 0.4% M/M & 3.8% Y/Y from 3.5%, core 0.2% M/M and 3.3% Y/Y from 3.2%) but at least didn’t surprise to the upside. It was enough for markets to further return the initial yield rise to trade with changes less than 1 bp.
The ECB published accounts of the April 30 Policy meeting. Inflation data available at that time mostly only showed a direct energy-related rise in inflation. Even so, policymakers then were already aware of the dilemma to manage both lower growth and upside inflation risks. Already at the end April meeting the policy makers assessed, ‘it had become increasingly likely that adopting a “looking through” approach was not appropriate’ and ‘that the primary focus (shifted) to determining the most appropriate timing for a rate increase’. All members were reported to have rallied behind the decision to keep the policy rate unchanged as there was no urgency to yet to act against second round effects and as it would allow the MPC to gather further information. Even so, a number of members noted ‘that the decision was a close call and that they would not have opposed raising rates at the current meeting had this been on the table’ as this could have sent an even stronger signal of the termination to bring inflation to target in a timely manner. ECB’s Lane in a speech indicated that, even if the initial energy shock starts to reverse the second round, including the impact on the labour market will be with us for a while. ECB president Lagarde in a speech in Cambodia, mostly addressed aspects related to central bank independence. The ‘ECB headlines’ only had limited impact as markets apparently have made up their mind in the run-up to the June 11 ECB meeting. A 25 bps hike is still 90% discounted. EMU swap yields today also change less than 2 bps across the curve.
News & Views
Belgian inflation accelerated to 4.08% y/y (0.08% m/m) in May from 4.01% last month, Statbel data showed today. It’s the second fastest (after January 2025’s 4.09%) in nearly three years. Core CPI (ex. energy products and unprocessed food) quickened to 3.59% from 3.55% while services inflation picked up to 5.88% from 5.28%. Some of the most significant price increases in May were registered for package holidays, private rents, domestic heating oil and veterinary services. In the Iranian war-related category, energy prices stood at 11.2% y/y, further up from May’s 10.58%. Motor fuels cost 27.3% more than in May 2025 but decreased by 0.6% m/m. Natural gas came in at 10.1% y/y and -7.3% m/m, making it one of the top negative contributors this month, along with electricity & the purchase of cars. Belgian inflation measures according to the European rules (HICP) amounts to 4.1%.
The Norwegian mainland economy (excluding petroleum & shipping activity) grew by 0.2% q/q in Q1, missing the 0.3% consensus view as well as the central bank’s 0.4% point estimate. It also followed a downwardly revised 2025Q4 to 0.2% from 0.4%. Including the energy-related activities, the economy expanded by 0.4% q/q with these offshore activities having logged a 1% expansion. General government consumption advanced 0.4% while household consumption expenditure declined 1.1%. Investments fell notably by 7.2%. Both exports and imports dropped, by 1.4% and 1.1% respectively. The Norwegian krone shrugged after the release with EUR/NOK hovering around 10.8. Neither have the lower-than-expected numbers a meaningful impact on markets’ view on central bank policy. The Norges Bank surprised some with a rate hike earlier this month and kept the prospect for another move later this year. Money markets assume such follow-through action to take place in September.
Bitcoin Accelerates Lower and Cracks Important Supports
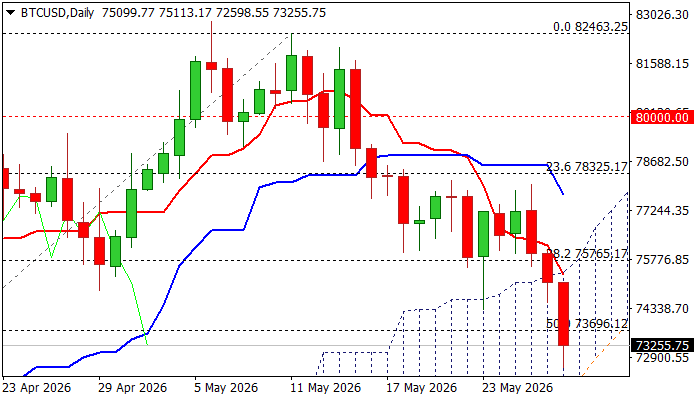
BTCUSD fell to the lowest in six weeks on Thursday, with daily loss of over 3% seen on acceleration of the bear-leg that extends into third consecutive day.
Fresh rise in oil prices on renewed tensions in the Middle East, was mainly behind today’s drop, which cracked 100DMA (73017) and pressured next significant support at 72221, provided by the base of daily Ichimoku cloud.
Bearish daily studies (strengthening negative momentum; 1055DMA and 20/30DMA bear crosses) contribute to negative near term outlook, with sustained break below 100DMA, daily cloud and nearby Fibo 61.8% of 64929/82463 (71627), to unmask psychological 70K support.
Meanwhile, bears may take a breather before final push lower, with limited upticks on partial profit-taking to provide better levels to re-enter bearish market.
Cloud top, reinforced by falling Tenkan-sen (75400) should cap upticks and keep bears in play.
Res: 73696; 75400; 75765; 77709
Sup: 72221; 71627; 70000; 69067
US: Consumer Spending Remains Soft in April Amid High Gas Prices
Personal income edged lower by 0.1% month-over-month (m/m) in April, coming in below market expectations for a 0.4% gain. After adjusting for inflation, taxes and transfers, real personal disposable income declined by 0.5% m/m.
Consumer spending rose 0.5% m/m in nominal terms – in line with market expectations. Consumers continued to spend more on gas amid high prices at the pump, which rose 5.7% last month, on top of a 19.0% increase seen in March due to higher prices.
After adjusting for inflation, spending growth remained tepid at 0.1%. Consumers spent less on goods in real terms (-0.1% m/m), cutting back on durables, such as motor vehicles and parts (-1.1% m/m) and recreational goods and vehicles (-0.5%). Spending was also weaker on clothing (-0.9%). Services spending fared better, rising 0.2% m/m. Recreational services rebounded by 1.1% and spending on food services and accommodation edged up by 0.2% after a flat reading the prior month. Spending on housing and utilities was flat, while outlays on transportation services edged lower 0.2%.
The personal saving rate continued to edge lower, dropping to 2.6%, from the downwardly revised 3.2% in the prior month and the lowest rate since June 2022.
Inflationary pressures eased slightly relative to the previous month, even as inflation accelerated on a year-over-year basis. Core PCE—the Fed’s preferred inflation gauge—rose 0.2% m/m, slightly slower relative to 0.3%-0.4% monthly increases seen over the last four months. However, the twelve month change accelerated to 3.3%, slightly up from 3.2% last month.
Key Implications
The impact of higher gas prices was once again front and center in this report. Spending increased in nominal terms, but gains were modest after adjusting for inflation, with the squeeze of higher gas prices—which have remained above $4 per gallon since the end of March—weighing on consumption. Even with the boost from higher tax refunds this year, disposable income is not keeping pace with spending, prompting households to tap into their savings, indicated by a notable decline in savings rate.
Rising equity prices, a stable labor market, and larger tax refunds have provided support to the consumer through the early days of the energy shock. However, high gas prices and slower wage growth among low-income workers will reinforce the K-shaped dynamics in consumer spending. Low- and middle-income households—who allocate a larger share of their budgets to food and fuel—are likely to scale back discretionary purchases. We are already seeing some signs of this in declining volumes of gas sales, as well as softer demand for durable goods and clothing. Overall, we expect U.S. consumer spending growth to run closer to 2% this year, down from our "pre-war" forecast of 2.5%.