

Sample Category Title
Gold Tumbles as Bearish Pressure Mounts
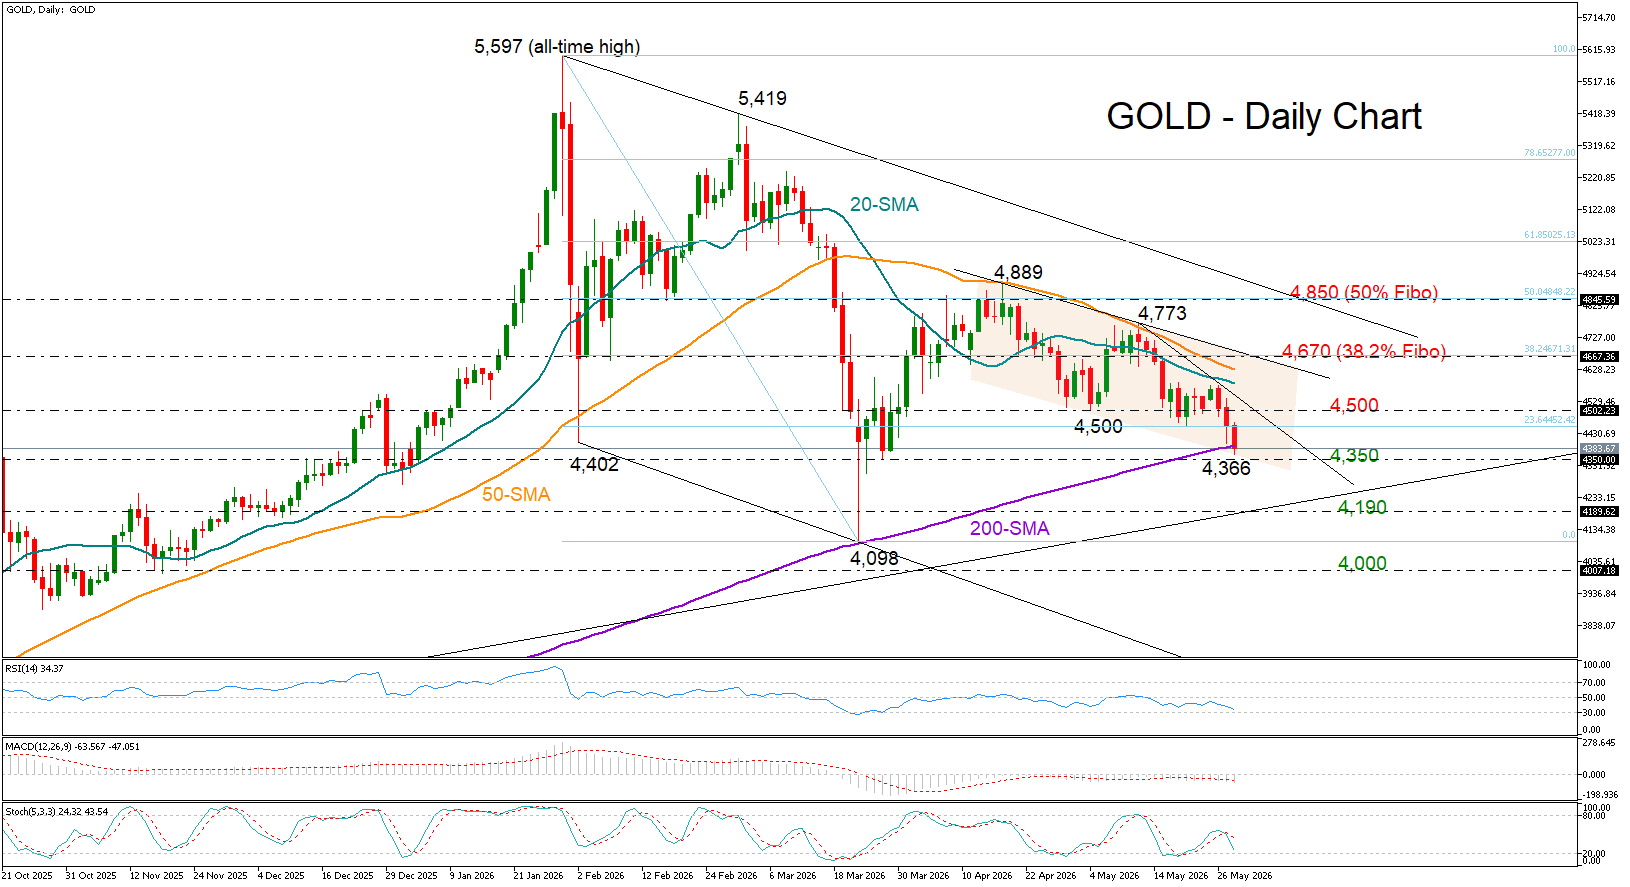
Overview: Gold is testing its 200-day SMA after two months of consolidation, having failed to revive bullish momentum above 5,000. As the precious metal completes its third negative month, down almost 20% from all-time highs, more losses could emerge in the short term.
Momentum: The RSI is below 50, the stochastic is pivoting south, and the MACD is strengthening its negative momentum below its red signal line, suggesting selling interest may dominate.
Bearish scenario: A decisive close below 4,350 could squeeze the price toward 4,190. Another failure there may open the door to the 4,000 level.
Risk: A bounce back above 4,500 may boost buying interest toward 4,670.
EUR/USD and GBP/USD Range-Bound Ahead of Key US Data
European currencies continue to trade within established ranges following the heightened volatility of recent weeks. Last week, both EUR/USD and GBP/USD declined before staging a recovery; however, the pairs are once again testing important support levels without developing a sustained directional impulse. Market participants remain cautious amid the absence of fresh geopolitical catalysts and ahead of key macroeconomic data releases from the United States.
Investor attention is primarily focused on the publication of US core Personal Consumption Expenditures (PCE) data, GDP figures, and durable goods orders. These indicators could significantly influence expectations regarding future Federal Reserve policy and determine the next direction for the dollar. Additional market influence is also coming from comments by Bank of England officials and European data on business activity and consumer confidence.
EUR/USD
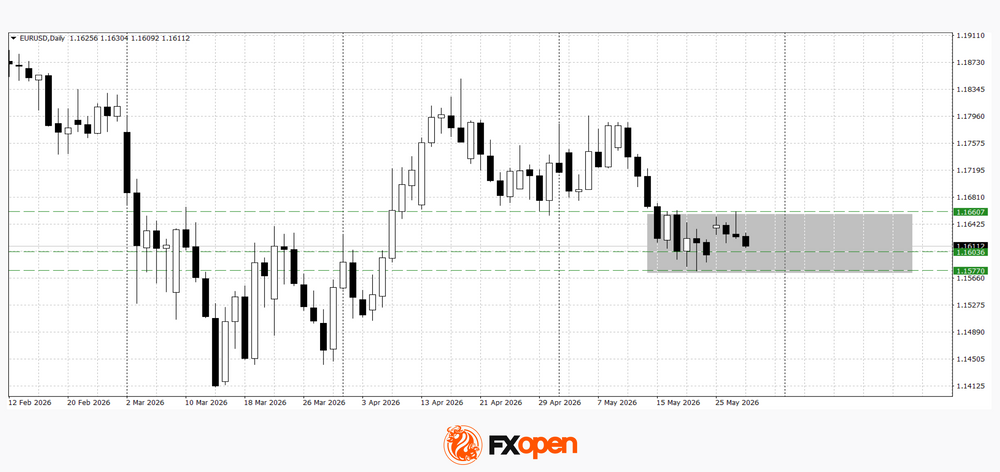
EUR/USD continues to display sideways dynamics within the 1.1600–1.1660 range. Technical analysis of EUR/USD points to the possibility of a retest of last week’s low near 1.1570 should 1.1600 shift into resistance territory. A resumption of upward movement would only become likely after a confident break and consolidation above 1.1660.
Key events for EUR/USD:
- today at 11:00 (GMT+3): Italian consumer confidence index;
- today at 13:00 (GMT+3): Spanish business confidence index;
- today at 15:30 (GMT+3): US core Personal Consumption Expenditures (PCE) price index.
GBP/USD
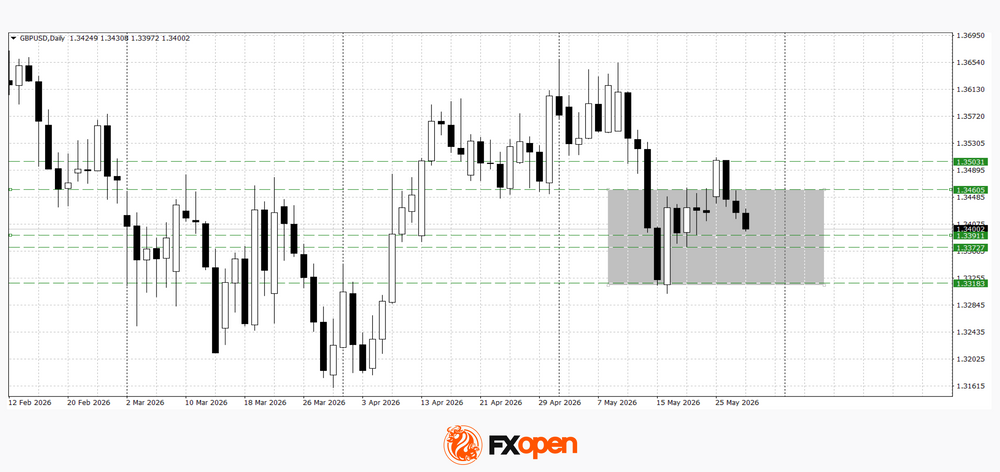
Following an upward correction, GBP/USD has once again come under pressure. However, the recent low near 1.3300 remains intact, preserving the likelihood of continued range-bound trading. Technical analysis of GBP/USD indicates the possibility of a test of the nearest support zone at 1.3370–1.3390. A break below this area could lead to a decline towards 1.3300, while a confident rebound from it may return the pair to the 1.3460–1.3500 range.
Key events for GBP/USD:
- today at 11:05 (GMT+3): speech by Bank of England Financial Policy Committee member Sarah Breeden;
- today at 15:30 (GMT+3): US GDP data;
- today at 17:00 (GMT+3): US new home sales.
Overall, EUR/USD and GBP/USD continue to trade in conditions of range-bound price action and subdued market activity. The further direction of European currencies will depend on the release of key US economic data, comments from central bank officials, and the broader dynamics of geopolitical risks across global markets.
Trade over 50 forex markets 24 hours a day with FXOpen. Take advantage of low commissions, deep liquidity, and spreads from 0.0 pips (additional fees may apply). Open your FXOpen account now or learn more about trading forex with FXOpen.
This article represents the opinion of the Companies operating under the FXOpen brand only. It is not to be construed as an offer, solicitation, or recommendation with respect to products and services provided by the Companies operating under the FXOpen brand, nor is it to be considered financial advice.
NZD/USD: RBNZ Decision Strengthens Expectations of Further Rate Hikes
Fundamental backdrop
On 27 May, the Reserve Bank of New Zealand kept the Official Cash Rate (OCR) unchanged at 2.25%, in line with market expectations. However, the decision proved finely balanced: the Monetary Policy Committee voted 3–3, with the final decision resting with Governor Anna Brehman.
In its updated rate projection path, the regulator signalled that the OCR could rise to around 2.8% by the end of the year, implying several rate hikes before year-end. Additional caution stems from the inflation backdrop: the conflict in the Middle East continues to keep inflation above the target range, while the central bank also warned about the weak pace of economic recovery. The split vote and the signal of likely future tightening supported the New Zealand dollar during the Asian session.
Technical picture
On the four-hour chart, NZD/USD displays a two-phase structure. In April, the pair established an upward trend: from the lows near 0.5680 at the beginning of the month, price gradually moved higher. The move culminated in early May with a peak around 0.5990, after which the trendline was broken to the downside and the pair entered a corrective phase, refreshing local lows near the 0.5815 area.
This was followed by a consolidation phase, during which the volume profile formed a point of control around 0.5870–0.5875, while the profile boundaries were established near 0.5910 and 0.5825.
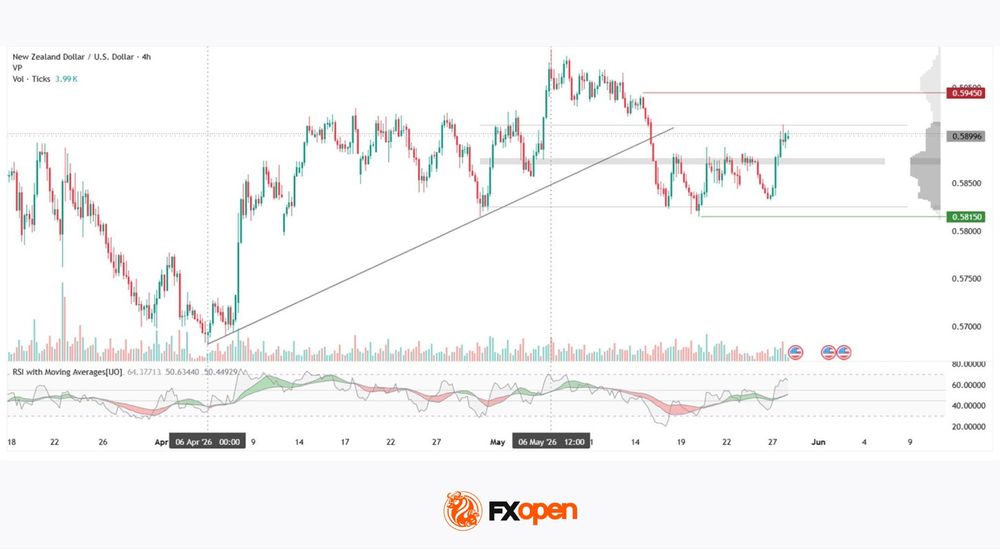
At the time of writing, price is testing the upper boundary of the profile from below, and a breakout could draw market attention towards the 0.5945 area — the nearest resistance level. Should quotations return below the point of control, focus may shift towards the lower boundary of the profile at 0.5825, with a potential support zone located beneath it around 0.5815.
RSI + MAs currently show readings of 64 / 50 / 50. The oscillator remains noticeably above both moving averages and has not yet entered overbought territory, indicating the presence of a local bullish impulse. At the same time, the RSI moving averages themselves remain close to the neutral 50 mark, meaning that the character of the move will largely depend on how price reacts to the upper boundary of the profile.
Key takeaways
The split RBNZ vote and the updated rate outlook have created a situation in which the market may continue to reassess expectations as new New Zealand inflation data emerge. The technical picture reflects the same duality: the RSI curve points higher, yet the neutral positioning of its moving averages does not provide sufficient confirmation of a sustained upward trend.
Trade over 50 forex markets 24 hours a day with FXOpen. Take advantage of low commissions, deep liquidity, and spreads from 0.0 pips (additional fees may apply). Open your FXOpen account now or learn more about trading forex with FXOpen.
This article represents the opinion of the Companies operating under the FXOpen brand only. It is not to be construed as an offer, solicitation, or recommendation with respect to products and services provided by the Companies operating under the FXOpen brand, nor is it to be considered financial advice.
Gold Under Pressure: Third Consecutive Session of Declines
Gold fell to 4,387 USD per troy ounce on Thursday, marking its third consecutive session of losses. The market remains cautious amid persistent uncertainty surrounding negotiations between the US and Iran, which continue to fuel concerns over inflation and the prospect of prolonged high interest rates.
Key disagreements between the two sides remain unresolved. Tehran continues to insist on maintaining control over the Strait of Hormuz and preserving its nuclear program.
US President Donald Trump previously stated that Washington would not accept a “bad deal” and was unwilling to ease sanctions on Iran, despite Tehran’s demands for financial concessions and an end to attacks.
Even if progress towards an agreement is achieved, markets still expect elevated energy prices to persist. This is likely to maintain inflationary pressure and force major central banks to keep monetary policy restrictive for longer, rather than moving towards rate cuts.
Since the beginning of the conflict, gold has already lost more than 15% of its value amid a stronger US dollar, rising bond yields, and expectations of higher interest rates across the global economy.
Technical Analysis
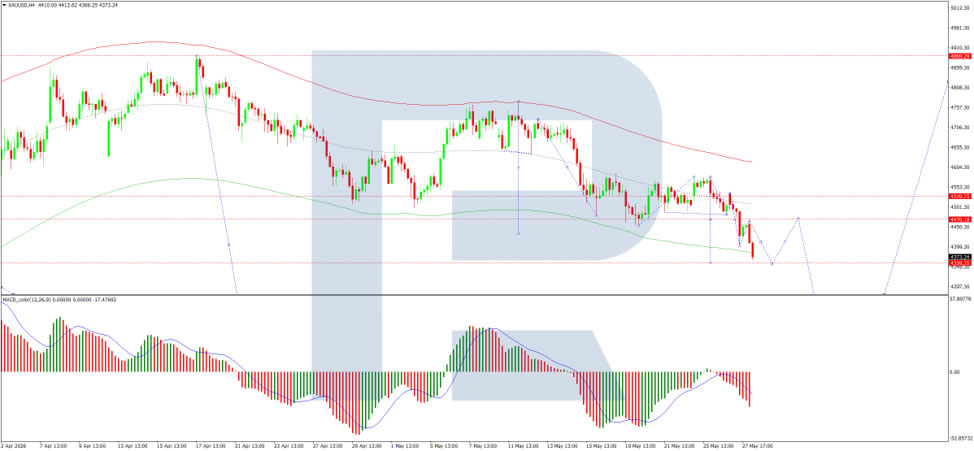
On the H4 XAU/USD chart, the market is trading within a consolidation range around 4,470 USD. A move lower towards 4,359 USD is likely. A corrective rebound to 4,470 USD (a retest from below) may follow, before a further decline towards 4,238 USD, with scope for an extension to 4,170 USD. The MACD indicator confirms the current bearish momentum, with the signal line below the centre line and pointing firmly downwards.
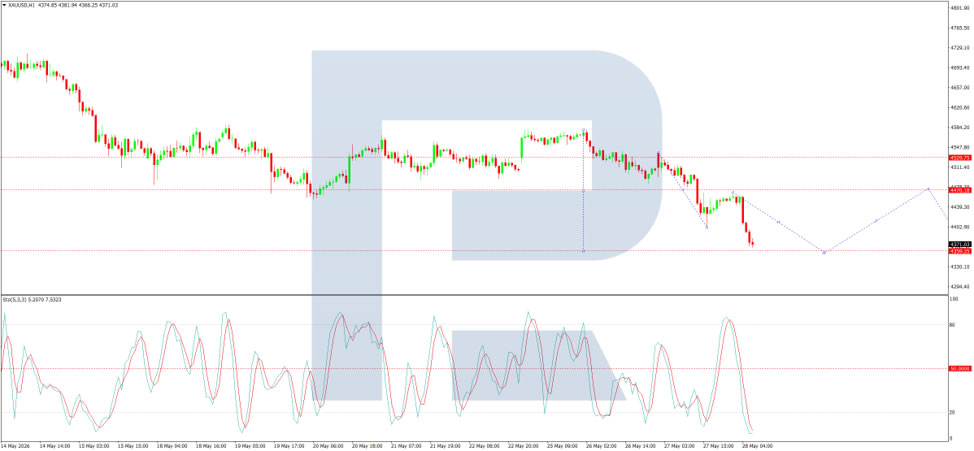
On the H1 chart, the market has broken below the 4,470 USD level and continues to move lower towards 4,390 USD. A corrective rebound to retest 4,470 USD from below remains possible, followed by another decline towards 4,250 USD. A subsequent rebound towards 4,390 USD may follow. The Stochastic oscillator supports this scenario, with the signal line below 20 and pointing firmly downwards.
Conclusion
Gold remains under significant pressure amid geopolitical uncertainty, elevated inflation expectations, and restrictive monetary policy. Technical indicators suggest bearish momentum remains dominant, although short-term corrective rebounds are possible.
ECB Minutes in Focus as Tension in the Middle East Continues
In focus today
In the euro area, the ECB publishes the minutes from its March meeting today. Given recent comments from Governing Council members, the minutes are likely to reflect increasingly hawkish discussions around further policy hikes.
Also in the euro area, May business sentiment indicators are released, with particular attention on firms' selling price expectations, which saw the largest monthly increase in the survey's 25-year history last month. We are looking to see if the rising expectations continue.
In Norway, GDP figures are released. We expect mainland GDP to have grown by 0.2% in Q1. Should that prove correct, growth will have come in somewhat below Norges Bank's March monetary policy report projection of 0.4%, pulling the probability of a June rate hike marginally lower. Uncertainty around the figure is slightly larger than usual, with more of the Easter holiday falling in Q1 this year.
Additionally in Norway, the Oil Investment Survey will also be published today, where we will be watching closely to see whether the recent rise in energy prices has influenced investment plans among oil companies.
Sweden's NIER survey is due at 09:00 CET. Besides an update on consumer and business sentiment figures, we will be paying close attention to price plans, which carry significant weight for the Riksbank. Half an hour later, the Swedish National Debt Office publishes its latest borrowing forecast. Despite a turbulent backdrop since the previous report in November, especially in recent months shaped by developments in the Middle East, we do not anticipate major revisions from the Debt office.
In the US, the April PCE inflation figures will be released, which is the Fed's preferred gauge of underlying inflation in the US. The figure increased 3.2% y/y in March, well above the Fed's 2% target, with markets expecting the price pressure to continue in the April figures. Also in the US, the second GDP estimate is released.
Economic and market news
What happened overnight
Between the US and Iran, Iran's Revolutionary Guard has overnight struck a US military base in retaliation after the US carried out its second attack this week on Iranian military targets. Iran has warned that any further US strikes will trigger a larger response, putting the April ceasefire and peace talks under extensive pressure. The attacks come after Iranian state television reported details of a potential peace proposal on Wednesday. Under the proposed terms, the US would end a naval blockade of Iranian shipping ports while Iran would restore traffic through the Strait of Hormuz to pre-war levels within a month. The White House denied the report, calling it a "complete fabrication", while Iran's government has not commented.
Oil markets reversed yesterday's optimism around a potential US-Iran deal, with Brent crude climbing to around USD 98/bbl following overnight strikes. Prediction markets have also shifted, with Polymarket now pricing the probability of shipping normalising through the Strait of Hormuz before end of June at around 37%, down from around 50% yesterday, reflecting growing uncertainty over whether a deal will be reached soon.
Equities: Equities took a breather yesterday and will decline further as markets open today. Instead of a peace deal, which investors are eagerly waiting for and pricing, the US carried out fresh strikes on Iran last night. Korean Kospi down 3% this morning and US and European futures point to a move 0.5-1% lower today, as oil prices and yields have retraced higher.
The big trade in markets - momentum - gave back some gains yesterday. Interestingly, this happened despite oil prices and yields being lower yesterday. US momentum stocks have rallied 5% in a week, and up almost 30% over the last month, so it makes sense to see days of profit-taking. In the absence of tech, consumer stocks led the market yesterday, across retail, staples, home builders etc. There was no macro data or earnings catalyst driving the sudden preference, rather it should be seen as a catch-up move, given profit-taking in the winners. Similarly, most shorted stocks also fared well yesterday.
FI and FX: Risk sentiment turned negative overnight on reports that the US has conducted new strikes on Iran. The EUR/USD has dropped below 1.16 and Brent oil rose from yesterday's low of USD 94.25 /bbl towards USD 98/bbl. Yields are also higher overnight given the rise in the oil price. Yesterday, we entered a long USD/SEK recommendation, where we see potential in both a stable scenario and in a risk scenario where looming Fed hikes begin to weigh on broader risk sentiment. There is plenty of interesting macro data today with PCE figures from the US and closer to home we have the Swedish NIER survey on economic sentiment and the Q1 GDP from Norway.
Sunrise Market Commentary
Markets
Iran and the US turned the script around. This time, the US denied Iranian reports of a draft MoU which would restore Hormuz traffic flow within a month after coming into effect. US President Trump called it “a complete fabrication”. Together with new “defensive” attacks by the US against an Iranian military site and new sanctions against Iran’s Persian Gulf Strait Authority (in order to avoid monetization of traffic), it dashed this week’s hopes of an end to the stalemate while also threatening the fragile ceasefire. Brent crude returns to $98/b this morning after hitting $94 yesterday for only the first time since the timeframe of the original two week ceasefire (April 7 – 21).
Fed vice chair Jefferson struck a rather balanced tone in a speech at a BoJ conference. He believes that the current policy stance leaves the Fed well positioned to respond to economic developments based on the incoming data, the evolving outlook and the balance of risks. He believes that inflation will cool later this year as the effects of tariffs and energy wear off, but risks remain tilted to the upside. When it comes to the other part of the Fed’s dual mandate, he continues to see signs of labour market weakness. Jefferson didn’t elaborate on the possibility of dropping the easing bias from the FOMC statement as he doesn’t prejudge the next meeting (June 17). His colleagues from the Minneapolis (Kashkari; voter) and Chicago (Goolsbee; non-voter) Fed sounded more hawkish. Kashkari thinks of the labour market as being in decent shape right now, making inflation his top priority. He warns for the risk that inflation expectations move higher as the inflation shock persists. If that happens, the Fed would have to respond aggressively. In earlier comments, Kashkari already suggested that the next Fed move could as well be a rate hike. Goolsbee isn’t convinced that the current bout of inflation from the energy shock is transitory. Structurally, he believes that the (AI) productivity boom works inflationary and requires higher interest rates. “An increase in expected future income is just like a wealth increase today: It can lead to increased spending and potentially overheat the economy before the productivity boom has actually arrived. The bigger the hype about future productivity, the more rates may need to rise to prevent overheating”. The combination of Fed comments and rise in oil prices triggers bear steepening of the US yield curve this morning. Yields add up to 4 bps at the front end of the curve. EUR/USD returned to the recent lows in the high 1.15-area. Today’s lofty US eco calendar (April PCE deflators, income & spending data, claims, durable goods orders) and more Fed comments (Williams, Musalem, Barkin) have the potential to add to the current repositioning momentum. In Europe, attention centres around April ECB Minutes (extensive discussion on possibility of rate hike) and comments by ECB President Lagarde though it’s unclear whether or not she’ll touch on monetary policy. We err on the side of hawkish repositioning in Europe as well.
News & Views
The Bank of Korea left its policy rate unchanged at 2.5%. However, the vote was not unanimous with two out of the seven MPC members already voting for a 25 bps rate hike. The decision comes in a context where the central bank upwardly revised both its growth and inflation forecasts. The domestic economy has grown significantly, as strong exports and increased investment, led by semiconductors and favorable consumption trends have continued. Despite the consequences of the conflict in the Middle East, the growth forecast for this year was raised significantly to 2.6% (2% in February). Consumer price inflation had risen significantly to 2.6% in April. This year’s forecasts for headline and core inflation are also upwardly revised to 2.7% and 2.4% respectively (from 2.2% and 2.1%). House prices in Seoul and its surrounding areas accelerated again and expectations of further increases have also heightened. The BoK concludes that it will decide the timing of any rate hikes while assessing the extent of the increase in inflationary pressure, the improvement trend in the domestic economy, and financial stability. At the news conference, new governor Shin Hyun Song was also quite explicit on the direction of monetary policy going forward. The won continues to trade relatively weak near USD/KRW 1507.
Hungarian economic sentiment as measured by GKI economic Research improved substantially in May from -10.7 to -6.7, the best level since April 2022. Business confidence was little changed (-8.8 from -8.5), but consumer confidence improved an impressive 16 points from -17 to -0.9 (best since September 2019). The Improvement comes as risk premia improved sharply in the wake of the April parliamentary elections and the subsequent change in the government. At EUR/HUF 355, the forint is holding near the strongest levels since early 2022.
Chart Alert: Gold (XAU/USD) Bearish Breakdown Below 200-Day MA, Further Potential Weakness Ahead
Key takeaways
- Gold (XAU/USD) has broken below its 200-day moving average for the first time in three months, increasing the risk of a fresh bearish impulsive decline within its broader medium-term downtrend.
- Rising US Treasury real yields continue to pressure gold prices, with the 10-year real yield staging a major bullish breakout toward multi-month highs, reducing the appeal of non-yielding assets such as gold.
- Technical indicators suggest bearish momentum remains intact below the $4,456 resistance level, with downside risks potentially extending toward $4,320 and the $4,262/$4,250 support zone.
This is a follow-up analysis on the prior report, “Chart alert: Gold (XAU/USD) rally faces roadblock at 20-day and 50-day moving averages”, published on 7 May 2026.
Gold (XAU/USD) has indeed remained lackluster in May and failed to break above its 50-day moving average after a retest of it on 12 May 2026.
Thereafter, the precious yellow metal staged a bearish reaction after a retest on the 50-day moving average for the second time on 12 May 2026 (the first time was on 17 April 2026). It printed an intraday high of $4,774/oz on 12 May 2026 and tumbled by 10% to hit a two-month low of $4,368/oz at this time of writing.
Intermarket and technical factors are suggesting further potential weakness ahead for gold. Let’s unpack them.
Major Bullish Breakout in the US 10-Year Treasury Real Yield
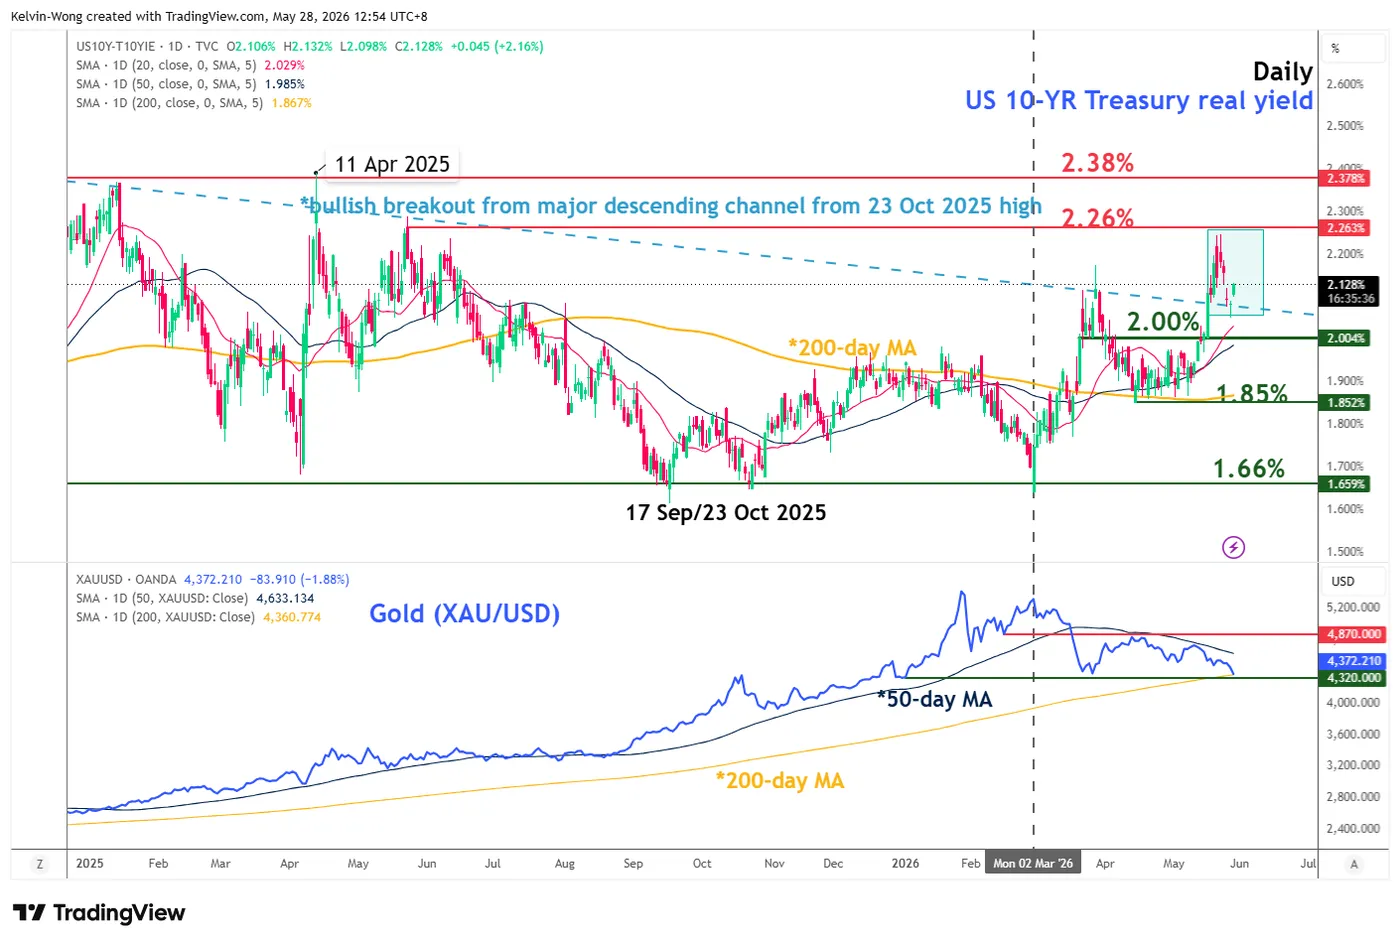
Fig. 1: Medium-term intermarket analysis of 10-year US Treasury yield with Gold as of 28 May 2026 (Source: TradingView).
The 10-year US Treasury real yield (nominal yield minus the 10-year breakeven rate derived from the 10-year Treasury inflation-protected security) has remained resilient on the upside after it managed to find support at its key 200-day moving average (1.85%) since 15 April 2026.
Thereafter, it rallied by 37 basis points to hit almost a one-year high of 2.26% on 20 May 2026 and staged a prior major bullish breakout from a former key descending channel resistance earlier on 15 May 2026 (see Fig. 1).
These observations suggest that the 10-year US Treasury real yield is likely undergoing a potential major uptrend phase (multi-month), with the next medium-term resistance coming in at 2.38% next in the first step.
Gold (XAU/USD) has a significant indirect correlation with the longer-term US Treasury yields, as the precious yellow metal is a non-interest income-bearing asset.
Hence, further upside in the 10-year US Treasury real yield translates into a further potential feedback loop into Gold (XAU/USD).
Let’s focus now on the short-term trajectory (1 to 3 days) of Gold (XAU/USD).
Gold (XAU/USD) – Start of a New Minor Bearish Impulsive Down Move Within Medium-Term Downtrend
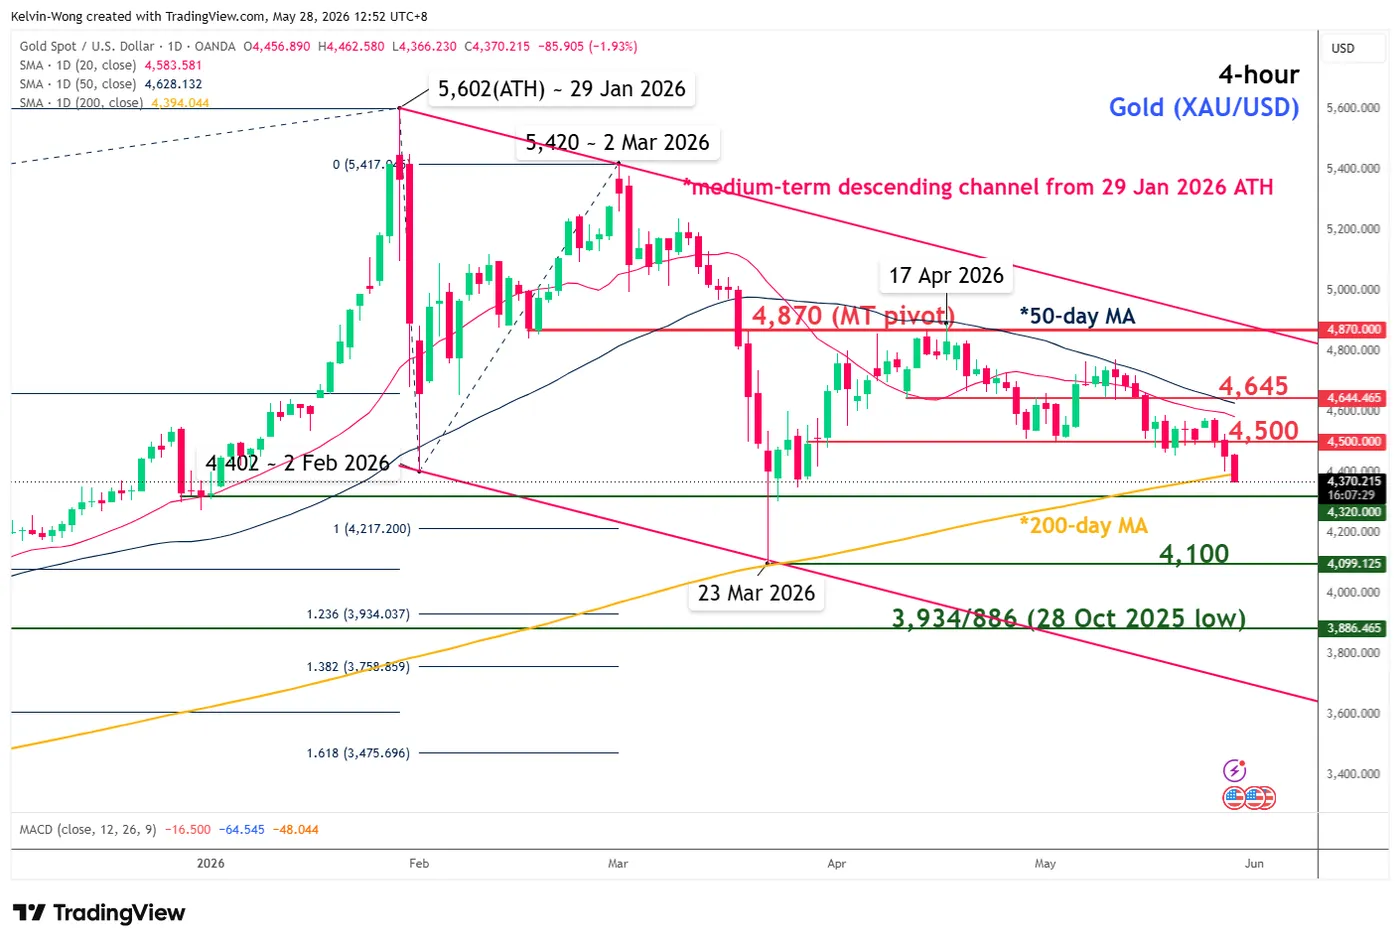
Fig. 2: Gold (XAU/USD) medium-term trend as of 28 May 2026 (TradingView).
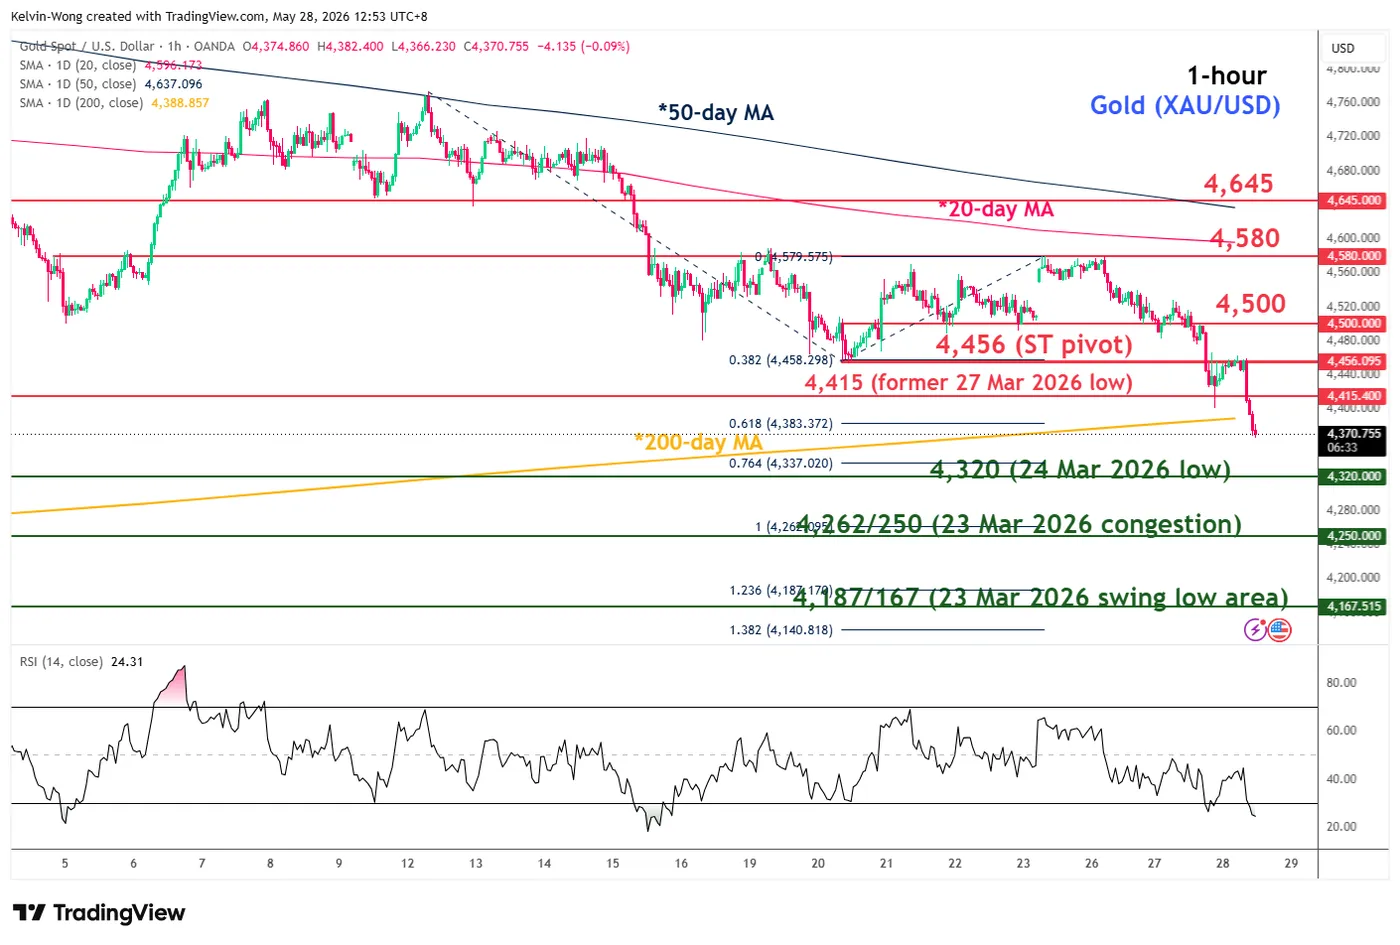
Fig. 3: Gold (XAU/USD) minor trend as of 28 May 2026 (TradingView).
Trend bias: Bearish bias below 4,456 key short-term pivotal resistance (see Fig. 3).
Supports: 4,320 (24 March 2026 low), 4,262/250 (Fibonacci extension & 23 March 2026 congestion), 4,187/167 (Fibonacci extension & 23 March 2026 swing low area).
Next resistances: 4,500 (former range support of 21/22 May 2026), 4,580 (also 20-day MA), 4,645 (also 50-day MA)
Key Elements to Support the Short-Term Bearish Bias on Gold (XAU/USD)
- Price actions continue to oscillate within a medium-term descending channel in place since its current all-time high printed on 29 January 2026 (see Fig. 2).
- Price action is now breaking below the key 200-day moving average, the first time in three months since a retest of it on 23 March 2026.
- The hourly RSI momentum indicator is in an oversold region (below the 30 level), but without any bullish divergence signal, suggesting near-term bearish momentum is likely still intact.
Iran Peace Hopes Collapse After New Strikes as Gold Eyes 4,000 and Silver Tests 70
The “imminent Iran peace deal” narrative collapsed violently across markets today. Just days ago, traders were aggressively pricing a rapid diplomatic breakthrough that would fully reopen the Strait of Hormuz, crush oil prices, and ease global inflation fears. That optimism has now evaporated. Fresh U.S. strikes, renewed regional military threats, and rising skepticism toward the negotiations triggered a sharp reversal across markets, with oil and Dollar surging together while Gold and Silver plunged under heavy liquidation pressure.
The turning point came after US President Donald Trump then poured further cold water on the diplomatic narrative by saying he was “not satisfied” with the current trajectory of talks. Then there were reports that U.S. forces launched fresh overnight strikes targeting Iranian military infrastructure following drone threats around Hormuz.
More importantly, Kuwait’s activation of air defenses against incoming missile and drone threats shattered the market’s assumption that the conflict was becoming geographically contained. Traders are now being forced to confront the possibility that the crisis is again spreading into a broader Gulf regional flashpoint involving critical U.S.-aligned infrastructure.
The key macro shift is that markets are once again repricing inflation shock risk rather than geopolitical de-escalation. Brent oil’s rebound above $95 is feeding directly into expectations for higher inflation, firmer Treasury yields, and renewed Dollar strength. That combination is once again proving particularly toxic for non-yielding precious metals.
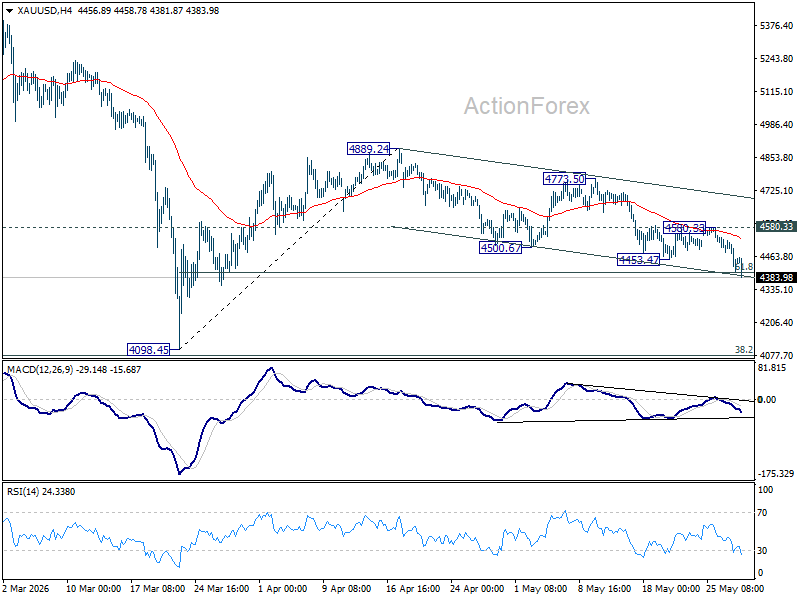
Technically, Gold’s earlier recovery attempt stalled at 4,580.33 after rejection by 55 4H EMA, and the subsequent break below 4,453.47 suggests downside momentum is accelerating again.
Risk will now stay on the downside as long as 4,580.33 resistance holds. Sustained trading below 61.8% retracement of 4,098.45 to 4,889.24 at 4,400.53 could trigger downside acceleration to retest 4,098.45, or in short, 4,000 major psychological level.
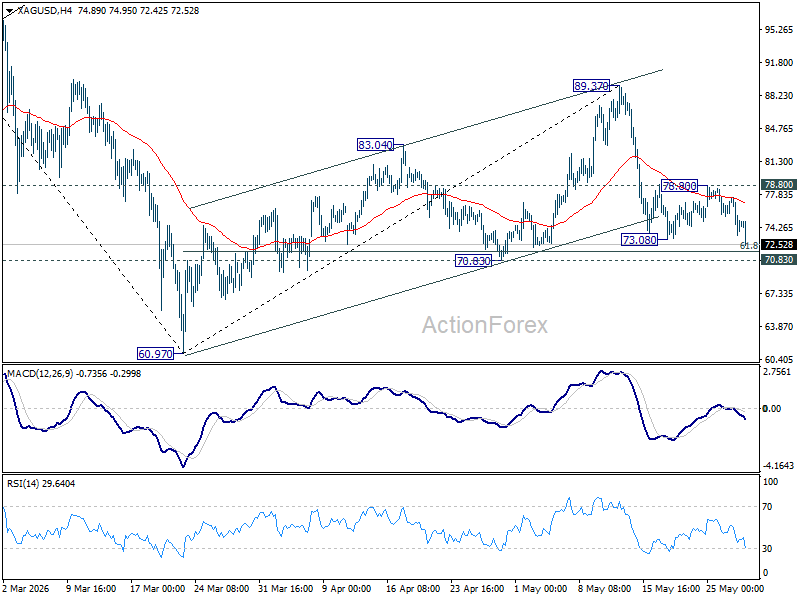
Silver’s technical picture is similarly fragile after its rebound from 73.08 failed at 55 4H EMA, resuming the broader decline from 89.37. The metal is now approaching the crucial 70 psychological zone, which could still attract structural dip-buying because of Silver’s heavy industrial exposure to green technology and electronics demand.
But if the combination of rising oil, stronger Dollar, and higher yields forces Silver decisively below 70 (with 61.8% retracement of 70.97 to 89.37 at 71.81), liquidation pressure could intensify rapidly as stop-loss selling accelerates toward the next major support zone around around 60.97, or even the 60 psychological level.
AI Capex Mania Fuels World Stocks to All-Time Highs as US-Iran Peace Deal Skepticism Lingers
Key takeaways
- Global equities climbed to fresh record highs as the AI infrastructure supercycle continued to dominate market sentiment, with hyperscalers projected to spend up to $1 trillion on AI capex by 2027.
- Markets remain highly sensitive to conflicting US-Iran peace deal headlines, driving sharp volatility in oil prices, bond yields, and broader risk sentiment across global asset classes.
- Sticky inflation and increasingly hawkish central bank rhetoric have reinforced expectations of prolonged restrictive monetary policy, with traders now pricing higher odds of Fed and ECB rate hikes.
- Chart of the day: Nikkei 225 at risk of corrective pull-back below 65,665 key short-term resistance.
Top macro headlines
- World stocks advance to record heights: Global equity indices, including the S&P 500, Nasdaq, and MSCI All Country index, eked out fresh record highs. The momentum remains strongly supported by an unyielding AI infrastructure supercycle that continues to overrule broader macroeconomic headwinds.
- US-Iran peace progress met with extreme skepticism: Volatility continues to rock the energy sector amid conflicting headlines regarding a breakthrough in the Middle East. While Iranian state media cited an unofficial memorandum of understanding to reopen the Strait of Hormuz within a month, the White House forcefully rejected the report, calling it a "complete fabrication."
- Trillion-dollar tech IPO pipeline expands: Speculation surrounding Elon Musk's public market footprint is heating up as SpaceX prepares to debut on the Nasdaq on June 12, targeting a valuation between $1.75 trillion and $2 trillion. Rumors are intensifying that Musk may eventually move to merge Tesla and SpaceX/xAI to build a unified AI giant. Concurrently, OpenAI and Anthropic continue to pursue substantial private and public funding sources.
- Central banks implement hawkish directives: Global monetary policy cycles are shifting aggressively toward headwinds. Following recent rate hikes in Australia and Norway, the Reserve Bank of New Zealand kept rates on hold in a highly contested split decision that points to imminent hikes. Simultaneously, European Central Bank officials delivered strong hawkish guidance, emphasizing that rate hikes should proceed regardless of Middle East peace outcomes. The short-term interest rate swaps market is now showing increasing odds of a 25-basis-point hike from the ECB in June.
Key macro themes
- AI Capex Supercycle vs. Dotcom Bubble Parallels: Cloud hyperscalers are projected to pour over $850 billion into AI infrastructure this year and up to $1 trillion in 2027. While the massive capital expenditures are absorbing enormous amounts of operational cash flow and driving up corporate debt, analysts from Goldman Sachs emphasize that a market crash is not imminent, as these tech giants are delivering concrete, strong earnings growth compared to the speculative late-1990s dotcom mania.
- The repricing of Fed trajectory before key PCE: Heading into Thursday's highly anticipated April PCE report, the first major inflation data of the new Fed Chair Kevin Warsh era at the Fed, economists expect headline annual PCE to accelerate to 3.8% y/y and core annual PCE to jump to 3.3% y/y. Sticky inflation and the ongoing war shock have completely erased 2026 rate cut hopes, with Fed funds futures traders now pricing in a 60% probability of an active Fed interest rate hike by year-end.
- The sovereign yield burden & corporate debt safe havens: Due to sticky inflation, deteriorating public finances in Washington, and massive upcoming Treasury coupon supply, investor sentiment toward U.S. sovereign debt has soured. Consequently, fund managers are increasingly eschewing Treasuries to flock into top-tier, blue-chip U.S. corporate debt, as corporate America's balance sheets increasingly look more sound than Washington's debt.
Global market impact (last 24 hours)
Equities: Wall Street was mixed but steady; the Dow Jones and Russell 2000 notched new record highs, while the S&P 500 and Nasdaq finished basically flat. Gains were led by consumer discretionary (+1.9%), with United Airlines gaining 6%, while software and chip names consolidated, with Qualcomm dropping 6%, and Nvidia slipping by 1%. Europe closed flat, and the UK FTSE gained 0.1%.
Fixed Income: U.S. Treasury yields eased slightly by 1-2 basis points. A heavy multi-billion dollar 5-year sovereign note auction registered acceptable investor demand ahead of top-tier PCE inflation data due later today.
FX: The U.S. Dollar Index (DXY) remained mostly flat. The New Zealand Dollar (Kiwi) skyrocketed by 1.0% to emerge as the largest G10 mover following the hawkish RBNZ split decision. The Japanese Yen slumped to a fresh 4-week low toward 159.50 per USD, entering acute verbal and physical intervention zones.
Commodities: Crude oil prices tumbled by 4.0%, sliding back below the critical $100/barrel handle as energy traders tentatively priced in the state-television peace rumors. Precious metals remained under severe pressure from higher global yield tracking; spot gold slipped further to trade near a fresh 2-month low at $4,456/oz, just above its 200-day moving average ($4,394/oz).
Asia Pacific impact
- South Korean and regional indices explode: South Korea's benchmark KOSPI spearheaded global equity gains, skyrocketing 3.0% to print a major record high on Wednesday, 27 May. The explosive rally is heavily driven by its twin memory chip giants, Samsung Electronics (+158% YTD) and SK Hynix (+258% YTD), both of which have been vaulted into the exclusive $1-trillion-valuation club due to insatiable AI infrastructure demand.
- Japan eyeing June hike amid slumping currency: Despite massive sovereign bond yield volatility, reports reveal the Bank of Japan is actively eyeing a June interest rate hike. This comes as the Japanese yen's purchasing power sinks to fresh lows under the weight of expensive energy imports, leaving it tracking as one of the world's weakest major currencies. Concurrently, SoftBank is pulling in 30 leading Japanese manufacturers to back a major homegrown AI industrial data venture.
- India falters and capital exits accelerate: In stark contrast to its East Asian peers, India's benchmark equity indices are faltering as foreign institutional investors dump domestic shares at a record-breaking pace. Millions of retail investors are shifting capital out of the country into foreign markets (up 57% y/y) due to a complete lack of AI exposure at home, a rapidly depreciating rupee, and consecutive fuel price hikes stoking structural inflation.
Top 3 events to watch today
- US PCE Core Inflation (Apr) - 8:30 pm SGT (consensus: 3.3% y/y, Mar: 3.2% y/y) Impact: All asset classes
- US Weekly Initial Jobless Claims - 8:30 pm SGT Impact: USD, short-term US Treasuries, US stock indices
- US-Iran peace deal news flows Impact: All asset classes
Chart of the Day - Nikkei 225 at Risk of Minor Setback
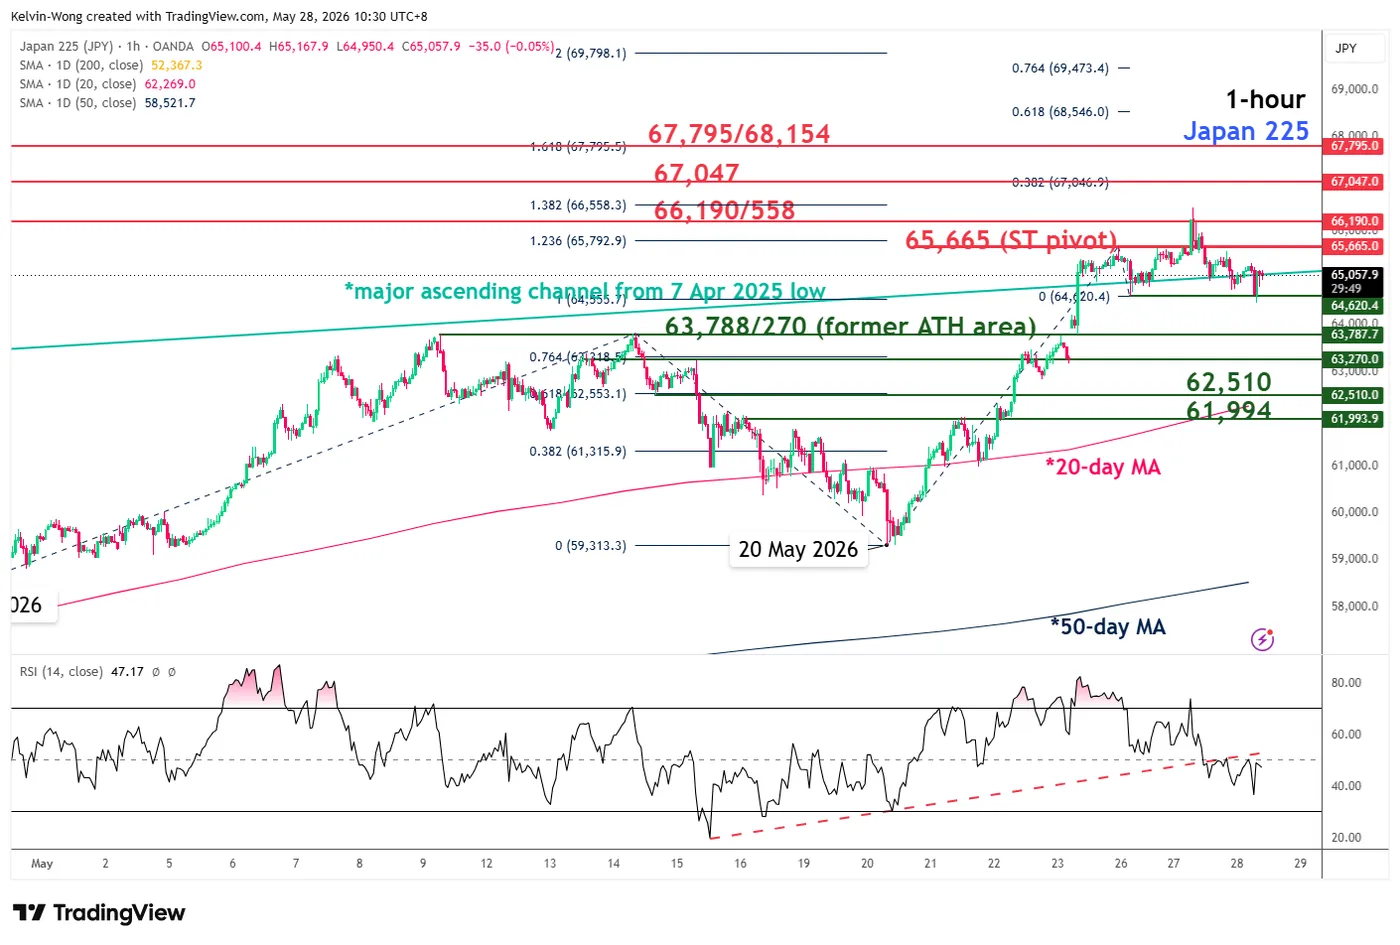
Fig. 1: Japan 225 CFD minor trend as of 28 May 2026 (Source: TradingView).
The price actions of the Japan 225 CFD (a proxy of the Nikkei 225 futures) have hit a short-term inflection/resistance level of 66,190/558 on Wednesday, 27 May 2026, after breaching above the upper boundary of a major ascending channel running from the 7 April 2026 low.
In addition, the hourly RSI momentum indicator flashed a prior bearish divergence condition at its overbought level before staging a bearish breakdown below its 50 level.
These observations suggest an impending minor corrective pull-back/setback. Watch the 65,665 key short-term pivotal resistance. A break below 64,620 near-term support (downside trigger level) may expose the next intermediate supports at 63,788/270 and 62,510 (also close to the 20-day moving average).
However, a clearance above 65,665 invalidates the bearish scenario for a continuation of the bullish impulsive upmove sequence to retest the current all-time high area of 66,190/558 before potentially setting sight on the next intermediate resistance at 67,047 (Fibonacci extension).
Gold Weakens Further, Downside Momentum Starts Accelerating
Key Highlights
- Gold started a fresh decline below the $4,550 support.
- A major bearish trend line is forming with resistance at $4,525 on the 4-hour chart.
- WTI Crude Oil extended losses and traded below $95.
- EUR/USD started a minor recovery wave above 1.1620.
Gold Price Technical Analysis
Gold failed to surpass $4,650 and trimmed gains against the US Dollar. The price dipped below $4,600 and $4,550 to enter a bearish zone.
The 4-hour chart of XAU/USD indicates that the price even declined below $4,500, the 100 Simple Moving Average (red, 4 hours), and the 200 Simple Moving Average (green, 4 hours). A low was formed at $4,401, and the price is now consolidating losses.
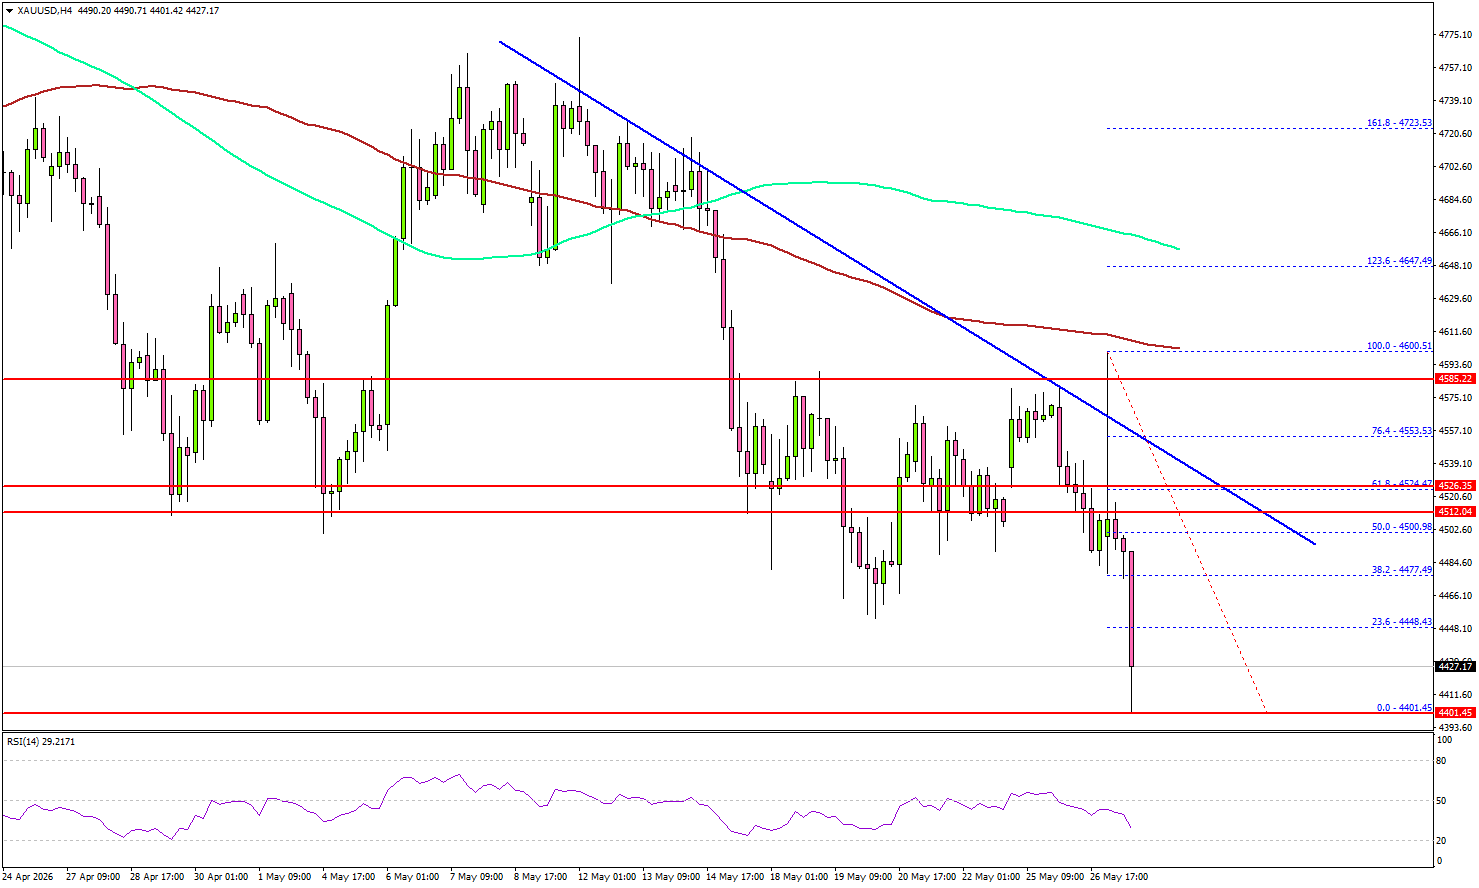
On the upside, immediate resistance is $4,475. The next major resistance sits near $4,500 and the 50% Fib retracement level of the downward move from the $4,600 swing high to the $4,401 low.
The main resistance could be near $4,525 and the 61.8% Fib retracement level. There is also a major bearish trend line forming with resistance at $4,525. A clear move above $4,525 could open the doors for more upside. In the stated case, the bulls could aim for a move toward $4,600 or even $4,620.
If there is another decline, Gold might find bids near the $4,400 level. The first major support sits at $4,365. The next support could be $4,320, below which the price might slide to $4,300. The main support sits at $4,200. Any more losses might call for a test of $4,065 or even $4,000 in the coming days.
Looking at WTI Crude Oil, the price started a fresh decline and there are chances of more losses below the $90 zone.
Economic Releases to Watch Today
- US Initial Jobless Claims - Forecast 243K, versus 244K previous.
- US Gross Domestic Product Q1 2026 (Preliminary) – Forecast 1.3% versus previous 2.1%.