
Sample Category Title
Sunset Market Commentary
Markets
The Iran war entered an interlude period. A “sufficient” amount of time remains before the cease-fire deadline runs out next Tuesday, allowing for backchannel diplomacy to do its part. Latest rumours suggests that a two week extension to the current deadline is the best to hope for. In the meantime, the US continues creating economic leverage with its naval blockade of the Straight of Hormuz and by indicating that temporary waivers to buy limited amounts of Russian and Iranian crude won’t be extended. The US and Israel (involved directly and indirectly via Lebanon) keep threatening a new round of military action if Iran doesn’t agree to US/Israeli terms. Something Iranian media/source suggest that country won’t do. As time goes by, we expect oil prices to gradually creep higher again going into next Tuesday’s deadline. Brent crude today moves from $95/b to $97/b. Despite the ticking clock, both in the conflict and when it comes to commodity supply, the ECB at the moment feels comfortable with a wait-and-see approach for its upcoming April policy meeting. Sub $100 oil prices remove a sense of urgency to frontload any tightening to counter upside inflation risks. That’s what we derive from the plethora of ECB speakers, including ECB President Lagarde, on the sidelines of the annual Spring Meeting from the IMF and Worldbank that’s currently going in Washington. The situation in Iran is the obvious caveat. Just look at how the tables have turned over the past week from a market point of view. Anyway, EMU money markets continues pricing out the likelihood of an April move which dropped to just 10% today. A June hike is the largely discounted base case with a second move by year-end. EMU and UK (same story) yield curve bull steepen with yields dropping up to 5 bps at the front end of the curve. The current interlude doesn’t bother stock markets with risk sentiment still bullish. Key European and US gauges add around 0.5%, but we warn for the changing balance of risks around that positioning as the stalemate between the US and Iran continues. EUR/USD made an attempt to settle above 1.18, but for a third session straight that proves to be a bridge too far. Today’s US eco data included low and lower than expected weekly jobless claims (207k from 218k vs 213k expected) and a consensus-beating Philly Fed Business Outlook (26.7 from 18.1). Much like yesterday’s US empire manufacturing survey, it showed a difference between strong growth in the month of April and slowing momentum in the 6-months ahead gauges. Prices paid and prices received are rapidly rising with companies expecting this to last in coming months.
News & Views
US crude exports surged to 5.2 mln barrels per day, weekly data from the US government showed today. It’s the highest in seven months, close to the record 5.6 mln bpd seen of 2023 and is to be compared with a maximum exporting capacity of 6 mln bpd. The strong climb narrowed US net imports of oil to just 66k bpd, which was a weekly record low in the series going back to 2001. Demand from Asian and European refiners for US oil picked up greatly in the wake of the Hormuz Strait de facto closure. Some 2.4 mln bpd sailed towards Europe while around 1.5 bdp headed to Asia. On an all-inclusive energy basis (eg. LNG, natural gas), the US has been a net exporter since 2019.
A study by the National Bank of Belgium seen by financial media outlet De Tijd concluded there’s no budgetary leeway for policy measures to cushion the energy shock, countering the argument that increased revenues (eg. through excise duties) create the room to do just that. The NBB calculated that the primary deficit would increase between €800 million and €1.3bln by 2028, depending on the strength of the energy shock. This is because of lower economic growth and higher inflation, which leads to higher public wages and social benefits through wage indexation. Because the latter effects comes with a lag, there is less of a detrimental or even a slightly positive impact for the running year. The NBB therefore urges the government to take into account the cumulative impact through 2028. It also warned that higher revenues through VAT (inflation) and excise duties (on gasoline and diesel) are highly uncertain and assume that consumers won’t change their behavior (eg. less driving). Any measures the De Wever government does want to take should in any case be limited, targeted and temporary.
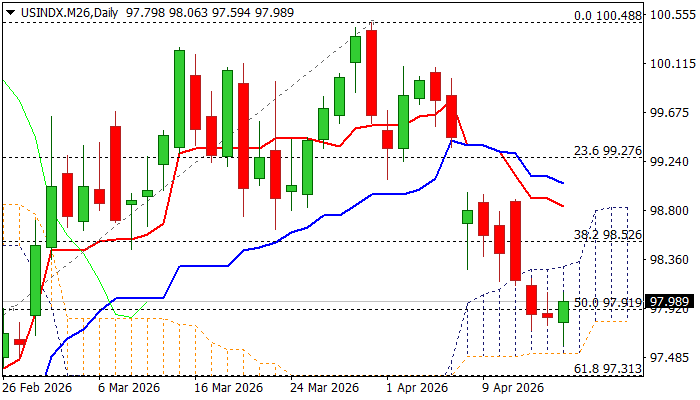
USD Index: Bears Take a Breather Above New Multi-Week Low
The dollar edged higher on Thursday as traders booked profits from the recent fall, which accelerated in past three sessions and hit the lowest since late February.
Oversold conditions on daily chart prompted a partial profit-taking, which would likely mark a brief pause in a larger downtrend, as growing optimism about potential peace solutions in the Middle East continues to fade safe-haven demand.
Markets also take a break, awaiting more news, following recent optimistic signals, although remain cautious, as current ceasefire and negotiating process is still fragile.
Significant barriers at $98.30 zone (daily cloud top / converged 100/200DMAs) should ideally cap, with extended upticks to remain under $98.70 (Fibo 38.2% of $100.48/$97.59 / falling 10DMA) to keep bears in play for fresh push lower and attack at key support, provided by daily cloud base ($97.51), loss of which to strengthen bearish structure.
Daily studies remain bearish (strong negative momentum / daily Tenkan/Kijun-sen diverge after formation of bear-cross) that supports scenario of limited upticks providing better levels to re-enter market ahead of fresh push lower.
However, geopolitics are likely to remain dollar’s key driver currently, with news from negotiations to define greenback’s near-term direction.
Res: 98.30; 98.52; 98.70; 97.95
Sup: 97.50; 97.31; 97.00; 96.56
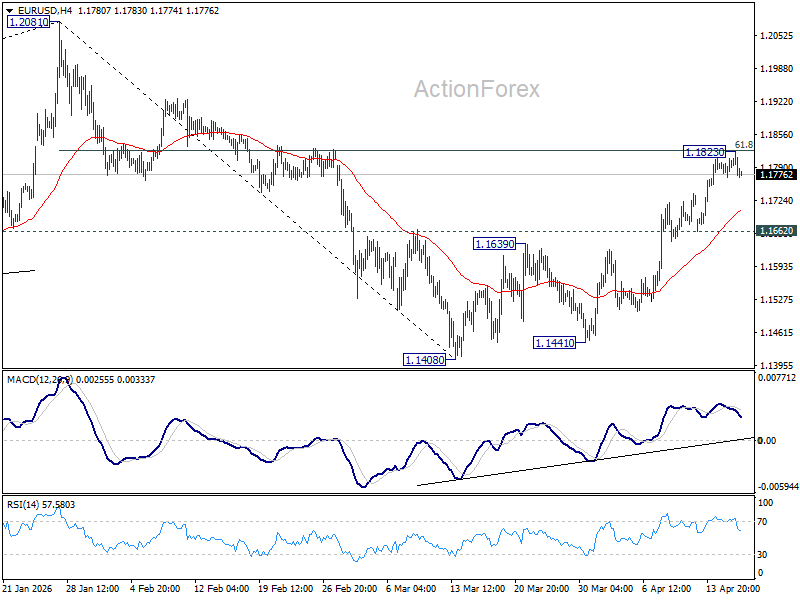
EUR/USD Mid-Day Outlook
Daily Pivots: (S1) 1.1778; (P) 1.1793; (R1) 1.1815; More….
Intraday bias in EUR/USD is turned neutral with current retreat, and some consolidations would be seen first. Further rise is expected as long as 1.1662 support holds. On the upside, decisive break of 61.8% retracement of 1.2081 to 1.1408 at 1.1824 will extend the rally from 1.1408 to retest 1.2081 high.
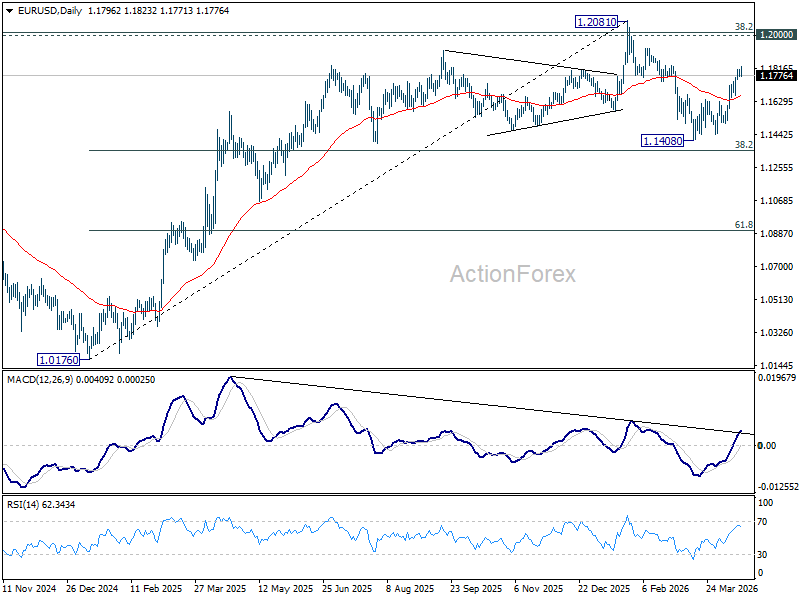
In the bigger picture, the strong support from 38.2% retracement of 1.0176 to 1.2081 at 1.1353 suggests that the pullback from 1.2081 is more likely a corrective move. Strong support was also found in 55 W EMA (now at 1.1513). Focus is back on 1.2 key cluster resistance level. Decisive break there will carry long term bullish implications. Nevertheless, break of 1.1408 support will revive the case of medium term bearish trend reversal.
GBP/USD Mid-Day Outlook
Daily Pivots: (S1) 1.3543; (P) 1.3562; (R1) 1.3581; More...
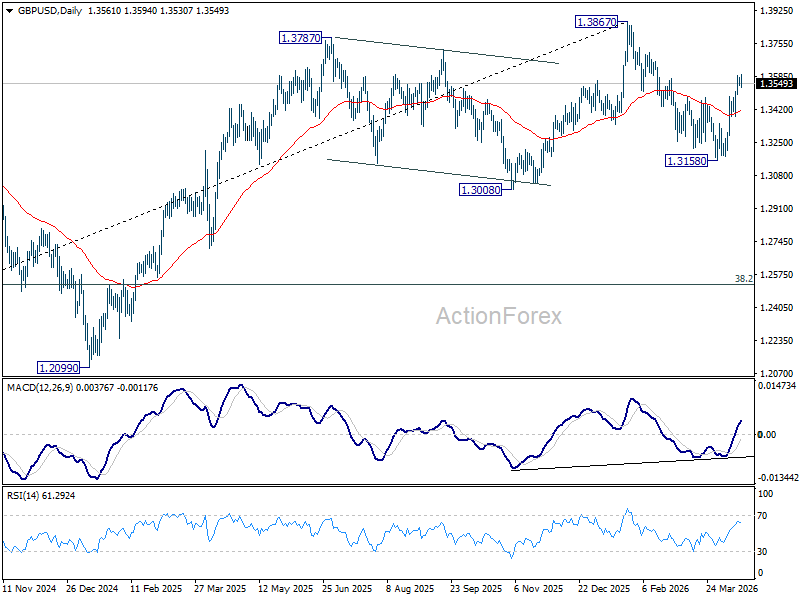
Intraday bias in GBP/USD is turned neutral first with current retreat, and some consolidations would be seen. Further rally is expected as long as 1.3379 support holds. On the upside, firm break of 61.8% retracement of 1.3867 to 1.3158 at 1.3596 will extend the rise from 1.3158 to retest 1.3867 high.
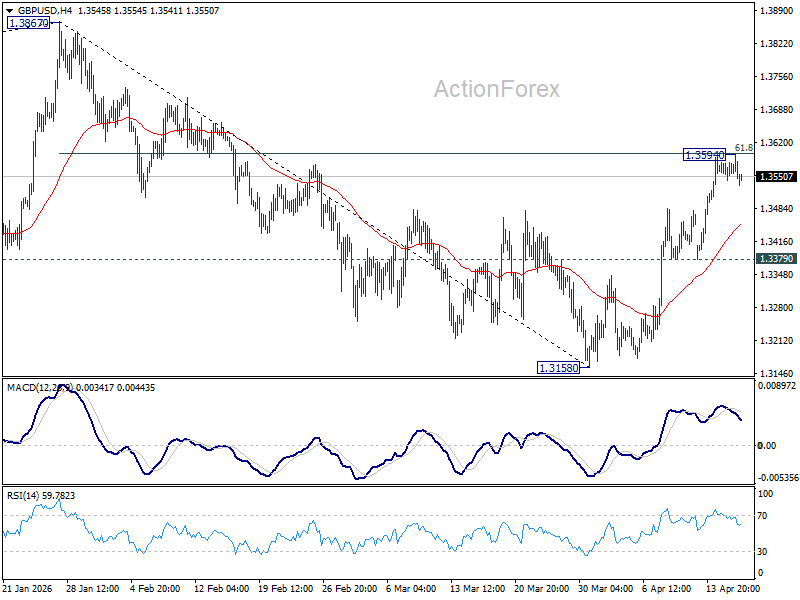
In the bigger picture, current development suggests that price actions from 1.3867 are merely a corrective pattern within the broader up trend from 1.0351 (2022 low). With 1.3008 support intact, medium term bullishness is maintained and break of 1.3867 is back in favor for a later stage, towards 1.4248 key resistance (2021 high).
USD/CHF Mid-Day Outlook
Daily Pivots: (S1) 0.7801; (P) 0.7816; (R1) 0.7835; More….
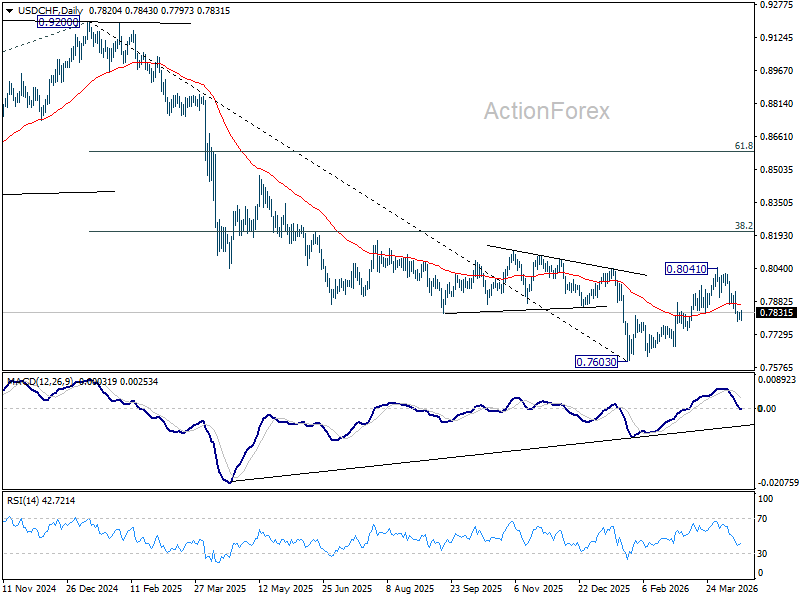
Intraday bias in USD/CHF is turned neutral first with current recovery. Some consolidations would be seen and further decline is expected as long as 0.7933 resistance holds. Below 0.7789 will resume the fall from 0.8041 to 61.8% retracement of 0.7603 to 0.8041 at 0.7770. Decisive break there will target a retest on 0.7603 low.
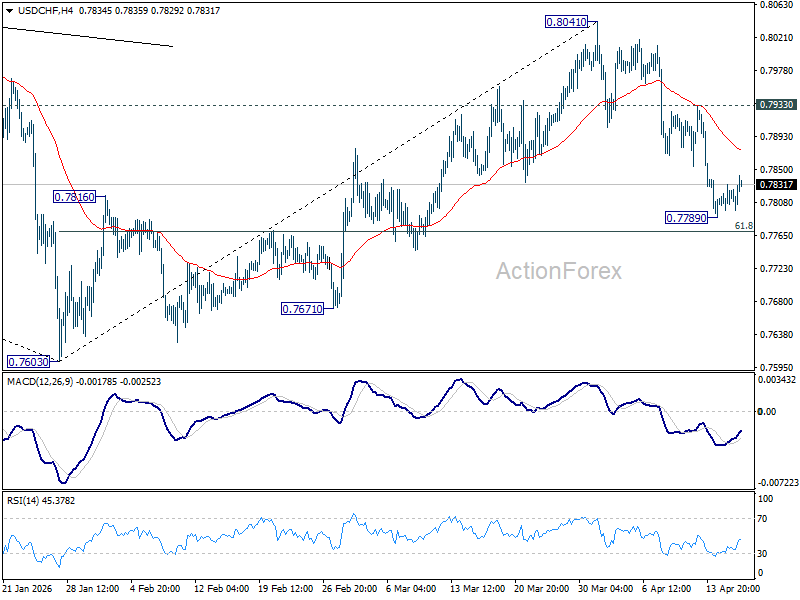
In the bigger picture, rebound from 0.7603 medium term bottom is seen as correcting the fall from 0.9200 only. Rejection by 55 W EMA (now at 0.8071) will affirm this bearish case, and setup down trend resumption to 100% projection of 1.0146 (2022 high) to 0.8332 from 0.9200 at 0.7382 at a later stage. Though, sustained break of 55 W EMA will suggest that it's probably correcting the larger scale down trend from 1.0146 (2022 high).
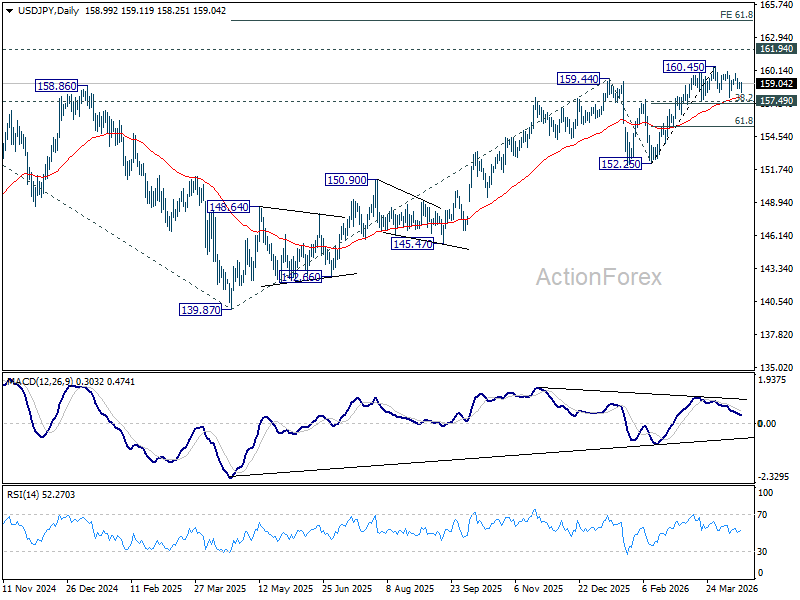
USD/JPY Mid-Day Outlook
Daily Pivots: (S1) 158.67; (P) 158.95; (R1) 159.26; More...
Range trading continues in USD/JPY below 160.45 and intraday bias stays neutral. Outlook will stay bullish as long as 157.49 cluster support (38.2% retracement of 152.25 to 160.45 at 157.31) holds. On the upside break of 160.45 will target a retest on 161.94 high. However, firm break of 157.31/49 will bring deeper fall back to 61.8% retracement at 155.38 next.
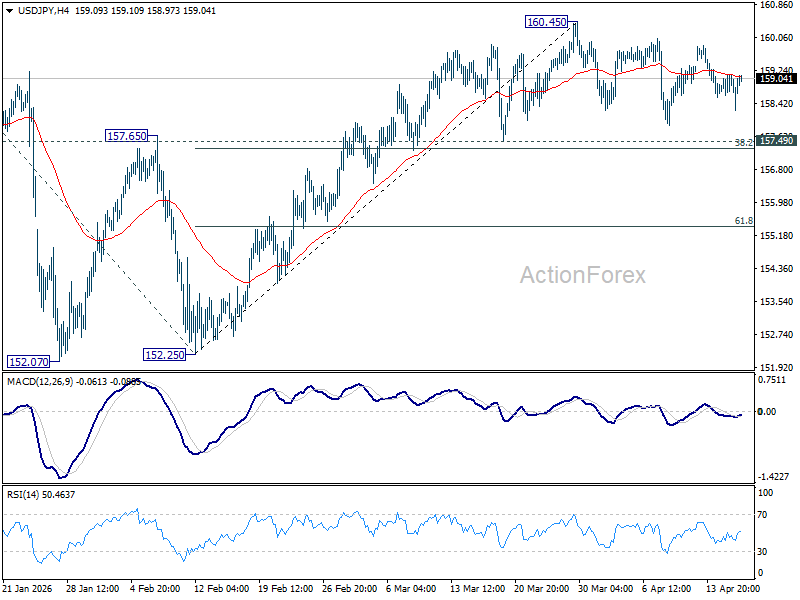
In the bigger picture, outlook is unchanged that corrective pattern from 161.94 (2024 high) should have completed with three waves at 139.87. Larger up trend from 102.58 (2021 low) could be ready to resume through 161.94. This will remain the favored case as long as 55 W EMA (now at 155.24) holds. Firm break of 161.94 will pave the way to 61.8% projection of 102.58 to 161.94 from 139.87 at 176.75.
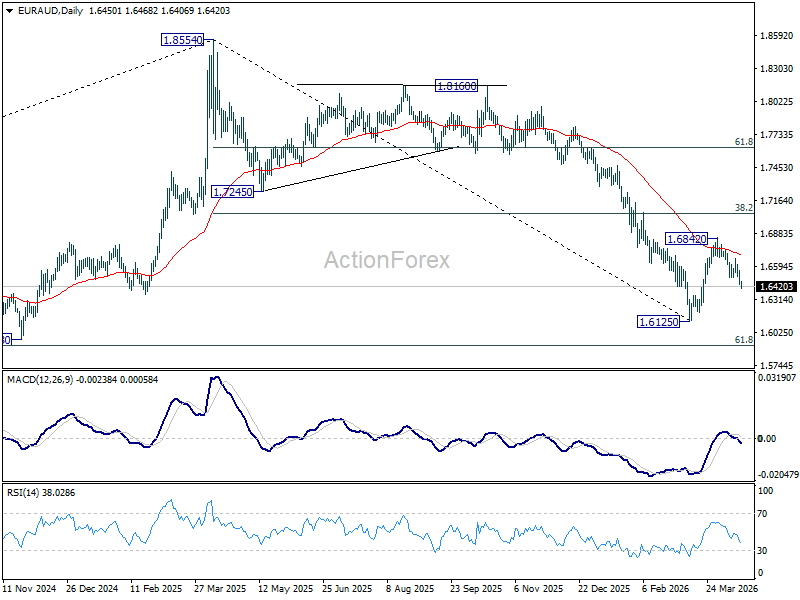
EUR/AUD Mid-Day Outlook
Daily Pivots: (S1) 1.6405; (P) 1.6493; (R1) 1.6544; More...
EUR/AUD's fall from 1.6842 continues today and intraday bias stays on the downside for retesting 1.6125 low. Firm break there will resume whole down trend from 1.8554 to 1.5913 fibonacci level next. For now, risk will stay on the downside as long as 1.6667 resistance holds, in case of recovery.
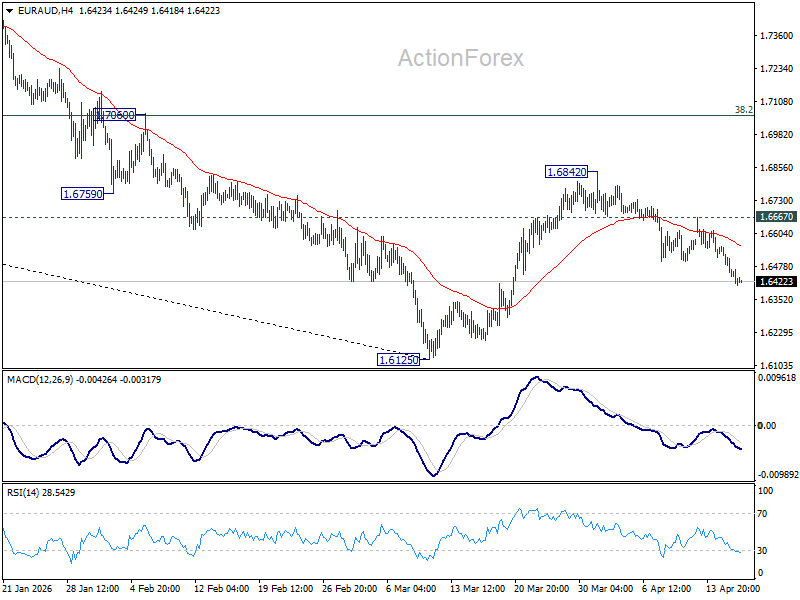
In the bigger picture, fall from 1.8554 (2025 high) is in progress and deeper decline should be seen to 61.8% retracement of 1.4281 to 1.8554 at 1.5913, which is slightly below 1.5963 structural support. Decisive break there will pave the way back to 1.4281 (2022 low). For now, risk will stay on the downside as long as 55 W EMA (now at 1.7163) holds, even in case of strong rebound.
Risk Appetite Holds Firm Near Highs as ECB Pushback Caps Euro, Aussie Outperforms
Risk sentiment remains firm, but momentum is no longer accelerating. Markets are holding near recent highs as optimism over Middle East de-escalation continues to underpin sentiment, with US futures pointing to another strong open and the potential for fresh record highs in the S&P 500. At the same time, the tone is measured rather than euphoric, suggesting that much of the positive news is already priced in.
Across asset classes, price action reflects this consolidation phase. Oil prices are trading in a tight range just above this week's spike lows, indicating that the war premium has largely stabilized rather than unwound further. Precious metals are also struggling to extend gains, with Gold struggling to build momentum above 4800, and Silver failing to sustain moves above 80. The lack of follow-through highlights a market that is comfortable, but not chasing risk aggressively.
In currency markets, Dollar has staged a modest recovery but remains the worst performer for the week, reflecting the broader unwind of safe-haven demand. Yen is not far behind, while Euro is also lagging. In contrast, Aussie continues to lead, followed by Kiwi and Loonie, reinforcing the view that risk-sensitive currencies remain favored in the current environment.
Euro’s underperformance is being driven by clear pushback from ECB officials against near-term tightening expectations. The March policy accounts emphasized that temporary deviations from the inflation target “could be tolerated” as long as they are “short-lived and limited in size” and do not risk de-anchoring expectations. This signals a willingness to look through the current energy-driven inflation spike.
That stance has been reinforced by recent comments from policymakers. Executive Board member Isabel Schnabel noted that the ECB is in a “relatively favorable” position and stressed that “we do not need to rush into action.” President Christine Lagarde echoed this cautious tone, emphasizing that the current uncertainty “does not determine a rate path,” effectively ruling out any pre-commitment to tightening.
Market pricing reflects this shift. Odds of a rate hike at the April meeting fell to around 20%, while expectations are increasingly shifting toward June, where probabilities rise to around 80%. Goldman Sachs has also pushed back its forecast for the start of the ECB’s tightening cycle to June.
In contrast, Australian Dollar continues to benefit from both global and domestic drivers. Strong employment data has reinforced the case for further tightening by the Reserve Bank of Australia, with the labor market showing little sign of loosening. The steady unemployment rate at 4.3% suggests the economy remains near full employment.
Markets have responded by increasing expectations for a May rate hike, with swaps now pricing around a 67% probability, up from about 60% a week ago. This repricing underscores the divergence in policy outlooks, with the RBA seen as moving closer to further tightening while the ECB remains cautious.
Overall, the current market environment is defined by stability rather than acceleration. Risk appetite is holding firm, but gains are consolidating as investors await the second round of US-Iran talks.
In Europe, at the time of writing, FTSE is up 0.72%. DAX is up 0.68%. CAC is up 0.54%. UK 10-year yield is down -0.018 at 4.740. Germany 10-year yield is down -0.039 at 3.008. Earlier in Asia, Nikkei rose 2.38%. Hong Kong HSI rose 1.72%. China Shanghai SSE rose 0.70%. Singapore Strait Times fell -0.27%. Japan 10-year JGB yield rose 0.002 to 2.406.
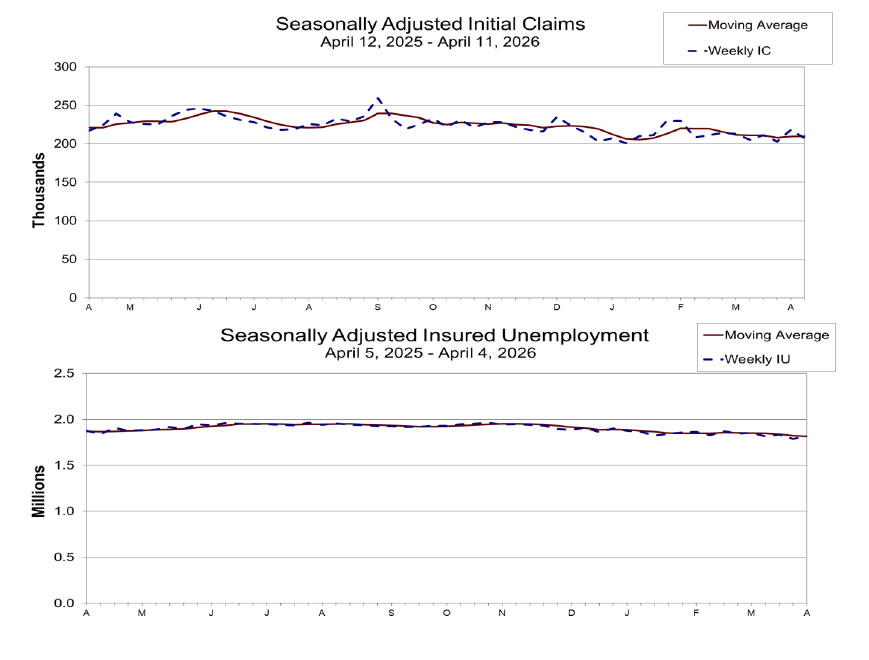
US Initial Unemployment Claims Fall to 207k as Labor Market Remains Tight
US jobless claims fell again, highlighting low layoffs, but rising continuing claims suggest workers are taking longer to find new jobs. Read more.
ECB Minutes Signal Willingness to Tolerate Temporary Inflation Deviations
ECB minutes show policymakers are willing to tolerate temporary inflation spikes, focusing instead on whether pressures become persistent and feed into wages and expectations. Read more.
Eurozone Inflation Jumps to 2.6%, Energy and Services Drive
Eurozone inflation rose sharply in March, driven by energy and services, but core CPI eased slightly—highlighting rising external pressures with stable underlying inflation. Read more.
UK GDP Beats Expectations at 0.5% mom with Broad-Based February Growth
UK economic growth surprised to the upside in February, with GDP rising well above expectations on broad-based gains across key sectors. But beneath the headline strength, underlying trends remain uneven, with construction still dragging on the three-month outlook. Read More.
SNB Minutes Stress Intervention as Franc Surge Threatens Price Stability
SNB minutes show policymakers are ready to intervene as safe-haven flows push the Swiss franc higher, raising risks to price stability. Read more.
Australia's 17.9k Job Growth Driven by Full-Time Gains, Unemployment Rate Steady at 4.3%.
Australia’s labor market held steady in March, with employment rising in line with expectations and full-time jobs surging. Strong gains in hours worked point to resilient labor demand. Read more.
China's 5% GDP Growth Tops Forecasts as Supply Holds Firm, Demand Lags
China’s economy beat expectations in Q1, but weak retail sales and falling investment highlight an uneven recovery driven by supply, not demand. Read more.
EUR/AUD Mid-Day Outlook
Daily Pivots: (S1) 1.6405; (P) 1.6493; (R1) 1.6544; More...
EUR/AUD's fall from 1.6842 continues today and intraday bias stays on the downside for retesting 1.6125 low. Firm break there will resume whole down trend from 1.8554 to 1.5913 fibonacci level next. For now, risk will stay on the downside as long as 1.6667 resistance holds, in case of recovery.
In the bigger picture, fall from 1.8554 (2025 high) is in progress and deeper decline should be seen to 61.8% retracement of 1.4281 to 1.8554 at 1.5913, which is slightly below 1.5963 structural support. Decisive break there will pave the way back to 1.4281 (2022 low). For now, risk will stay on the downside as long as 55 W EMA (now at 1.7163) holds, even in case of strong rebound.
US Initial Unemployment Claims Fall to 207k as Labor Market Remains Tight
US initial jobless claims fell by -11k to 207k in the week ending April 10, coming in below expectations of 215k and signaling continued strength in the labor market. The 4-week moving average edged up slightly to 209,750, but remains consistent with a low level of layoffs overall.
However, continuing claims told a more nuanced story. The number of people receiving ongoing unemployment benefits rose by 31k to 1.818 million, suggesting it is taking slightly longer for displaced workers to find new jobs. Despite the weekly increase, the 4-week average declined to 1.813 million, the lowest level since early June 2024, pointing to broadly stable underlying conditions.
Taken together, low initial claims indicate limited layoffs, while the rise in continuing claims hints at some softening in re-employment dynamics.
| Indicator | Latest | Notes |
|---|---|---|
| Initial Jobless Claims | 207k | Fell -11k, below 215k expectation |
| 4-Week Avg (Initial) | 209.8k | Up +0.5k, still low overall |
| Continuing Claims | 1.818M | Rose +31k, slower re-employment |
| 4-Week Avg (Continuing) | 1.813M | Down -8.25k, lowest since June 2024 |
ECB Minutes Signal Willingness to Tolerate Temporary Inflation Deviations
ECB’s March meeting minutes reinforce a cautious, data-dependent stance, with policymakers signaling no urgency to respond to the latest energy-driven inflation shock. The Governing Council emphasized that it would “closely monitor the situation,” with decisions guided by incoming data to ensure inflation returns to target in a “timely and sustainable manner.” Short-term volatility alone will not trigger a policy shift.
A key takeaway is that the ECB remains willing to tolerate temporary deviations from its inflation target. The minutes noted that such deviations “could be tolerated” as long as they are “short-lived and limited in size” and do not lead to a de-anchoring of expectations. However, the tolerance has limits—“large, sustained deviations” would require “appropriately forceful or persistent monetary policy action.”
At the heart of the discussion is the challenge posed by supply-side shocks from the Middle East conflict. Policymakers acknowledged that these shocks create a dilemma, as preserving price stability “could require a tighter monetary policy, even if this reinforced the adverse impact on growth.” At the same time, if the shock proves temporary, it could be “looked through to avoid imposing unnecessary costs on the economy,” underscoring the importance of judging its duration.
Ultimately, the ECB’s reaction will hinge on whether second-round effects begin to emerge. The Governing Council stressed the need to monitor wage and price-setting behavior closely, warning that policy action would be required if higher costs feed into a “wage-price spiral.” For now, the central bank is firmly focused on the medium term, prepared to act if needed, but equally determined not to move prematurely in response to a shock that may yet prove transitory.