
Sample Category Title
AUD/USD Daily Report
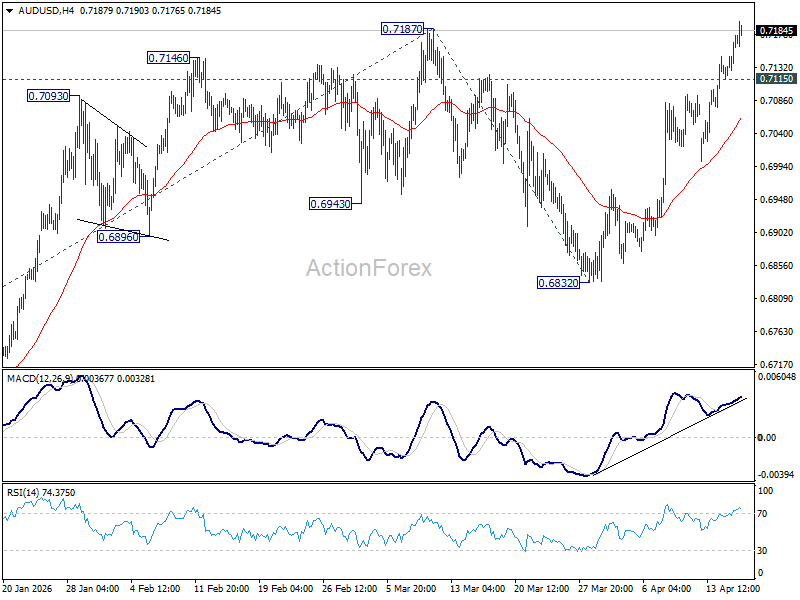
Daily Pivots: (S1) 0.7131; (P) 0.7154; (R1) 0.7194; More...
AUD/USD's break of 0.7187 high suggests that larger up trend is possibly resuming. Intraday bias stays on the upside for 61.8% projection of 0.6420 to 0.7187 from 0.6832 at 0.7306. Decisive break there could prompt upside acceleration to 100% projection at 0.7599. On the downside, below 0.7115 minor support will delay the bullish case and turn intraday bias neutral first.
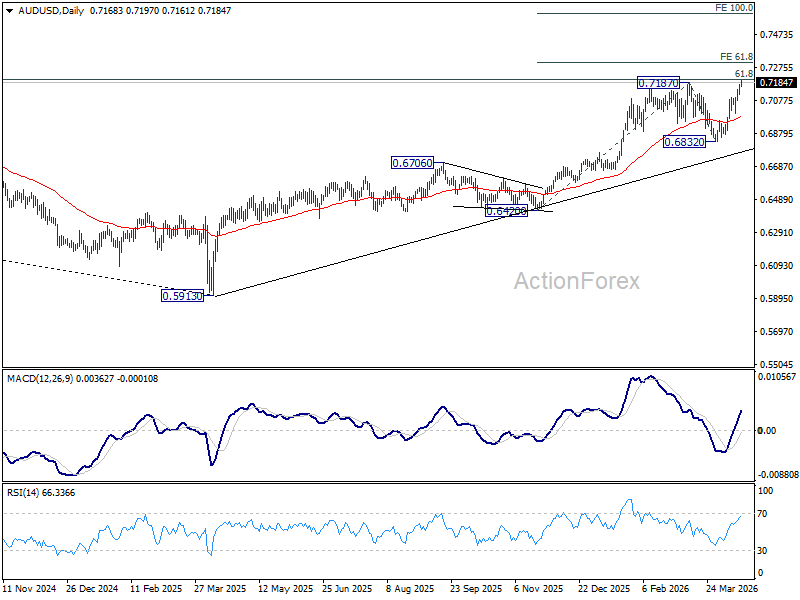
In the bigger picture, rise from 0.5913 (2024 low) is still in progress. Decisive break of 61.8% retracement of 0.8006 to 0.5913 at 0.7206 will solidify the case that it's already reversing the down trend from 0.8006 (2021 high). Further rally should then be seen to retest 0.8006. For now, outlook will remain bullish as long as 0.6832 support holds, in case of pullback.
Aussie Leads as Risk Optimism Builds, Strong Jobs Push AUD/USD Toward 0.72 Break
Aussie strength is telling the story of markets today. The currency has emerged as the top performer, driven by a combination of improving global risk sentiment and robust domestic labor data, with AUD/USD rising to its highest level since late 2022 and approaching the key 0.72 resistance. The move reflects growing confidence that US-Iran tensions are moving toward de-escalation, even as talks are pushed into the weekend, while strong full-time job gains at home reinforce expectations for further RBA tightening.
On the geopolitical front, optimism remains intact despite a slight delay in the second round of US-Iran talks. While President Donald Trump had initially suggested discussions could resume “over the next two days,” the timeline has shifted toward the weekend or early next week due to logistical constraints. Importantly, markets are treating this delay as procedural rather than political, with expectations for progress largely unchanged.
Diplomatic momentum is also broadening beyond the core US-Iran channel. Trump announced that leaders of Israel and Lebanon are set to speak directly, marking a rare high-level engagement after decades of indirect contact. The move is widely seen as an attempt to secure a localized ceasefire and reduce regional tensions, while also increasing pressure on Tehran ahead of the next round of negotiations.
There are also indications that back-channel or technical discussions are taking place ahead of the main talks, aimed at building a framework and avoiding another breakdown. This layered approach to diplomacy is reinforcing the view that negotiations are entering a more constructive phase, helping to sustain risk appetite across global markets.
Equity markets are reflecting this optimism, with major S&P 500 pushing to record highs and Japan’s Nikkei following suit. The rally suggests that markets are continuing to price a favorable outcome, even as the focus shifts from anticipation to delivery. Meanwhile, Dollar remains under pressure.
Against this backdrop, Australian Dollar is emerging as the clearest expression of the risk-on shift. As a currency highly sensitive to global growth and commodities, AUD is benefiting directly from easing geopolitical risks. The move higher in AUD/USD is not just a reflection of Dollar weakness, but also a signal of improving confidence in the global outlook.
Domestic factors are adding further support. Australia’s latest employment report showed solid gains in full-time jobs, offsetting a decline in part-time roles, while the unemployment rate held steady at 4.3%. The rise in hours worked reinforces the view that labor demand remains firm, pointing to underlying strength in the economy.
This combination of stable unemployment and stronger job quality strengthens the case for further tightening by the Reserve Bank of Australia. Markets were already pricing a roughly two-thirds chance of a rate hike in May, and the latest data helps solidify that expectation. With the labor market near full employment, policymakers have room to act without triggering a sharp rise in joblessness.
For now, the balance of risks appears skewed to the upside. As long as geopolitical tensions continue to ease and domestic data remains supportive, AUD is likely to stay bid. The next catalyst will be whether upcoming US-Iran talks can deliver tangible progress, turning current optimism into a more durable trend.
In the currency markets, overall for the week so far, Aussie is currently the best performer, followed by Kiwi, and then Swiss Franc. Dollar is the worst, followed by Yen, and then Euro. Sterling and Loonie are positioning in the middle.
In Asia, Nikkei closed up 2.64%. Hong Kong HSI is up 1.55%. China Shanghai SSE is up 0.60%. Singapore Strait Times is down -0.07%. Japan 10-year JGB yield is down -0.001 at 2.403. Overnight, DOW fell -0.15%. S&P 500 rose 0.80%. NASDAQ rose 1.59%. 10-year yield rose 0.026 to 4.282.
UK GDP Beats Expectations at 0.5% mom with Broad-Based February Growth
UK economic growth surprised to the upside in February, with GDP rising well above expectations on broad-based gains across key sectors. But beneath the headline strength, underlying trends remain uneven, with construction still dragging on the three-month outlook. Read More.
Australia's 17.9k Job Growth Driven by Full-Time Gains, Unemployment Rate Steady at 4.3%.
Australia’s labor market held steady in March, with employment rising in line with expectations and full-time jobs surging. Strong gains in hours worked point to resilient labor demand. Read more.
China's 5% GDP Growth Tops Forecasts as Supply Holds Firm, Demand Lags
China’s economy beat expectations in Q1, but weak retail sales and falling investment highlight an uneven recovery driven by supply, not demand. Read more.
Fed's Beige Book: Modest Growth Persists as Energy Shock Lifts Costs, Squeezes Margins
The Fed’s Beige Book shows an economy still growing, but under pressure. Rising energy and input costs are squeezing margins, while businesses turn to "wait-and-see" posture amid Middle East uncertainty. Read more.
ECB’s Schnabel Signals No Rush to Hike, Warns Against Premature Tightening
ECB’s Schnabel says policymakers can afford to wait, warning that premature tightening could impose unnecessary costs as energy shock creates risks for both inflation and growth. Read more.
AUD/USD Daily Report
Daily Pivots: (S1) 0.7131; (P) 0.7154; (R1) 0.7194; More...
AUD/USD's break of 0.7187 high suggests that larger up trend is possibly resuming. Intraday bias stays on the upside for 61.8% projection of 0.6420 to 0.7187 from 0.6832 at 0.7306. Decisive break there could prompt upside acceleration to 100% projection at 0.7599. On the downside, below 0.7115 minor support will delay the bullish case and turn intraday bias neutral first.
In the bigger picture, rise from 0.5913 (2024 low) is still in progress. Decisive break of 61.8% retracement of 0.8006 to 0.5913 at 0.7206 will solidify the case that it's already reversing the down trend from 0.8006 (2021 high). Further rally should then be seen to retest 0.8006. For now, outlook will remain bullish as long as 0.6832 support holds, in case of pullback.
Iran Headline Roulette Still Grabs Most Market Attention
Markets
More ECB members spoke on the sidelines of the IMF/Worldbank annual spring event in Washington. In general, it stands out how the overall tone of comments softened as oil prices moved from crisis levels (>$100/b) to more bearable levels ($90-$100 area). Leaning toward an April hold seems to be the base case as things stand. ECB Kazaks put it plain and simple: he has nothing against (market) bets on two rate hikes starting in June. He doesn’t rule out April if second-round effects emerge (in the data). “Is it April or is it June? We have proved that we can move very quickly and sizably. So we’ll see.” He notices that higher yields (and some tightening of financial conditions) are doing part of the adjustment for the ECB. German BuBa president Nagel has a slightly different view. He says that and April move hinges on the Strait of Hormuz situation. Who knows what will happen in two weeks time? Just look at who quick the tables have turned over the past week. If anything, Nagel stressed that there can be no doubt that the central bank will deliver on its price stability mandate. Vigilance is warranted. On the bright side, (medium-term) inflation expectations look well anchored at the moment. Outgoing French central banker Villeroy, a more dovish profile, thinks that a focus on April would be premature. He makes a difference between a focus on the possible spillover effects on lasting inflation while also monitoring negative effects on demand and growth. By April, he suggests that the ECB won’t have the necessary critical mass of data on the twofold effect to act. Before the April 30 ECB gathering, the central bank gets monthly PMI numbers, the ECB’s consumer survey (inflation expectations), April CPI and Q1 GDP. The latter two reports are on ECB day. It’s doubtful whether this complex already provides the “sufficient” amount of evidence. Like ECB Kazaks, Villeroy points out that core CPI (in the March reading) remained limited. ECB Schnabel, the most hawkish of them all, suggested not to rush into a decision. The ECB is in a relatively favorable position, affording it to take the time that is needed in order to analyze the character of the energy shock. She’s afraid for fragile inflation expectations, but believes that weaker aggregate demand (in any case way less strong than in 2022) could slow the overall pass-through in the economy. EMU money markets currently fully discount a June rate hike, but reduced the probability of April action to 20%.
The Iran headline roulette still grabs most market attention. Gossip on an extension of the cease-fire and fresh talks between the US and Iran somewhere next week are the underlying narrative. In the meantime, the US sticks with its naval blockade of Hormuz, keeping Brent prices at $95/b. Yesterday’s stoic moves in European trading hint at some signs of fatigue. Risk sentiment in US trading was still bullish though with Nasdaq (+1.5%) outperforming and sending EUR/USD above 1.18.
News & Views
China’s economy grew by 5% y/y in Q1 of this year, marginally better than the 4.8% expected. The 1.3% quarterly pace was the quickest since 2024Q4. Looking into the accompanying monthly economic update, growth was mainly driven by the manufacturing sector. Industrial production in March rose 5.7% y/y and 6.1% YTD y/y. This compares to retail sales growth – a proxy for services & domestic demand – of 1.7% y/y and 2.4% YTD y/y. For all of the trade and geopolitical uncertainty and despite an external environment described by the National Bureau of Statistics as “severe”, China’s industrial/exporting sector is cooping well. But Iran risks loom with hampered oil supply potentially leading to broader supply chain disruption. Trade data earlier this week already showed exports having slumped over the course of March, be it from an exceptionally strong February. Other monthly data included fixed assets growth at 1.7% YTD y/y in March, marginally easing from 1.8% the month before. The property malaise continues with investments falling by 11.2% YTD y/y and residential property sales barely recovering to -18.5% YTD y/y from a 1.5 year low of -21.8% in February. The data didn’t leave a dent in USD/CNY with the pair holding steady around multiyear lows (CNY highs) of 6.818.
Australian employment grew by 17.9k in March, building on February’s 49.7k. Growth was driven by full-time employment (52.5k) with part-time jobs being shed (34.6k). The unemployment rate remained steady at 4.3%, whilst the participation rate fell by 0.1 ppt to 66.8%. Employment-to-population stayed at 64%. Total hours worked was up 0.5%. The 0.4% rise for full-timers was supported by the 0.5% rise in the number of people employed. However, despite the 0.7% drop in the number employed, part-timers worked 0.6% more hours. This meant that part-timers had worked 1.4% more hours last month than they did in February. The Australian dollar extended its geopolitically-driven bull run this morning after the data with AUD/USD taking a shot at 0.72. That’s the strongest level since mid-2022.
Ceasefire Prospects Keep Oil Steady
In focus today
In the UK, February GDP is expected to increase 0.1% m/m, an increase from January's 0.0% m/m growth. The print is especially interesting in the light of Tuesday's IMF projections that UK GDP is forecasted to grow 0.8% y/y in 2026, a downward revision from 1.3% y/y and the hardest hit of the G7 countries on a per capita basis.
In the afternoon, the US March industrial production and manufacturing production are released, and both are expected at +0.1% m/m, a decline from +0.2% m/m in February.
In Sweden, focus is on SPES monthly labour market statistics and a speech by Riksbank's Per Jansson at 13:15 CET on current monetary policy and the economy. We expect a repeat of his relatively dovish stance as expressed in the minutes from the last meeting, not least as inflation has surprised on the downside and inflation expectations remain well anchored.
In the eurozone, final March inflation figures are released and expected to confirm flash estimates.
Economic and market news
What happened overnight
China released its monthly batch of data overnight, which continued to show a two-speed economy with weak consumer demand and strong exports/production. GDP increased 5.0% y/y in Q1 above expectations of 4.8% y/y, and industrial production beat expectations at 5.7% y/y (cons: 5.3% y/y) lifted by strong export growth. Retail sales for March disappointed growing only 1.7% y/y from an average of 2.8% y/y in the first two months of the year. The main good news came from house prices that fell -0.21% m/m, less than what we have seen lately, while the unemployment rate increased from 5.3% in February to 5.4% in March, the highest level since February last year. The 5% GDP growth will give some comfort to policymakers in Beijing, but they will stand ready to provide economic stimulus over the coming quarters if the hit from the Iran war, to both exports and domestic demand, starts to get stronger. The numbers added to the positive risk sentiment in Chinese stocks overnight and the CNY strengthened slightly.
What happened yesterday
In the Middle East, Israel's cabinet is discussing a potential ceasefire deal with Lebanon, which could be announced soon according to Lebanese officials. Ending the Lebanon conflict is seen as important for broader peace talks between the US and Iran. However, as Hezbollah is not part of the talks, it remains unclear if the group would comply with a ceasefire. US-Iran talks may resume in Pakistan this weekend after previous discussions stalled, although no date has been set yet. The Trump administration expressed optimism on Wednesday about resolving the conflict; President Trump stated in an interview with Fox news that the Iran war is "almost over". That is despite enforcing a shipping blockade, that so far appears to have made nine ships turn around in the Strait of Hormuz and as traffic through the Strait remains subdued compared to pre-war levels.
Oil kept steady yesterday at around USD 95/bbl as markets continued its optimism that the resumption of talks between the US and Iran will lead to an eventual reopening of the strait and normalisation of the supply situation.
In the US, Kevin Warsh's hearing in the Senate has been set for 21 April. While the hearing is an important step in the process to be confirmed as Fed chair, the sticking point remains Republican Senator Tillis' opposition to vote for his approval as long as an ongoing criminal investigation into Powell over cost overruns at the Fed's headquarters continues. Polymarket sees about a 60% chance that Kevin Warsh is confirmed before Powell's term ends in May. If Warsh has not been confirmed by then, Miran might be appointed acting Fed chair, while Powell may continue to serve as FOMC chair as his position on the board of governors runs until 2028.
In Denmark, the EUR/DKK spot rate briefly reached 7.4732 yesterday, the level that previously triggered intervention by Danmarks Nationalbank, putting the upper end of the peg to the EUR back in focus. While markets currently price a roughly 50% probability of a 10bp independent rate hike by Danmarks Nationalbank this year, we believe it is more likely that liquidity developments will ease the pressure on the DKK.
Equities: Equities continued moving higher, with the S&P 500 setting a fresh all-time high. However, market breadth was weak. The S&P 500 closed up 0.8%, while the Stoxx 600 ended 0.4% lower. Additionally, most sectors in the US were actually down, although heavyweight tech continued to outperform. Tech surged 1.6% yesterday, marking a three-percentage point outperformance compared to US industrials. Software alone rallied 4.4%.
FI and FX: The USD underperformed vs all G10 peers yesterday, although changes are generally quite modest. EUR/USD still hovers around 1.18. USD/JPY trades at just 159 while GBP/USD has moved closer to 1.36. In Scandies, the NOK rose throughout the day bolstered by risk-on. EUR/NOK has returned to levels just above 11.00. EUR/SEK defied positive risk sentiment throughout the European session, which could have been related to repatriation flows. In the US and Asian sessions, however, EUR/SEK followed the script and slipped below 10.80. There have been modest movements in global bond yields and swaps as the market eye an extension of the ceasefire between US and Iran. UST10y trades at 4.27%.
UK GDP Beats Expectations at 0.5% mom with Broad-Based February Growth
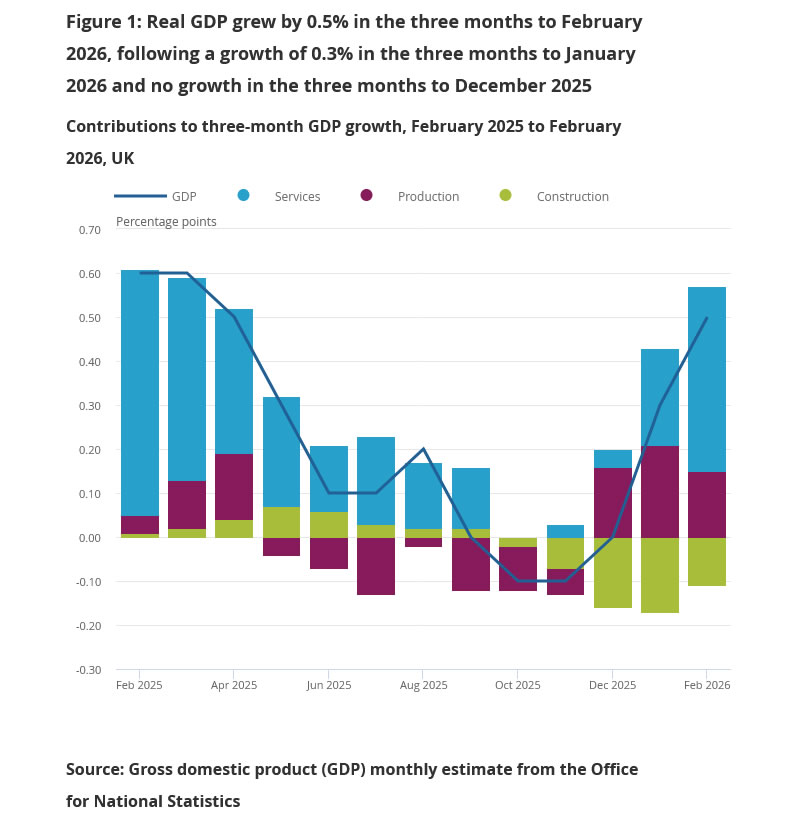
UK economic activity strengthened in February, with GDP rising 0.5% mom, well above expectations of 0.1% mom. The expansion was broad-based, with both services and production increasing by 0.5%, while construction posted a stronger 1.0% gain, pointing to a solid rebound in output.
On a three-month basis, growth also improved. GDP expanded by 0.5% in the three months to February, up from 0.3% in the three months to January. Services output rose by 0.5%, while production led with a 1.2% increase, suggesting underlying momentum in the industrial sector.
However, the picture remains uneven. Construction output fell by -2.0% over the three-month period, highlighting ongoing weakness in parts of the economy.
Overall, the stronger headline data provides some relief for growth concerns, but does not fully offset broader uncertainties tied to inflation pressures and external risks.
| Indicator | Latest | Notes |
|---|---|---|
| GDP | +0.5% | Much stronger than +0.1% expected |
| Services | +0.5% | Main driver of overall growth |
| Production | +0.5% | Broad-based industrial support |
| Construction | +1.0% | Rebound in February |
EUR/USD and GBP/USD Continue to Strengthen Ahead of Data Releases
European currencies are maintaining an upward trajectory, having reached previously outlined levels amid sustained demand for the euro and the pound. The current advance is developing against a backdrop of gradually shifting market expectations and ongoing pressure on the US dollar. However, as prices approach key levels, traders are increasingly factoring in the risk of slowing momentum and a transition to more subdued price action.
Support for European currencies is largely driven by expectations surrounding upcoming macroeconomic releases from the UK and the eurozone, which remain in sharp focus for investors. Forthcoming data on economic activity and business conditions could influence expectations regarding central bank policy and, in turn, demand for the euro and sterling. At the same time, the market remains cautious ahead of key US data, which could rebalance expectations for Federal Reserve policy and alter the current market dynamics.
EUR/USD
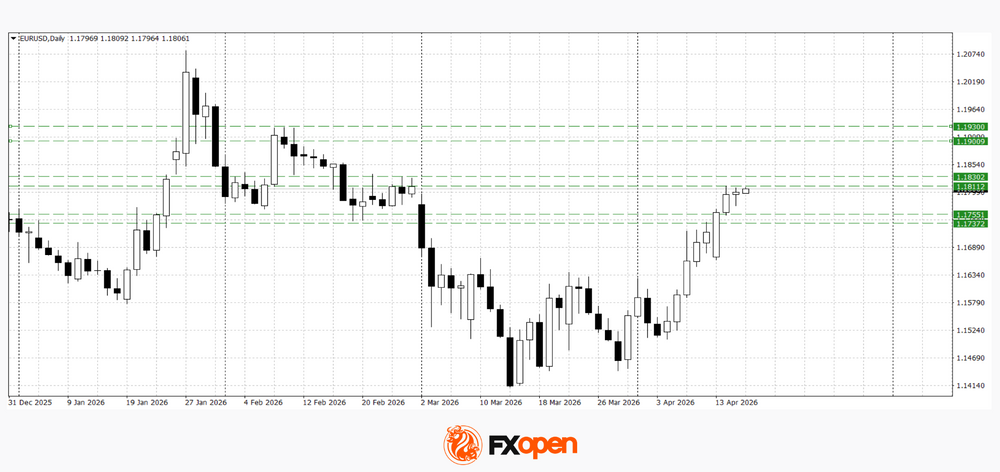
The EUR/USD pair is trading near the 1.1800–1.1830 range, confirming the persistence of bullish momentum following the breakout. Technical analysis suggests the potential for further gains towards 1.1900–1.1940, provided that 1.1800 holds as support. At the same time, a downside correction towards 1.1740–1.1760 cannot be ruled out in the event of weaker eurozone data or stronger-than-expected US figures.
Key events for EUR/USD:
- today at 13:45 (GMT+3): speech by Bundesbank representative Mauderer;
- today at 15:30 (GMT+3): Philadelphia Fed Manufacturing Index (US);
- today at 19:45 (GMT+3): speech by Bundesbank President Nagel.
GBP/USD
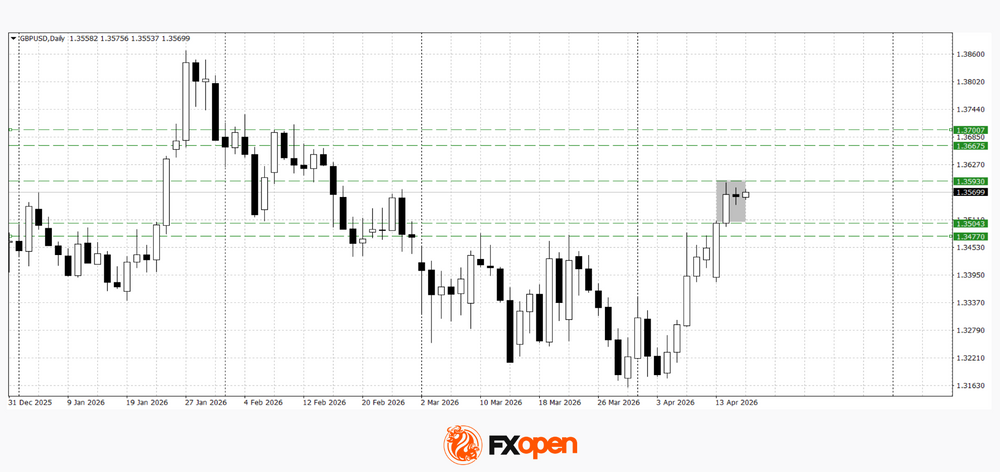
GBP/USD is showing a similar pattern, holding near recent highs and continuing within an upward trend. However, a “harami” reversal pattern formed on the daily chart yesterday, and confirmation of this signal could lead to a pullback towards 1.3480–1.3500. If the pair breaks above 1.3590, the uptrend may extend towards 1.3670–1.3700.
Key events for GBP/USD:
- today at 09:00 (GMT+3): UK Gross Domestic Product (GDP);
- today at 10:55 (GMT+3): UK manufacturing output;
- today at 18:40 (GMT+3): speech by Bank of England Deputy Governor Woods.
European currencies remain in an upward phase, having reached key reference levels, which increases uncertainty over the next directional move. Upcoming macroeconomic releases represent the main risk factor: depending on their outcome, the market may either extend the current uptrend or shift towards consolidation.
Trade over 50 forex markets 24 hours a day with FXOpen. Take advantage of low commissions, deep liquidity, and spreads from 0.0 pips (additional fees may apply). Open your FXOpen account now or learn more about trading forex with FXOpen.
This article represents the opinion of the Companies operating under the FXOpen brand only. It is not to be construed as an offer, solicitation, or recommendation with respect to products and services provided by the Companies operating under the FXOpen brand, nor is it to be considered financial advice.
WTI Crude Oil at Make-or-Break Zone, Bears Ready to Strike?
Key Highlights
- WTI Crude Oil failed to surpass $105 and trimmed most gains.
- A key bearish trend line is forming with resistance at $96.40 on the 4-hour chart of XTI/USD.
- Gold is facing a major hurdle near $4,950.
- EUR/USD seems to be consolidating gains above the 1.1740 support.
WTI Crude Oil Price Technical Analysis
WTI Crude Oil prices faced resistance near $105 against the US Dollar. The price started a fresh decline below $100 and $95.
Looking at the 4-hour chart of XTI/USD, the price settled below $95, the 100 simple moving average (red, 4-hour), and the 200 simple moving average (green, 4-hour). However, the bulls are active near the key support at $88.
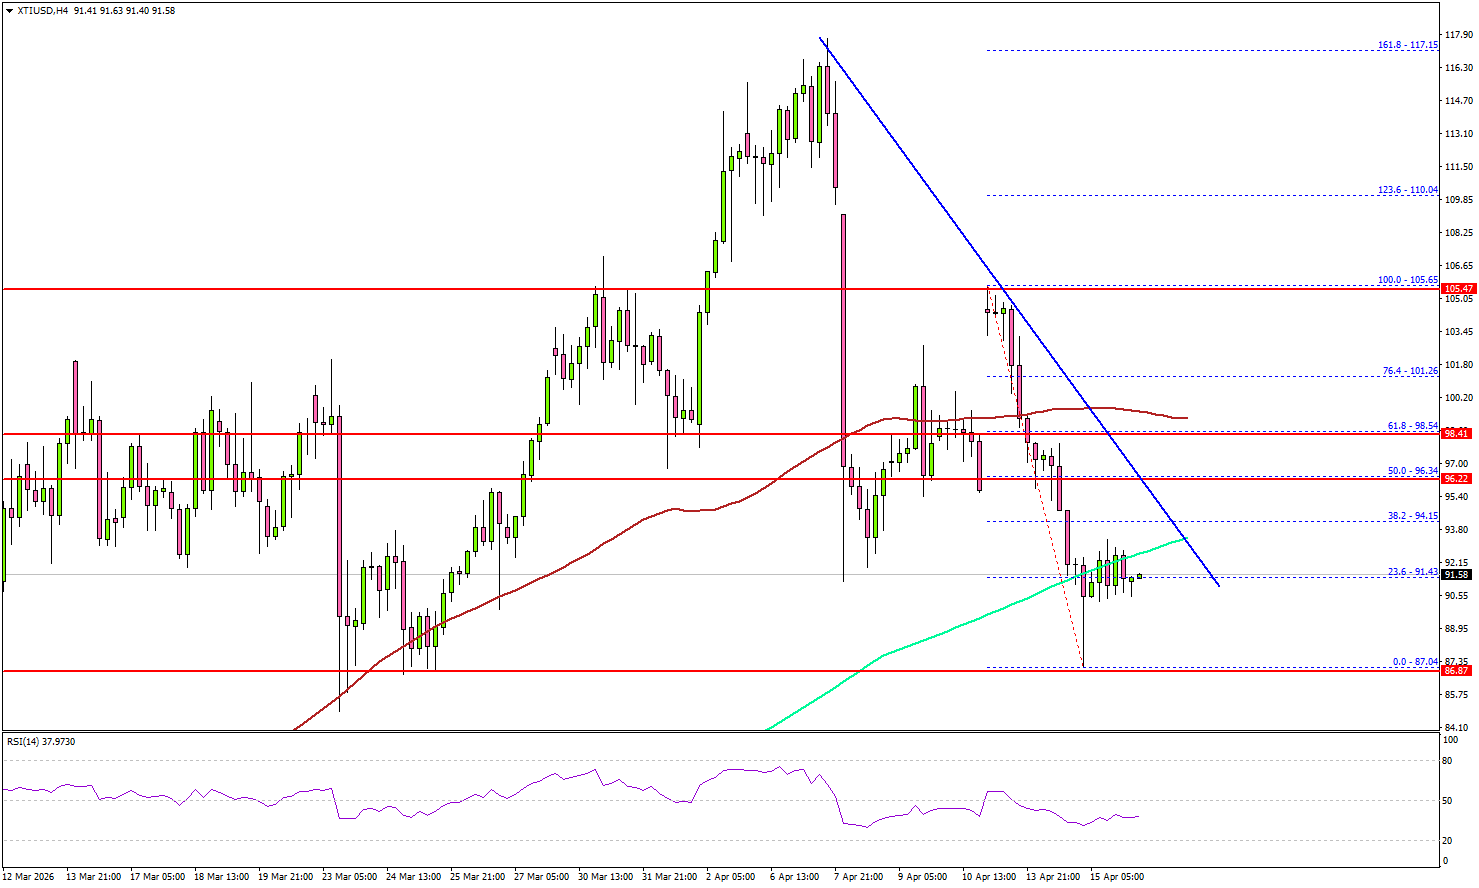
On the upside, immediate resistance is near the $95.00 level. The first key hurdle for the bulls could be $96.00. There is also a key bearish trend line forming with resistance at $96.40.
A close above $96.40 might send Oil prices toward $100. Any more gains might call for a test of $105 in the near term. On the downside, the first major support sits near the $88 zone. The next support could be $85.50, below which the price could dive and test $83.20.
A daily close below $83.20 could open the doors for a larger decline. In the stated case, the bears might aim for a drop toward $80.00.
Looking at Gold, there was a decent increase, but the bulls need to push the price above $4,950 for upside continuation.
Economic Releases to Watch Today
- US Initial Jobless Claims - Forecast 215K, versus 219K previous.
- US Industrial Production for March 2026 (MoM) – Forecast 0.1%, versus 0.2% previous.
China’s 5% GDP Growth Tops Forecasts as Supply Holds Firm, Demand Lags
China’s economy delivered a stronger-than-expected start to the year, with GDP expanding 5.0% yoy in Q1, accelerating from 4.5% in the previous quarter and beating expectations of 4.8%. Officials described the performance as a “solid start,” pointing to improving macro indicators and emerging growth drivers. The data suggests that policy support and industrial resilience continue to underpin activity.
However, the details reveal a more uneven picture beneath the headline. Industrial production rose 5.7% yoy in March, slowing slightly from February's 6.3%, but still outperforming forecasts of 5.4%, highlighting steady supply-side strength. In contrast, retail sales increased just 1.7% yoy, missing expectations of 2.8% yoy and signaling weakness in consumer demand.
Investment data reinforces this imbalance. Fixed asset investment edged lower to 1.7% ytd yoy, below expectations of 1.8%, with the property sector remaining a major drag. Property investment fell -11.2%, while private investment declined -2.2% in Q1, underscoring fragile business confidence and ongoing structural headwinds.
NBS officials acknowledged these challenges, warning that the external environment is becoming “more complex and volatile,” while the imbalance between strong supply and weak demand remains acute. This dynamic raises questions about the sustainability of the current growth pace, particularly as domestic demand struggles to gain traction.
Looking ahead, the outlook remains cautious. Beijing has set a more flexible growth target range of 4.5% to 5% for the year, while the IMF recently trimmed its forecast to 4.4%, citing weak domestic activity and geopolitical risks.
| Indicator | Latest | Notes |
|---|---|---|
| GDP | 5.0% | Accelerated from 4.5%, beat 4.8% expectation |
| Industrial Prod'n | 5.7% | Slowed from 6.3% but above 5.4% forecast |
| Retail Sales | 1.7% | Down from 2.8%, missed 2.4% expectation, weak demand |
| Fixed Asset Inv. | 1.7% | Slightly down from 1.8%, below 1.9% forecast |
| Property Inv. | -11.2% | Continued deep contraction, slightly worse than prior |
| Private Inv. | -2.2% | Still negative despite slight improvement from -2.6% |
Australia’s 17.9k Job Growth Driven by Full-Time Gains, Unemployment Rate Steady at 4.3%.
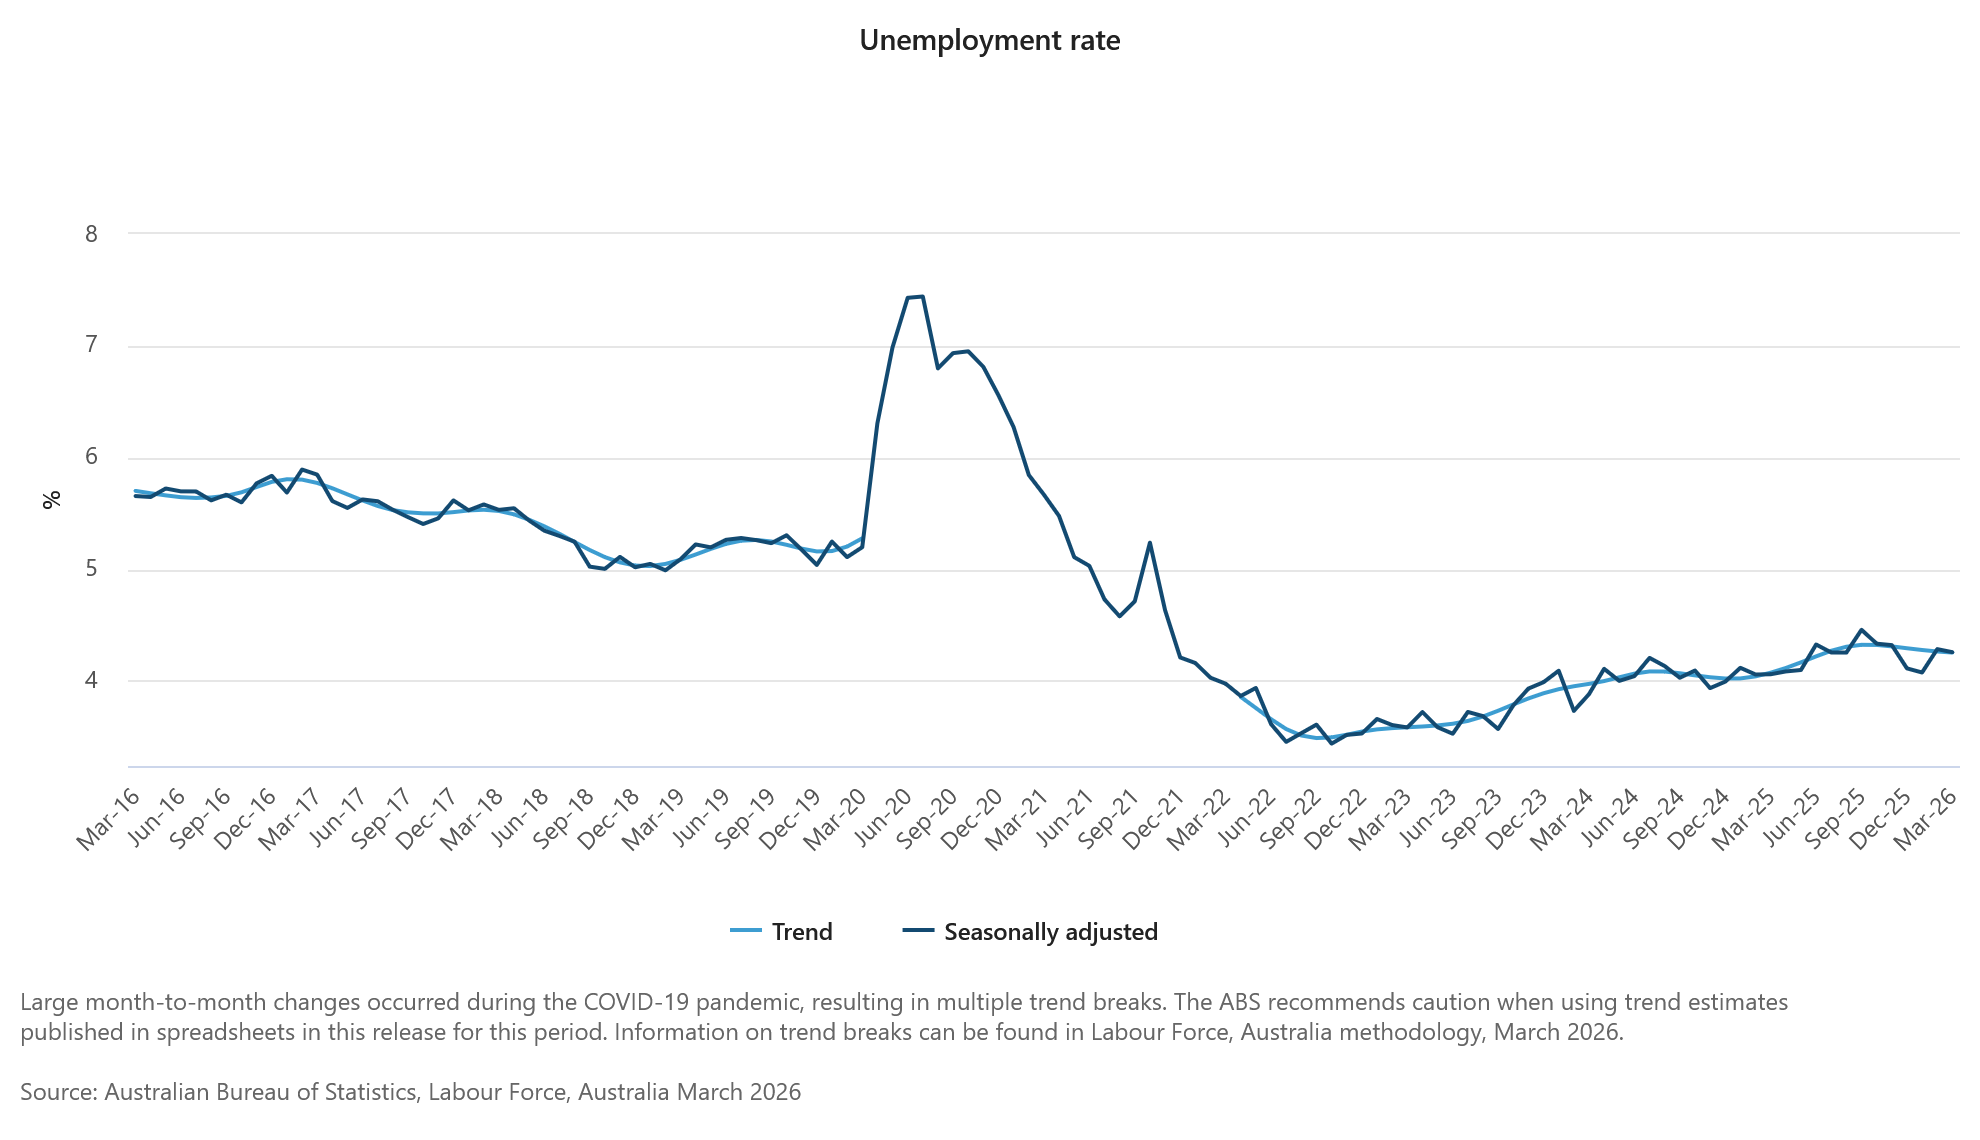
Australia’s labor market showed steady conditions in March, with employment rising by 17.9k, in line with expectations, while the unemployment rate held at 4.3%. The data suggests underlying resilience, even as participation edged slightly lower from 66.9% to 66.8%.
The composition of job growth, however, points to improving quality. Full-time employment surged by 52.5k, more than offsetting a sharp -34.6k decline in part-time roles. This shift toward full-time work was reflected in stronger labor utilization, with total hours worked rising by 0.5% mom, equivalent to an additional 9.2 million hours.
Overall, the report indicates a stable but firm labor market backdrop. While headline job growth was moderate, the strength in full-time employment and hours worked suggests solid demand for labor. That could keep underlying wage pressures supported, even as the slight dip in participation hints at some softening at the margins.
| Indicator | Latest | Details |
|---|---|---|
| Employment Change | +17.9k | In line with expectations |
| Full-Time Employment | +52.5k | Strong increase |
| Part-Time Employment | -34.6k | Sharp decline |
| Unemployment Rate | 4.3% | Unchanged |
| Participation Rate | 66.8% | Slight decrease |
| Monthly Hours Worked | +0.5% mom | Solid increase |
| Total Hours Change | +9.2M | Full-time +7.1M, Part-time +2.1M |
ECB’s Schnabel Signals No Rush to Hike, Warns Against Premature Tightening
ECB Executive Board member Isabel Schnabel signaled that the central bank is in no rush to adjust policy, emphasizing that the current stance allows time to assess the impact of the latest energy shock. Speaking in Washington on Wednesday, she said the ECB is in a “relatively favorable” position after having brought inflation back to target before the Middle East conflict, adding that “we do not need to rush into action.”
Schnabel highlighted the complexity of the current environment. While rising energy prices could prove inflationary, the Eurozone’s status as a net energy importer means higher fuel costs may simultaneously weaken growth. That dynamic could limit firms’ ability to pass on higher costs and reduce workers’ bargaining power, creating a two-sided risk where inflation and activity move in opposite directions.
Against this backdrop, she stressed the need for caution and data dependence. Policymakers must watch closely for signs that inflation could become entrenched through second-round effects, but at the same time avoid overreacting. “We have to weigh our policy decisions very carefully,” she said, warning that the ECB must not impose an “unnecessary cost” on the economy through premature tightening.