Sample Category Title
Oil Slips, Kiwi Jumps, Euro Firms as Markets Cautiously Price Iran Deal
Markets are still trading as though peace is coming — even though not with the same confidence seen at the start of the week. Brent oil prices slipped again today to below $93 as investors continued betting that the United States and Iran are inching closer toward a broader agreement that could eventually reopen the Strait of Hormuz and ease fears of a prolonged global energy shock. But the easy part of the “peace dividend” trade now appears over. Traders are demanding proof before pushing oil sharply lower again.
The most important signal may actually be coming from bond markets rather than oil itself. Treasury yields have eased from their recent highs but are refusing to collapse, suggesting fixed-income traders remain deeply skeptical that inflation risks will disappear quickly. The logic is straightforward: if negotiations fail or energy disruptions intensify again, another inflation shock could rapidly force central banks back into a much more aggressive tightening posture. That is particularly important for Europe, where policymakers increasingly believe the energy shock is already spreading through the broader economy regardless of whether a final Iran deal eventually materializes.
Meanwhile, currency markets reflected widening central bank divergence rather than pure geopolitical positioning. New Zealand Dollar led gains after the Reserve Bank of New Zealand delivered a sharply hawkish hold that surprised markets. Policymakers split evenly 3-3 on whether to raise rates immediately, forcing Governor Anna Breman to use her casting vote to keep the OCR unchanged at 2.25%. The RBNZ also warned that rates would likely need to rise “sooner and by more” than previously projected. That dramatically strengthened expectations that the July meeting is now live for a hike, even though broader market consensus still leans toward September tightening.
Euro also remained firmly bid as senior European Central Bank officials continued preparing investors for a June hike. ECB Executive Board member Isabel Schnabel warned this week that “looking through is no longer an option,” while ECB Chief Economist Philip Lane effectively endorsed tighter market pricing by saying investors did not need “extra guidance.” The key issue for the ECB now is no longer whether inflation will rise — it is whether policymakers can stop energy costs from embedding themselves into wages and broader pricing behavior across the Eurozone economy.
On the other side of the spectrum, Australian Dollar and Canadian Dollar both struggled. Aussie weakened after softer-than-expected April inflation data reduced urgency for another Reserve Bank of Australia rate increase. While markets still see some possibility of an August hike, deteriorating labor-market conditions and easing headline inflation have clearly weakened conviction compared with a week ago. Canadian Dollar also remained under pressure as falling crude prices eroded one of the Loonie’s key macro supports.
Meanwhile, Dollar traded closer to the middle of the performance table, caught between losses against the increasingly hawkish Kiwi and Euro, and support from cautious Treasury markets that still see meaningful inflation risks if Iran negotiations ultimately fail.
EUR/CAD Rally Continues as ECB Officials Prepare Markets for June Hike
EUR/CAD surged as ECB officials increasingly prepared markets for a June rate hike while falling oil prices weakened Canadian Dollar. The widening divergence between Europe’s inflation fears and Canada’s fading commodity support is now becoming one of the main macro themes in FX markets. Read More.
Fed’s Kashkari Warns of Rising Inflation Risks, But Says It’s Too Soon to Predict Rate Hike
Minneapolis Fed President Neel Kashkari warned that inflation risks are “higher, not lower” as the Iran conflict continues pushing energy and supply-chain costs higher globally. But despite rising market bets on a Fed hike later this year, Kashkari said it remains “far too soon” to predict the timing of the next move. Read More.
AUD/NZD Correction Risk Growing After RBNZ and Australia CPI, But Confirmation Still Missing
AUD/NZD tumbled after markets were hit by simultaneous surprises from both sides of the Tasman — a much more hawkish RBNZ hold and softer Australian inflation data. Correction risks are clearly building, but traders are still waiting for the decisive technical breakdown needed to confirm a larger reversal. Read More.
RBNZ Delivers Hawkish Hold as Split Vote Signals Rate Hikes Coming Soon
The RBNZ may have held rates unchanged at 2.25%, but the decision was one of the most hawkish holds in years. A shock 3-3 split vote forced Governor Anna Breman to use her casting vote, while policymakers warned that OCR hikes will likely come “sooner and by more” than previously expected. Read More.
Australia CPI Slows More Than Expected to 4.2% as Fuel Inflation Eases
Softer fuel inflation helped cool Australia’s headline CPI in April, easing immediate pressure for another RBA hike. But trimmed mean inflation climbed to its highest level since mid-2024, reinforcing concerns that underlying price pressures are still proving sticky. Read More.
EUR/JPY Daily Outlook
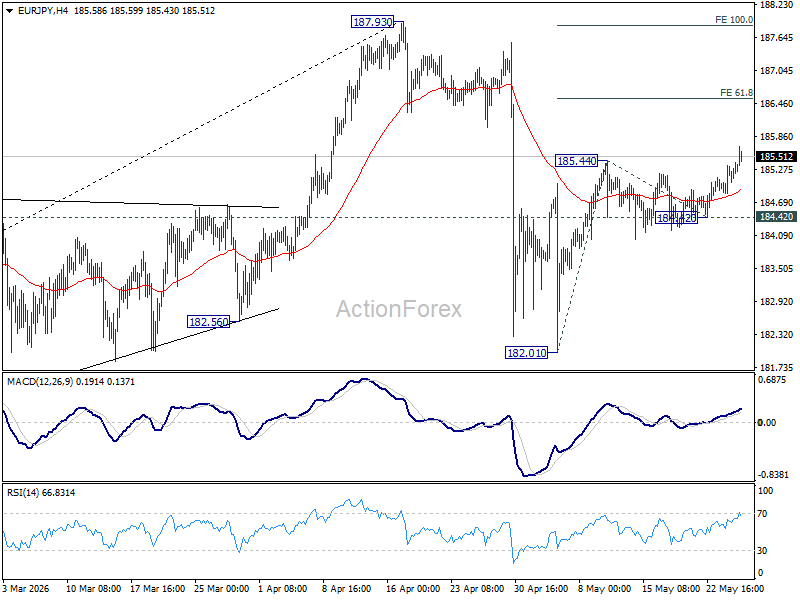
EUR/JPY's rebound from 182.01 resumed today and intraday bias is back on the upside. Next target is 61.8% projection of 182.01 to 185.44 from 184.42 at 186.53. Near term risk will stay on the upside as long as 184.42 support holds, in case of retreat.
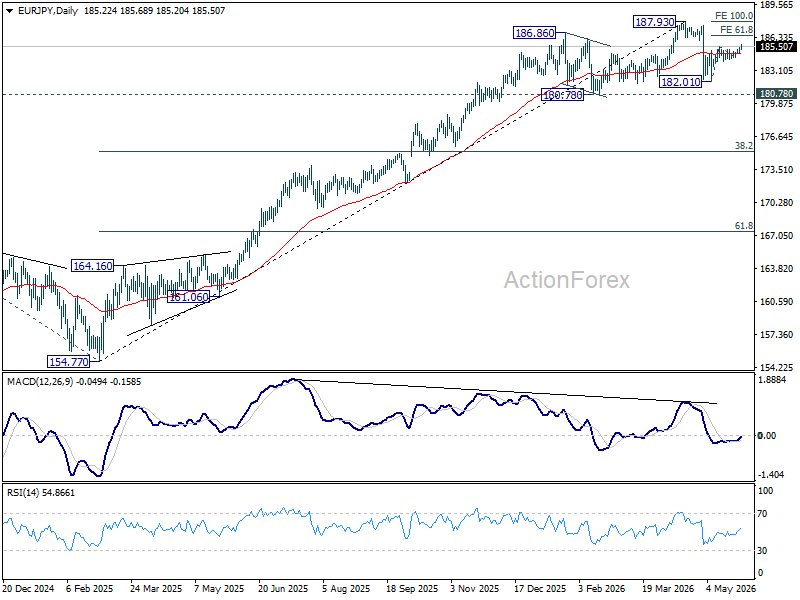
In the bigger picture, the pullback from 187.93 is steep, there is no sign of reversal yet. Uptrend from 114.42 (2020 low) is still expected to resume at a later stage to 78.6% projection of 124.37 (2022 low) to 175.41 (2025 high) from 154.77 at 194.88. However, sustained break of 55 W EMA (now at 178.51) will argue that it's already in a medium term down trend to 175.41 resistance turned support and below.
Is It Too Late for a US-Iran Breakthrough to Stave Off an Inflation Shock?
- US and Iran talks make progress but key obstacles remain.
- Hopes rise of an end to the Strait of Hormuz blockade.
- But oil inventories are depleting fast; how long before they run out?
- Is the worst of the energy crisis yet to come?
Risk of complacency
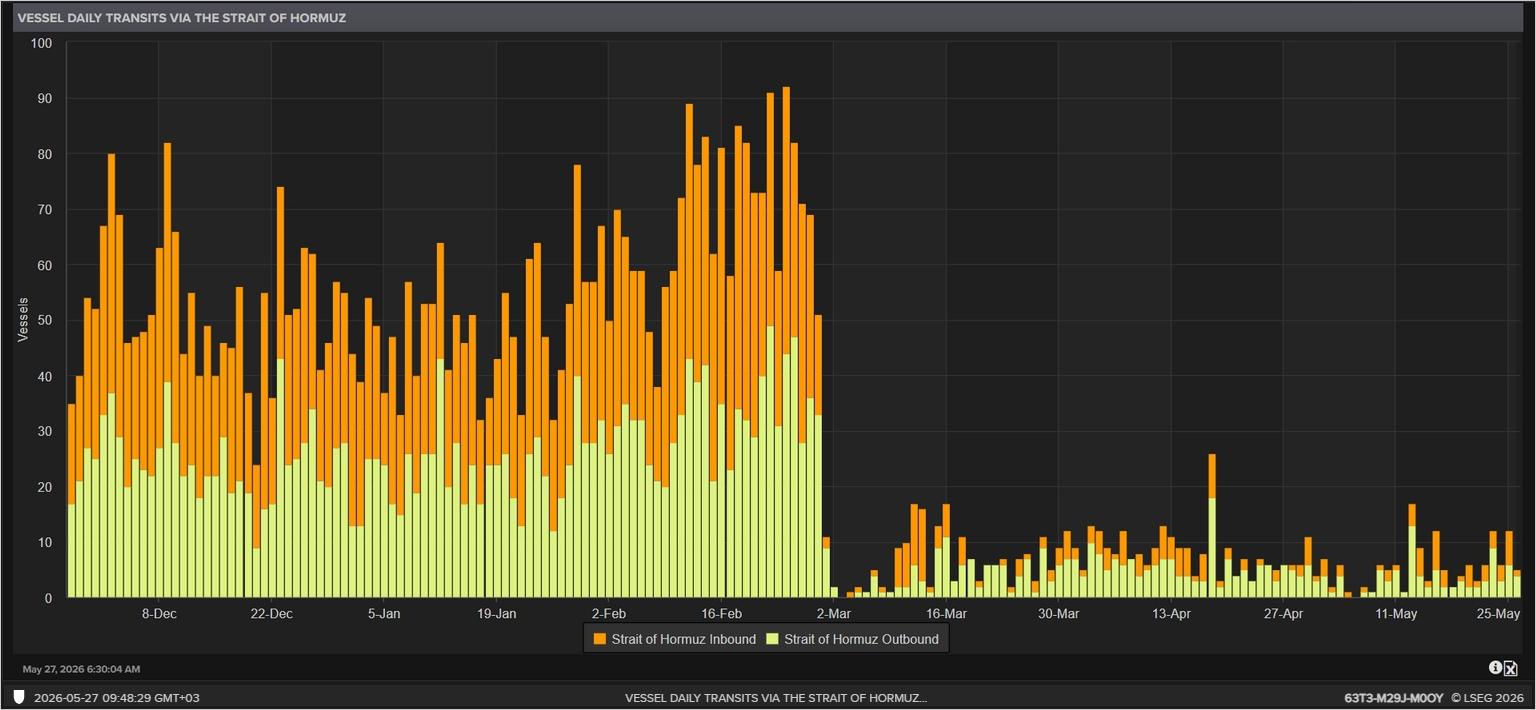
It’s been almost two months since the United States and Iran agreed to a ceasefire, bringing a temporary pause to the intense missile and drone strikes that crippled the region’s energy infrastructure. Yet, the cessation of hostilities has not brought about a reopening of the Strait of Hormuz – a vital passageway for global energy shipments – that handles about 20% of the world’s oil and gas supplies. While some traffic has resumed, daily volumes are a fraction of pre-war levels.
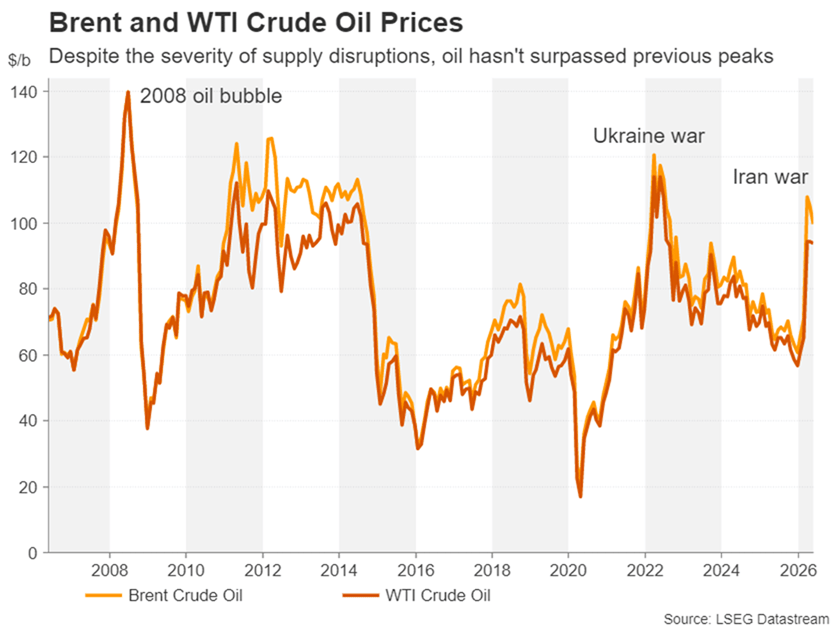
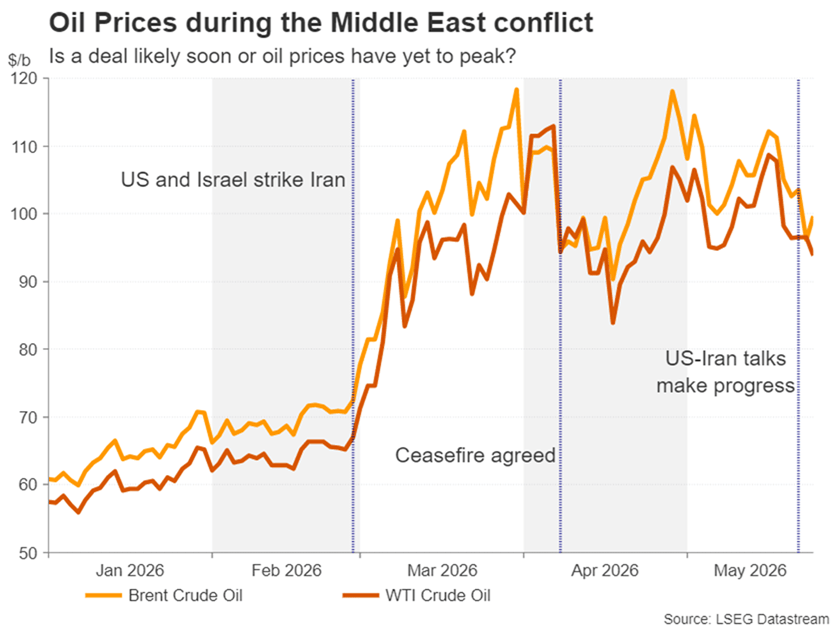
The severity of such a critical chokepoint remaining shut for a prolonged period should not be underestimated. But there’s a real danger that investors have been complacent about the risks. From a historic measure, the key crude oil benchmarks – Brent and WTI futures – peaked below the previous shocks in 2008 and 2022. This, despite the current crisis in the Middle East posing a bigger threat to longer-term supplies than either the supply-demand imbalance of 2008 or the sanctions imposed on Russia for its invasion of Ukraine in 2022.
A US-Iran deal may not be easy
The complacency can likely be explained by optimism that the war will not last long. Investors believe President Trump will not want the war to drag on for too long, as his popularity has plummeted in domestic polls, just months before November’s mid-term elections. Many are already speculating that the current ceasefire was initiated because Trump is seeking an exit from the war after failing to achieve a quick win by toppling the Iranian regime and imposing a one-sided deal on Tehran.
But the Iranians are remaining defiant and taking a tough stance in the negotiations by defending their right to a ‘civilian’ nuclear programme. The Americans, however, are adamant that Iran must not be able to develop nuclear weapons and are demanding that Iran surrender its existing stockpile of enriched uranium.
As things stand, the best that can be hoped for is a framework agreement for a permanent solution that would pave the way for the reopening of Hormuz. Nevertheless, after weeks of talks, the negotiations finally seem to be going somewhere, with reports suggesting that a deal is 95% complete.
Oil’s rollercoaster ride
In many ways, oil’s price action since March demonstrates the frequently shifting sentiment on the expected duration of the conflict. The simultaneous formation of lower highs and higher lows that typically constitute a pennant pattern reflects the mood swings from hope to fear, with the pennant’s very wide angle indicative of the heightened volatility. But essentially, oil has been in a consolidation phase that may now be coming to an end.
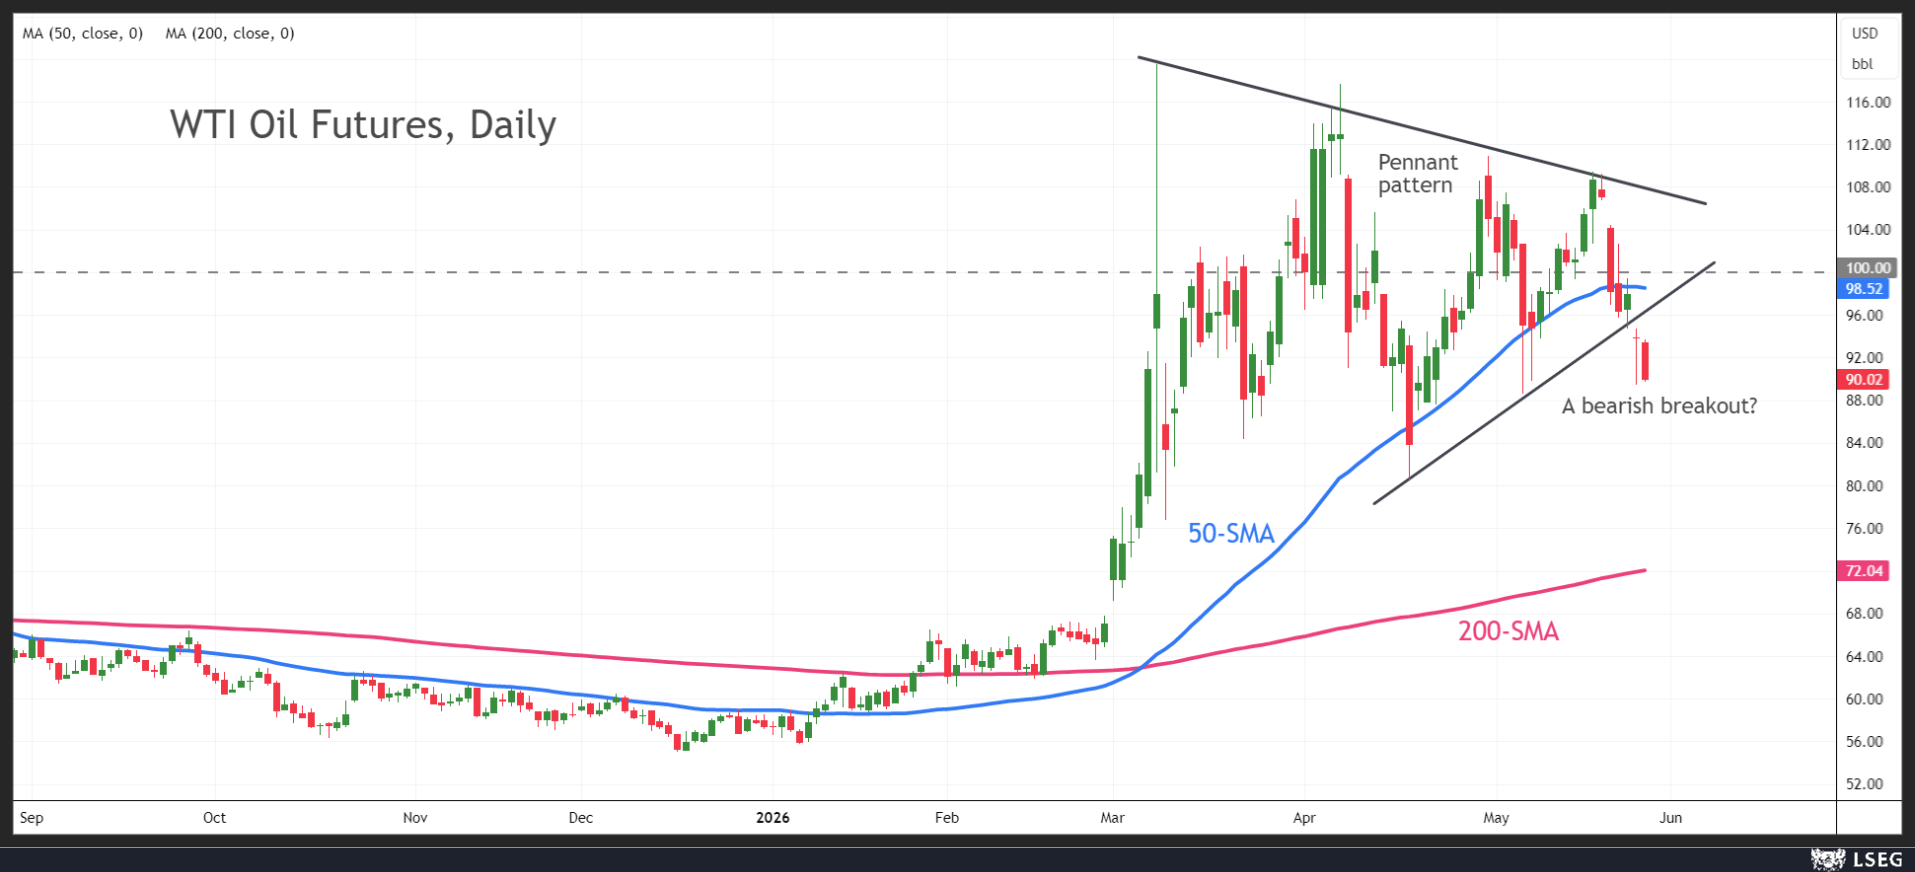
The guarded optimism that kept oil from surpassing the March 9 peak of just below $120 a barrel but still very elevated near $100 barrel, has given way to the bears. News over the weekend that the US and Iran standoff could soon be over has led to a downside breakout below the pennant.
Is Oil turning bearish?
At this point, the risk of this being a false breakout is quite high, as a lot could still go wrong in the negotiations and there’s already been one military flare-up this week. Whilst there are a number of sticking points that must be resolved, the two most critical ones are about Iran’s nuclear disarmament and control of the Strait of Hormuz.
The fact that Iran appears to have agreed in principle to give up its highly enriched uranium in return for sanctions relief is encouraging. It’s also positive (for the global economy, not so much for the oil rally) that both sides are prioritizing the reopening of Hormuz.
Trump wants a deal
With regional mediators and powers stepping up diplomatic efforts, and President Trump signalling his willingness to allow the negotiators some time to work out the details, there is a good reason to be hopeful. However, the devil is in the details and so an agreement could take far longer than anticipated, not to mention the risk of the talks breaking down, particularly over the thorny issue of Tehran handing over its enriched uranium.
So where does all this leave oil supplies? Even in the best-case scenario that the US and Iran end their respective blockades of the Strait of Hormuz, it could be some time before any deal goes into effect and after that for energy flows to fully normalize. Hence, there’s a danger that it may be too late for the energy market to avoid a crunch point.
Are energy shortages looming?
One of the reasons why oil prices didn’t skyrocket even higher during this crisis is that most countries had significant inventories of crude oil and natural gas to fall back on. But with only a handful of oil and LNG tankers being allowed to pass through the Strait, some countries could begin to run out of stockpiles within weeks.
Many governments have sounded the alarm about impending energy shortages, taking various contingency measures, but it’s unclear how well prepared the world is for a worsening energy crisis if the Hormuz issue isn’t resolved soon.
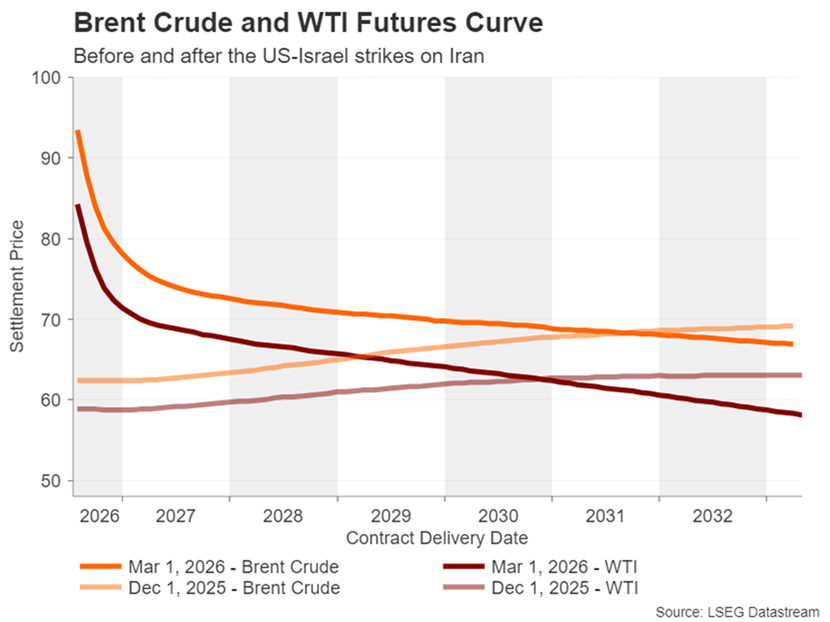
Yet, even with inventories depleting at a worrying speed, oil traders don’t seem too concerned. In fact, the oil futures curve has been in backwardation since March, signalling that oil prices will begin to fall substantially towards the end of the year.
Gulf Oil buyers look elsewhere
This may not be totally improbable. There are several factors why the energy crisis may not be as serious as many people fear. Despite all the headlines, the Strait of Hormuz isn’t completely closed off, and some oil and gas shipments have been able to get through. Moreover, both Iran and Saudi Arabia – the region’s largest producer – have alternative export routes to the Persian Gulf, so they are still able to export some oil.
Primarily, though, Iran’s largest customer – China – continues to buy Iranian oil, maintaining at least 50% of its imports from the country. In the meantime, India, which is another big energy importer, has been able to buy more oil from Russia, following the easing of some sanctions on Moscow to alleviate the oil supply problems.
Aside from Russia, other countries such as Brazil and Norway, not to mention the United States, have benefited too from the blockade of Hormuz. This diversification away from the Middle East, not just towards alternative suppliers but also towards alternative sources like renewable energy, could prevent the energy price shock from becoming too acute.
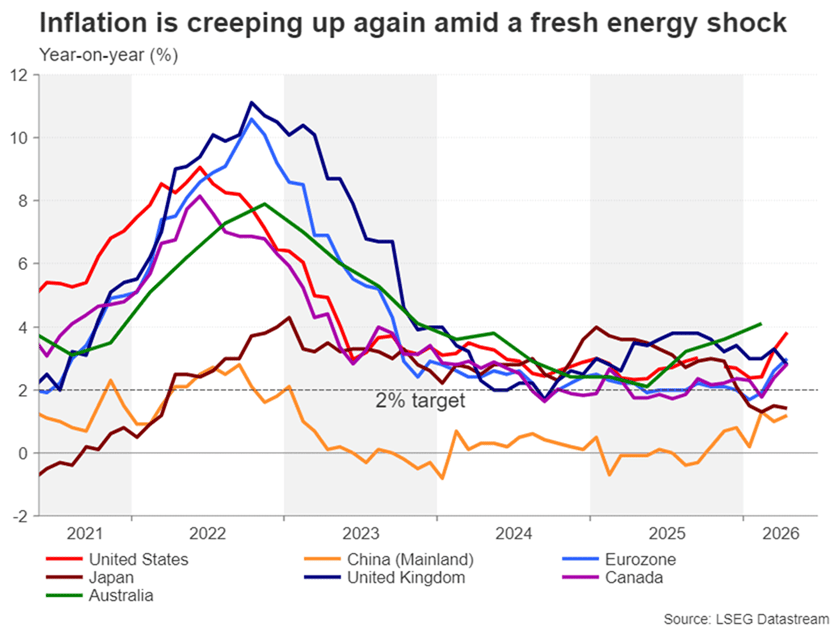
Inflation is on the way up
However, it’s not just the disruption to oil and gas exports that poses a major inflation headache. The region is a key hub for other vital exports around the world such as agricultural fertilizers, industrial chemicals, petrochemicals, and even aluminium. Hence, one way or another, the inflation effect will be felt.
More crucially, the backwardation in the oil futures curve could be explained by the anticipation that at some point, higher energy prices will cause demand destruction, rather than by the optimism that the US and Iran will be able to settle their differences quickly and reach a deal.
Demand destruction can occur not just from the higher prices themselves, but from higher interest rates too, as central banks would need to respond to rising inflation. According to the World Bank, a 10% jump in oil prices causes a 0.35% rise in global inflation within a year and a 0.55% increase within three years.
Rate hikes are coming
If those estimates are applied to the current crisis and taking the international benchmark of Brent crude as the oil price, then the 60% year-to-date gain could lead to a more than 2% increase in global inflation next year. With inflation in most countries already above central banks’ 2% target, such an acceleration is enough to warrant tighter monetary policy.
So far, only the US Federal Reserve appears to be looking through this latest inflation uptick. If there is a deal soon, it may just get away with keeping interest rates on hold. But a more likely outcome is that it will be months before oil prices retreat substantially below the $100 region and the Fed will have no choice but to follow its global peers in hiking rates.
The bigger question mark, though, may not be whether interest rates will go up or not, but by how much. Right now, there’s a greater risk investors have been too conservative with their rate hike expectations and once reality hits, they will overcompensate by pricing in more tightening than is needed. However, if the worst-case predictions do not materialize, a relief rally is almost certain to follow.
XAU/USD: Gold Remains at the Back Foot on Fragile Geopolitical Situation
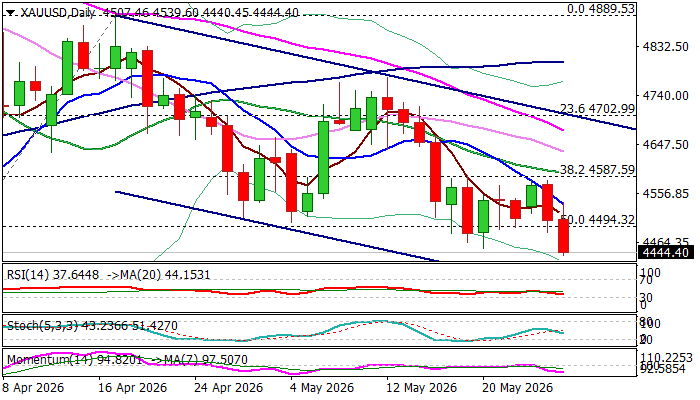
Gold holds in red for the second consecutive day on Wednesday and pressure the floor of seven-day range ($4453), also moving into lower part of short-term bear-channel (off $4889, mid-Apr peak).
Fading hopes of a peace deal in the Middle East revive inflation concerns and hawkishness in the interest rate outlook that adds pressure on the yellow metal.
Weakening structure on daily chart (the price remains under daily cloud for almost two weeks / negative momentum studies / DMAs in bearish configuration) keeps the downside at increased risk.
Eventual sustained break of pivotal $4500 support zone (after a multiple rejections) would generate bearish continuation signal and expose next key supports at $4401 (Fibo 61.8% of $4099/$4889 upleg); $4388 (200DMA) and $4367 (bear channel support line), violation of which would accelerate short-term downtrend.
Res: 4494; 4535; 4585; 4594.
Sup: 4401; 4388; 4367; 4300.
EUR/USD: Regains Traction But Faces a Number of Strong Technical Barriers
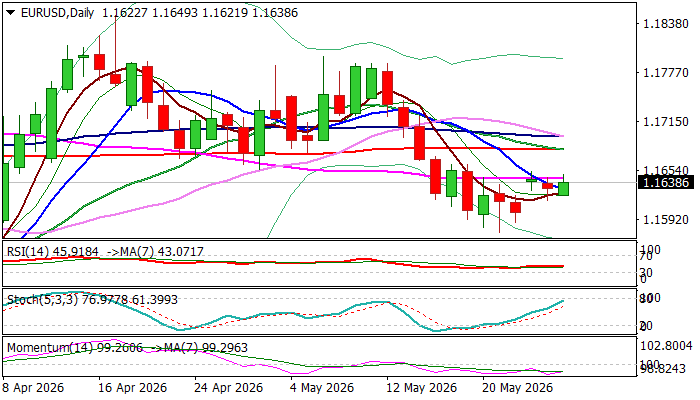
The Euro edged higher on Wednesday morning but still holds within a narrow range that extends into third straight day and below strong technical resistances.
Lack of clearer signals (geopolitical/macroeconomic) keeps near term action in quiet mode, though with persistent worries of worsening conditions that would keep focus shifted from riskier assets and continue to underpin the dollar.
Technical picture on daily chart is predominantly bearish (thickening cloud above / MAs in bearish configuration / negative momentum) and supports near term outlook.
Initial barrier, provided by 55DMA (1.1645, where repeated failure has been registered in past few sessions) is under pressure again, guarding more significant resistances at 1.1669 (daily cloud base); 1.1680 (converged 20/200DMAs, on track to form death cross / 50% retracement of 1.1788/1.1576) and 1.1697 (converged 30/100DMAs, about to create bear cross/cloud top).
Strong headwinds are expected at this zone, adding to likely scenario of limited upticks and keeping larger bearish bias.
Conversely, firm break of all these barriers would strengthen near term structure and shift focus to the upside.
Res: 1.1669; 1.1680; 1.1697; 1.1707.
Sup: 1.1628; 1.1616; 1.1576; 1.1500.
EUR/USD Daily Outlook
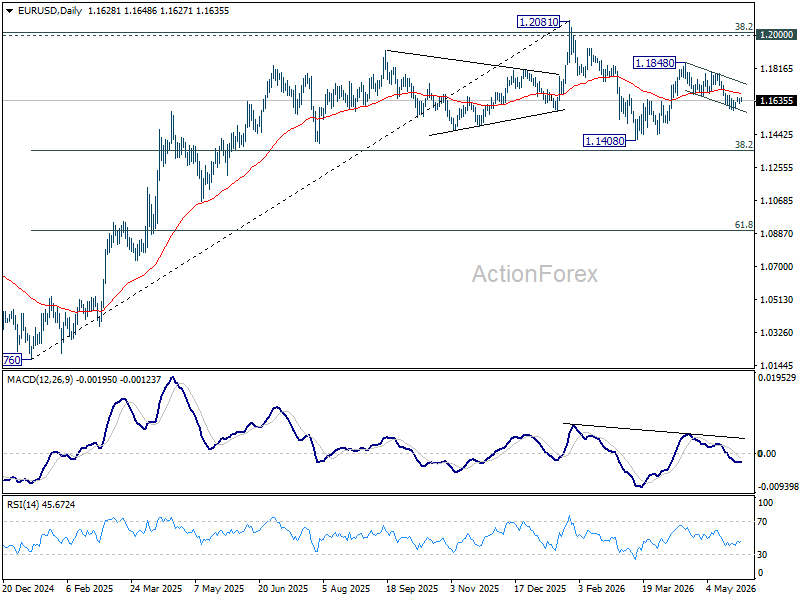
EUR/USD is still bounded in range of 1.1575/1660 and intraday bias remains neutral. On the upside, firm break of 1.1660 resistance will argue that fall from 1.1848 has completed as a correction at 1.1575. Intraday bias will be back on the upside for 1.1795 resistance first. On the downside, break of 1.1575 will solidify the case that rebound from 1.1408 has completed at 1.1848, and bring deeper fall back to retest 1.1408 low.
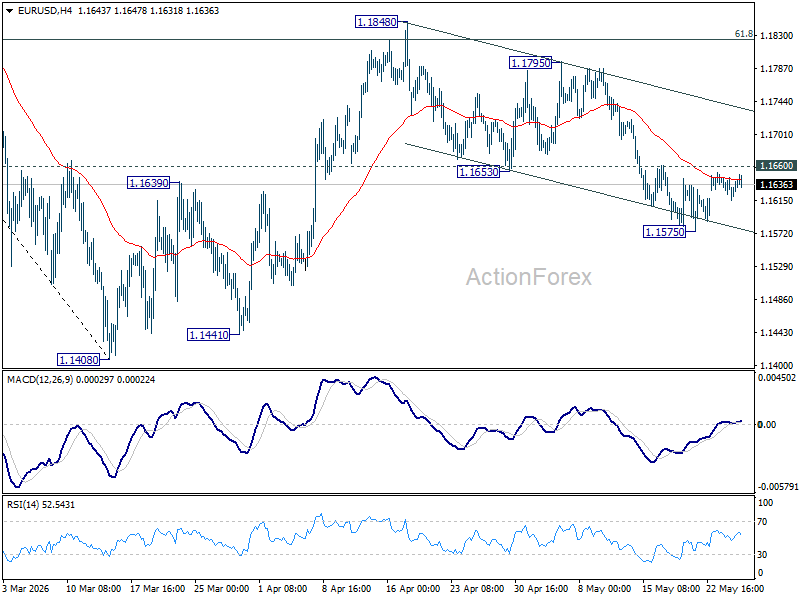
In the bigger picture, the strong support from 38.2% retracement of 1.0176 to 1.2081 at 1.1353 suggests that the pullback from 1.2081 is more likely a corrective move. Strong support was also found in 55 W EMA (now at 1.1544). Focus is back on 1.2 key cluster resistance level. Decisive break there will carry long term bullish implications. Nevertheless, break of 1.1408 support will revive the case of medium term bearish trend reversal.
USD/JPY Daily Outlook
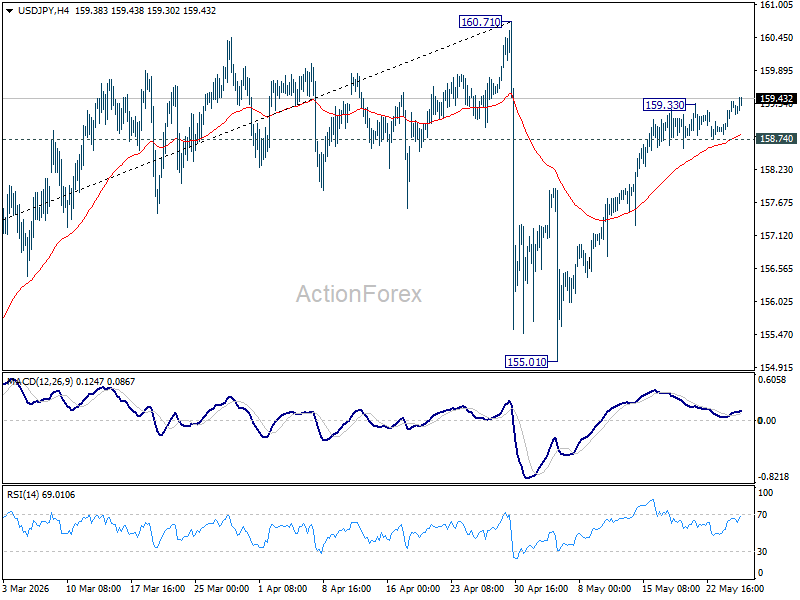
USD/JPY's rise from 155.01 resumed by breaking through 159.33 temporary top. Intraday bias is back on the upside for retesting 160.71 high. Strong resistance is expected from there to start the third leg of the near term corrective pattern. On the downside, break of 158.74 minor support will turn bias to the downside for 55 D EMA (now at 158.29) and below.
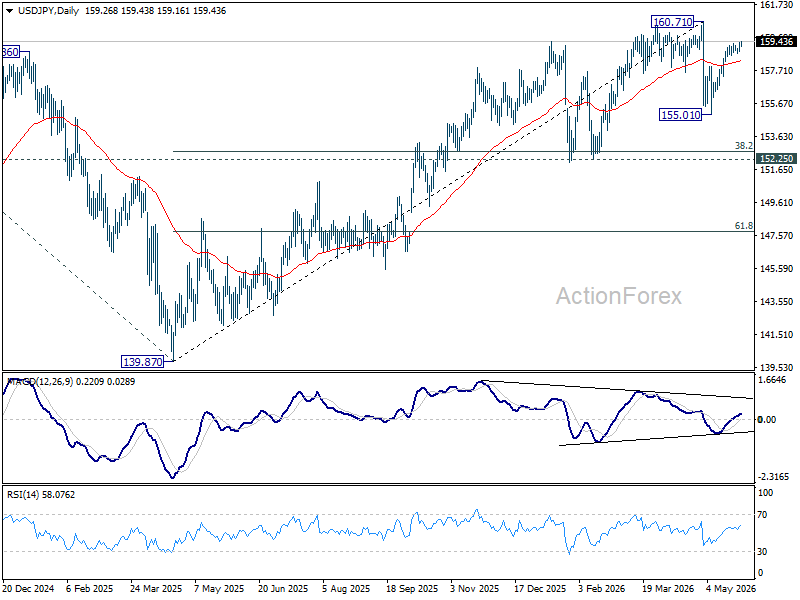
In the bigger picture, for now, corrective pattern from 161.94 (2024 high) is still seen as completed at 139.87. Rise from there is seen as resuming the long term up trend. So, break of 161.94 is expected at a later stage to resume the long term up trend. However, sustained break of 55 W EMA (now at 154.53) will dampen this view and bring deeper fall back towards 139.87 to extend the pattern from 161.94.
GBP/USD Daily Outlook
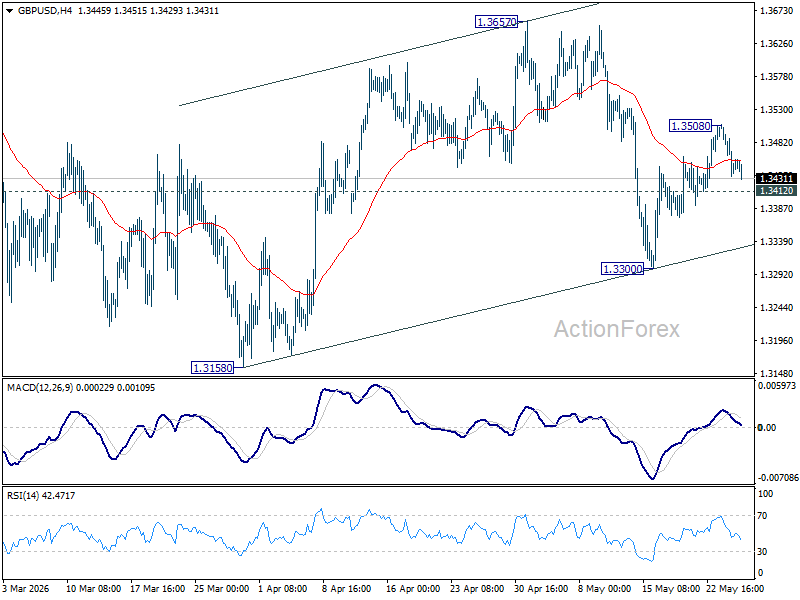
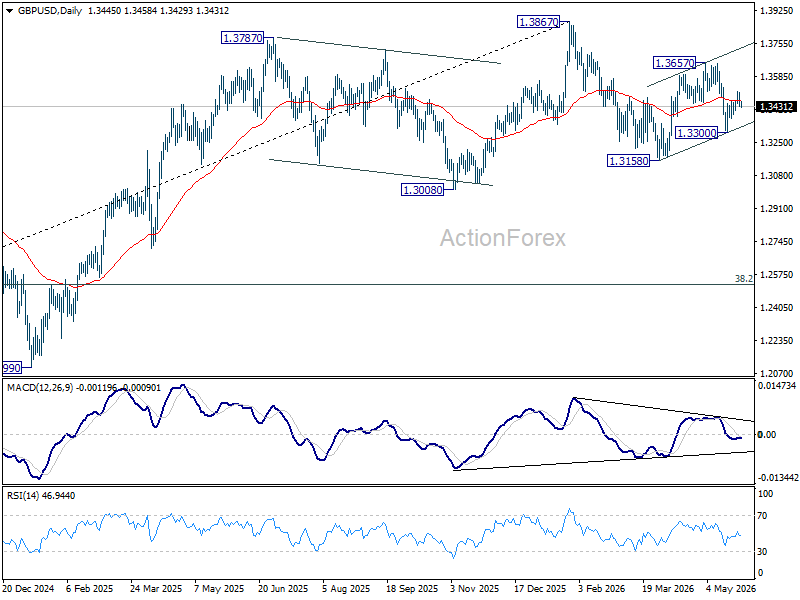
Intraday bias in GBP/USD is turned neutral again with current retreat. Above 1.3508 will extend the rebound from 1.3300 to 1.3657 resistance first. Firm break there will resume the rally from 1.3158. However, break of 1.3412 minor support will turn bias back to the downside for 1.3300 instead.
In the bigger picture, current development suggests that price actions from 1.3867 are merely a corrective pattern within the broader up trend from 1.0351 (2022 low). With 1.3008 support intact, medium term bullishness is maintained and break of 1.3867 is in favor for a later stage, towards 1.4248 key resistance (2021 high). However, firm break of 1.3008 will at least bring deeper fall to 38.2% retracement of 1.0351 to 1.3867 at 1.2524, with increased risk of bearish reversal.
USD/CHF Daily Outlook
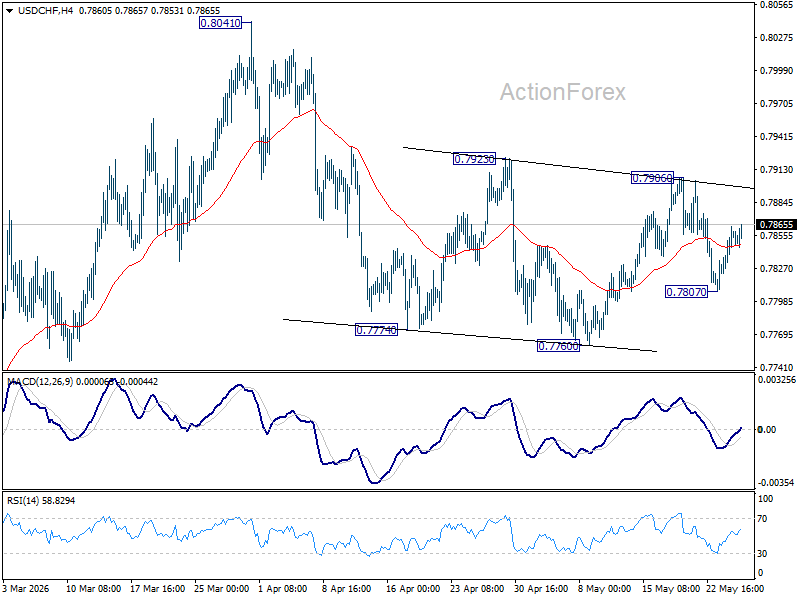
Intraday bias in USD/CHF remains neutral for the moment. Risk will stay on the downside with 0.7906 resistance intact. Below 0.7807 will target 0.7760 first. Firm break there will resume the fall from 0.8041. However, break of 0.7906 will bring stronger rally back to retest 0.8041 high.
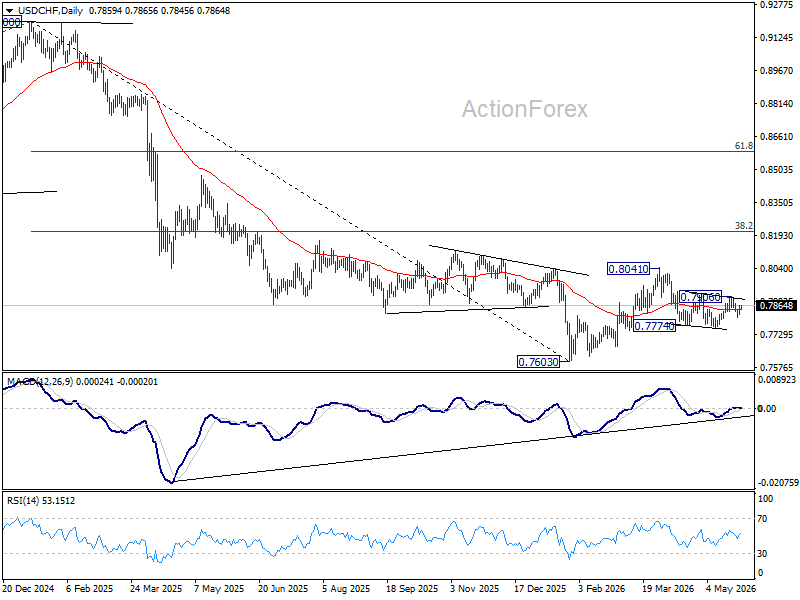
In the bigger picture, as long as 55 W EMA (now at 0.8035) holds, fall from 0.9200 is expected to continue, as part of the larger down trend. Firm break of 0.7603 will target 100% projection of 1.0146 (2022 high) to 0.8332 from 0.9200 at 0.7382.
AUD/USD Daily Report
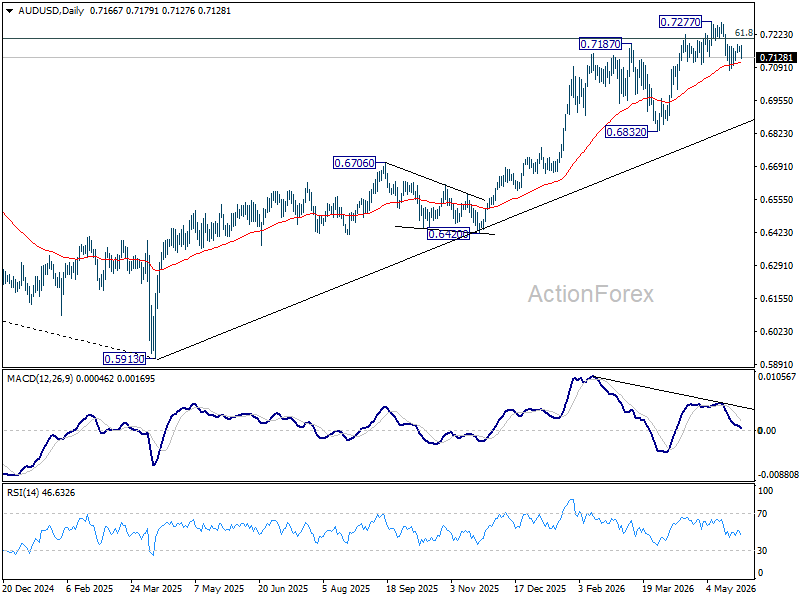
AUD/USD retreated ahead of 0.7183 resistance, but stays in range above 0.7076. Intraday bias stays neutral at this point. On the upside, firm break of 0.7183 resistance will suggest that pullback from 0.7277 has completed. Stronger rally should then be seen to retest 0.7277 high. However, decisive break of 0.7076 will indicate that larger scale correction is underway and target 0.6832 support instead.
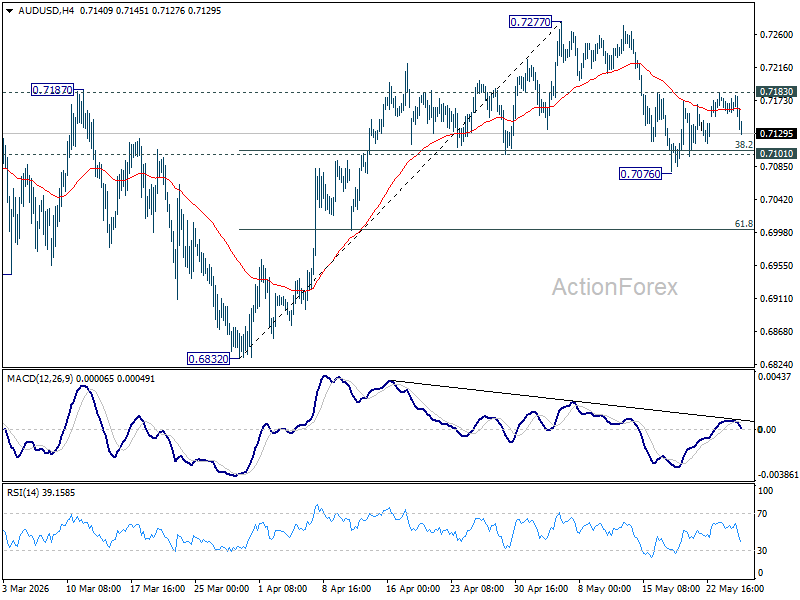
In the bigger picture, rise from 0.5913 (2024 low) is still in progress. Decisive break of 61.8% retracement of 0.8006 to 0.5913 at 0.7206 will solidify the case that it's already reversing the down trend from 0.8006 (2021 high). Further rally should then be seen to retest 0.8006. For now, outlook will remain bullish as long as 0.6832 support holds, in case of pullback.
USD/CAD Daily Outlook
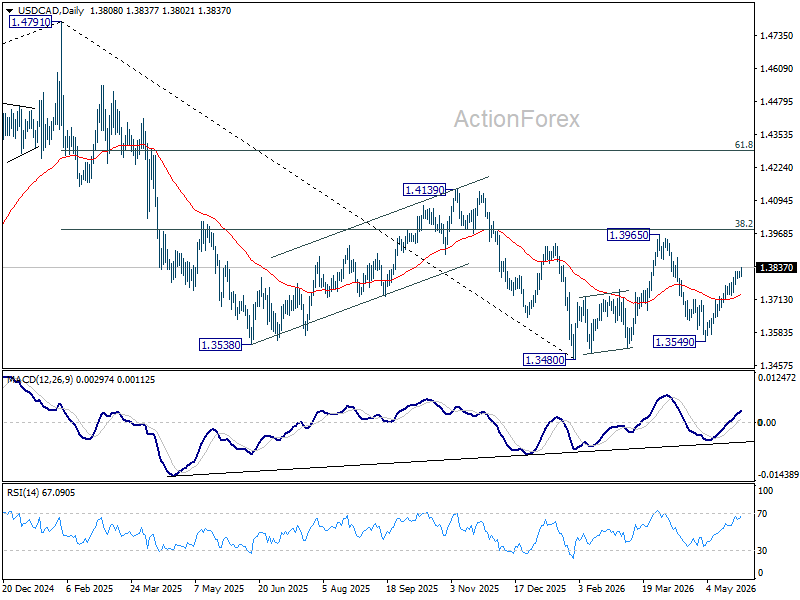
USD/CAD's rally from 1.3549 is in progress and intraday bias stays on the downside. It's seen as the third leg of the pattern from 1.3480 and should target 1.3965 resistance. On the downside, below 1.3793 minor support will turn intraday bias neutral again.
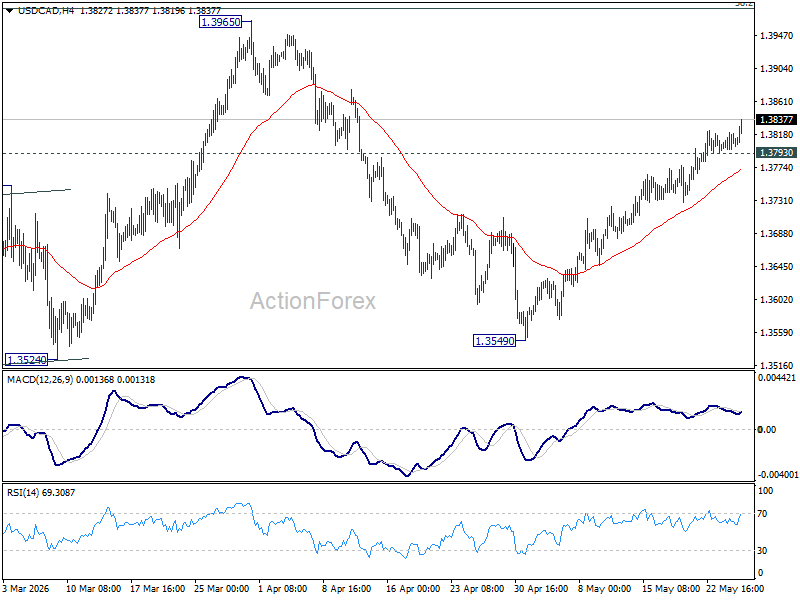
In the bigger picture, price actions from 1.4791 are seen as a corrective pattern to the whole up trend from 1.2005 (2021 low). Deeper fall could be seen, as the pattern extends, to 61.8% retracement of 1.2005 to 1.4791 at 1.3069. However, decisive break of 38.2% retracement of 1.4791 to 1.3480 at 1.3981 will argue that the correction has completed with three waves down to 1.3480 already.