Sample Category Title
BoE’s Bailey anticipates sharp decline in inflation, stresses need for balance
BoE Governor Andrew Bailey, speaking at an International Institute of Finance conference, projected a "quite a strong drop" in next month's inflation figures. This expectation is largely due to the unique household energy pricing system in the UK, which is set to impact the overall inflation calculations differently compared to other sectors.
However, he was quick to temper this optimistic forecast with a note of caution regarding the broader inflationary landscape. According to Bailey, underlying components of the inflation measure continue to show disparities that could complicate monetary policy response.
The Governor pointed out that while energy price inflation is currently running at minus 20%, the inflation in services remains high, around 6%. This stark contrast in inflation rates across different sectors presents an "unbalanced" picture.
"We don't have to have every component actually at target, but you do have to have a better balance," Bailey remarked.
WTI Wave Analysis
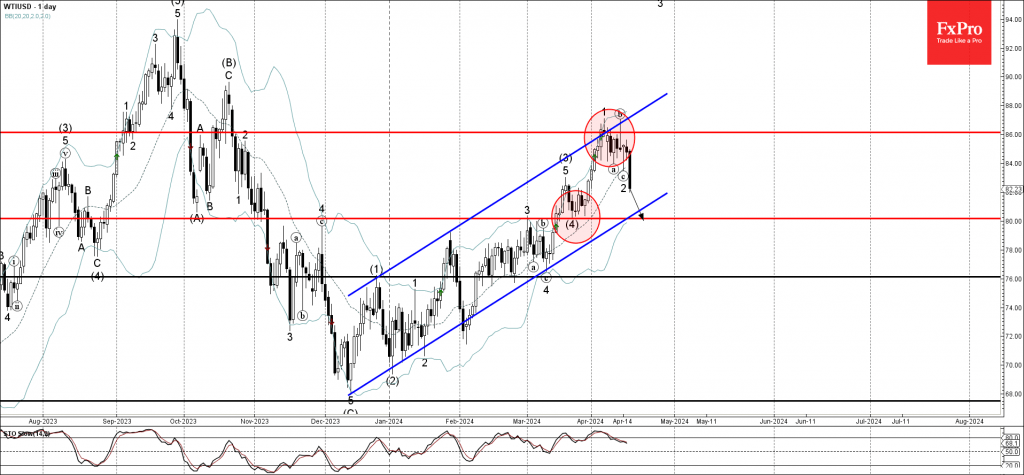
- WTI reversed from resistance zone
- Likely to fall to support level 80.00
WTI crude oil recently reversed down from the resistance zone lying between the resistance level 86.00, upper daily Bollinger Band and the resistance trendline of the daily up channel from December.
The downward reversal from this resistance zone started the active minor ABC correction 2.
WTI crude oil can be expected to fall further to the next round support level 80.00 (former low of wave (4) from March).
EURGBP Wave Analysis
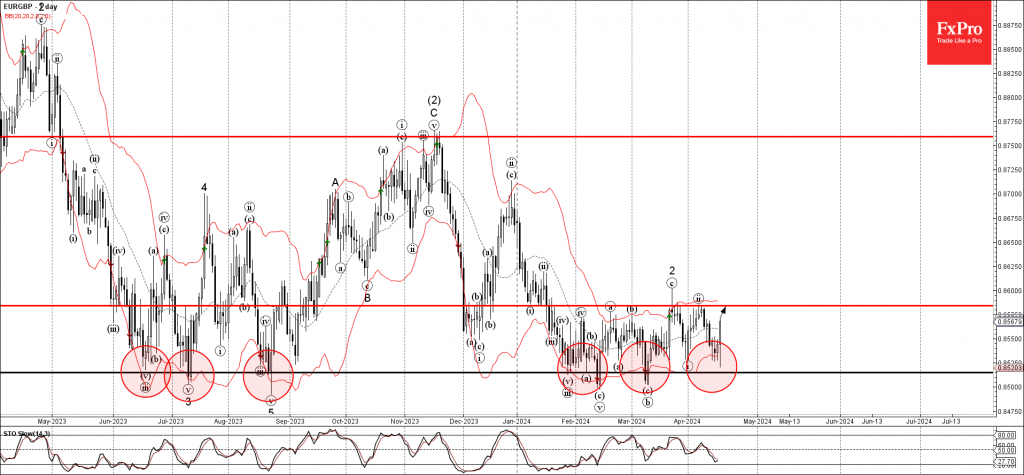
- EURGBP reversed from strong support zone
- Likely to rise to resistance level 0.8585
EURGBP currency pair recently reversed up from the strong support zone surrounding the powerful support level 0.8515, which has been reversing the price from last June.
This support zone was further strengthened by the lower daily Bollinger Band.
Given the strength of the support level 0.8515 and the bearish sterling sentiment, EURGBP can be expected to rise further to the next resistance level 0.8585 (which has been reversing the price from January).
Worst of Both Worlds: Are the Risks of Stagflation Elevated? Part I
Part I: A Framework to Characterize Episodes of Stagflation
Summary
- In this first report of a three-part series, we present a framework to characterize historical episodes of stagflation into mild, moderate or severe episodes.
- Iain Macleod coined the term "stagflation" during an address to the House of Commons in 1965: “We now have the worst of both worlds—not just inflation on the one side or stagnation on the other, but both of them together.”
- Stagflation can impose significant stress on the economy and can be a difficult situation to escape. Elevated inflation erodes consumer purchasing power, while weaker demand leads to a deterioration in the labor market, thereby limiting the opportunity for real wage gains.
- Conventional monetary or fiscal policy actions are remedies that often improve stagnation or inflation, but not both.
- The most salient episode of stagflation in modern U.S. history occurred in the 1970s. A perfect storm of energy price shocks, robust labor cost growth and elevated government spending led inflation to spiral, while economic output faltered and unemployment rose.
- While we could debate on the fairness of that comparison, the exercise of comparing bouts of stagflation led us to develop a simple framework to organize historical episodes on a severity scale.
- In data that span 1950 to present, we identified 13 instances of stagflation. Five episodes are mild, four are moderate and four are severe. The shortest episodes lasted two quarters, occurring in 1977-1978 and 1995, and the longest episode occurred in 1979-1982 (16 quarters).
- In the next installment of this series, we summarize past episodes of stagflation and their accompanying monetary policy decisions.
A Stagflation Situation
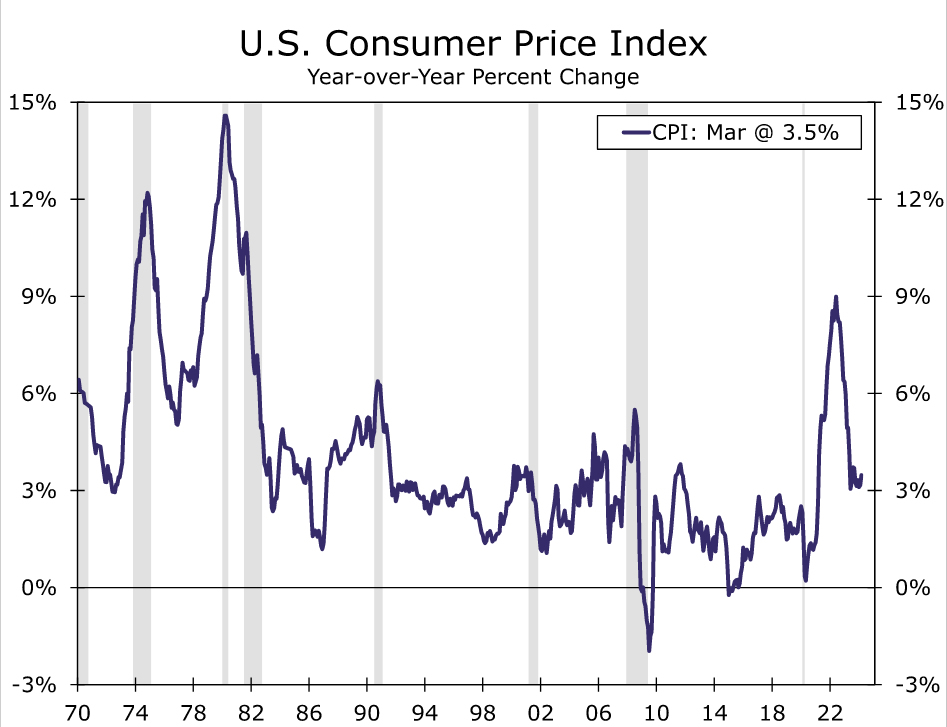
The door to stagflation has opened. Consumer price inflation ripped to a 40-year high in 2022 while real GDP growth was negative through the first half of that year. Persistent price growth amid contracting output can spell trouble for the stability of the economy. While inflation has cooled (Figure 1) and output has ramped up since then, the risk of stagflation in the coming year or so remains elevated. In this first report of a three-part series, we present a framework to characterize historical episodes of stagflation into mild, moderate or severe episodes.
To the best of our knowledge, Iain Macleod coined the term during an address to the House of Commons in 1965. He said, “We now have the worst of both worlds—not just inflation on the one side or stagnation on the other, but both of them together. We have a sort of ‘stagflation’ situation. And history, in modern terms, is indeed being made.”
Macleod believed history was being made because the economic literature at the time doubted the existence of stagflation. Stagnation and inflation often move in opposite directions. The Phillips Curve is predicated on a similar principle. That is, a rising unemployment rate, which typically correlates with falling output, will bring down inflation; a falling unemployment rate, which typically correlates with rising output, will push inflation higher. The occurrence of stagflation ran in opposition to the logic behind the Phillips Curve, as elevated price growth persisted amid rising unemployment and weak economic growth.
Stagflation can impose significant stress on the economy and can be a difficult situation to escape. Elevated inflation erodes consumer purchasing power, while weaker demand leads to a deterioration in the labor market, thereby limiting the opportunity for real wage gains. Conventional monetary or fiscal policy actions are remedies that often improve stagnation or inflation, but not both. For example, enacting an expansionary policy, such as a fiscal stimulus package for consumers, can promote economic activity during a downturn, but it can also cause inflation to rise, all else equal. On the flip side, enacting a contractionary policy, such as raising short-term interest rates, can help to rein in inflation, but higher rates also dampen economic growth prospects.
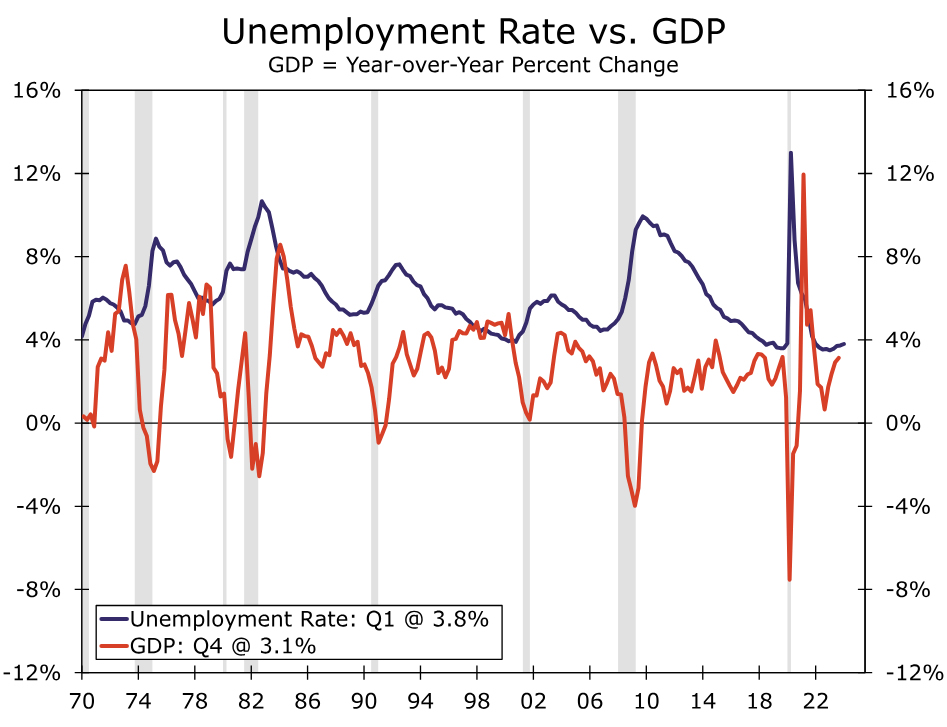
The most salient episode of stagflation in modern U.S. history occurred in the 1970s. A perfect storm of energy price shocks, robust labor cost growth and elevated government spending led inflation to spiral while economic output faltered and unemployment rose (Figure 2). At the time, the appropriate monetary policy path was not readily apparent and the Federal Reserve, led by Chair Arthur Burns, lowered the target for the federal funds rate in the mid-1970s to support employment growth. Yet expansionary policy during a stagflationary episode turned out to be a policy mistake. While the unemployment rate descended over the back half of the 1970s, consumer prices continued to increase at a rapid clip as elevated petroleum prices and wage costs were passed on to households via higher selling prices. Price stability was eventually restored in the 1980s after a few tough years of restrictive monetary policy enacted under Chair Paul Volcker.
Analysts have pointed to the 1970s as a similar experience to the post-pandemic inflation surge. While we could debate on the fairness of that comparison, the exercise of comparing bouts of stagflation led us to develop a simple framework to organize historical episodes on a severity scale.
Laying the Foundation
We define a stagflation episode as a period of at least two consecutive quarters with elevated inflation and low output growth. We use the year-over-year percent change of the CPI as our measure of inflation, and the compound annual growth rate of real GDP as our measure of output growth. We readily acknowledge that the FOMC’s current preferred measure of inflation is the PCE deflator.1 However, the FOMC formerly used the CPI as its primary inflation gauge and forecasted the CPI in the Greenbook until 2000. (The Greenbook forecasts switched to the PCE deflator in 2001). Still today, the FOMC pays close attention to the CPI, as it is timelier than the PCE deflator.
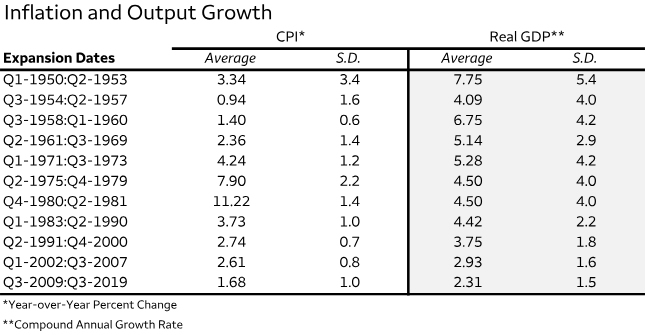
Figure 3 shows average real GDP and CPI growth for each business cycle expansion since 1950 and their standard deviations. The greatest average real GDP growth of 7.75% followed the 1948-1949 recession, while the smallest average growth of 2.31% reflects the post-Great Recession era. If we used 7.8% as a benchmark for real GDP growth throughout our entire sample, then most of the GDP series would be below average. By the same token, using 2.3% as the benchmark for output growth would render most periods as above average. Consequently, we employ the prior cycle’s average of real GDP growth as a benchmark to determine periods of “low” output growth.
If real GDP growth comes in below the prior cycle’s average for at least two consecutive quarters, we assign that period with low output growth. For example, real GDP growth averaged 2.9% between Q1-2002 and Q3-2007. In the expansionary phase following the Great Recession in 2007-2009, the U.S. economy expanded at rates below 2.9% from Q4-2010 through Q3-2011, so we designate this period with low output growth.
On the inflation side, our benchmarks are more fluid. The evolving nature of the U.S. economy has made one period’s high inflation feel too high of a bar to clear for other periods. For instance, the CPI averaged 7% annual growth throughout the 1970s, compared to its 1990s average of 3%. Several structural changes took place between these two decades, such as a transition away from price indexation in wage contracts and less reliance on petroleum imports. Thus, we employ a time-varying benchmark for inflation and summarize them in Figure 4.
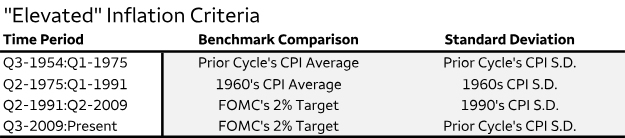
We find that the 2% target is a reasonable benchmark for the 1990s onwards, as inflation trended around that rate and monetary policy decisions were guided by that target. Indeed, the FOMC started to explicitly publish its 2% inflation target in post-meeting statements in the early 1990s. Prior to 1990, the inflation picture was mixed. Inflation was elevated and volatile during the 1970s and 1980s (revisit Figure 3). To parse through the variation, we use the CPI’s average growth over the expansionary phase of the 1960s (2.36%) as the watermark for “normal inflation” from 1975 to 1991. Prior to 1975, we return to using the prior cycle’s average CPI growth as the benchmark.
Drawing Lines in the Sand
We utilize the magnitude and duration of high inflation, alongside low output growth, to characterize stagflation into different categories. If a period is determined to have low output growth relative to the prior cycle, we then evaluate the inflationary pulse of that period to determine if stagflation occurred. Should inflation be elevated relative to the criteria outlined in Figure 4, we then categorize the episode of stagflation as mild, moderate or severe.
Given real GDP growth is below the prior cycle’s average for at least two straight quarters, we define a “mild” episode of stagflation as two consecutive quarters where the CPI inflation rate is above the inflation benchmark by one standard deviation. A “moderate” episode is three or four consecutive quarters where CPI inflation is above the benchmark by one to three standard deviations. Finally, a “severe” episode is at least six consecutive quarters where the CPI inflation rate is above the benchmark by three standard deviations or more.
In data that span from 1950 to present, we identified 13 instances of stagflation and outline them in Figure 5. Five episodes are mild, four are moderate and four are severe. The shortest episodes lasted two quarters, occurring in 1977-1978 and 1995, and the longest episode occurred in 1979-1982 (16 quarters). Furthermore, four stagflation episodes did not overlap with recessions, while nine episodes occurred during or near a recession.
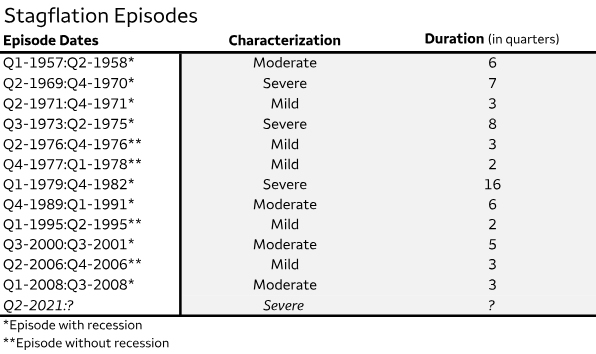
The most recent occurrence of stagflation began in the second quarter of 2021, when consumer prices gathered momentum amid gummed up supply chains and ramped up household demand. The drivers of inflation have shifted as we have gotten further away from the pandemic, but price growth remains persistent, especially relative to the past business cycle. At the same time, output growth has strengthened, which suggests the severity of the latest bout of stagflation has eased or the episode has ended altogether.
What will U.S. central bankers decide in the face of these crosscurrents? Can we learn from historical episodes of stagflation? In the next installment of this series, we summarize past episodes and their accompanying monetary policy decisions. In the final installment, we revisit the 2021 episode and consider the risks of stagflation in the coming years.2
Endnotes
1 – See a recent special report published in April 2024 for more detail on the differences between the Consumer Price Index and the PCE Deflator.
2 – This series is based on a 2024 American Economic Association Annual Meeting paper by Azhar Iqbal and Nicole Cervi titled "Characterizing Stagflation into Mild, Moderate and Severe Episodes: A New Approach". Please contact the authors if interested in the full paper.
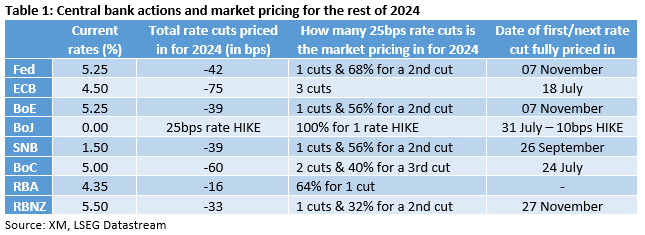
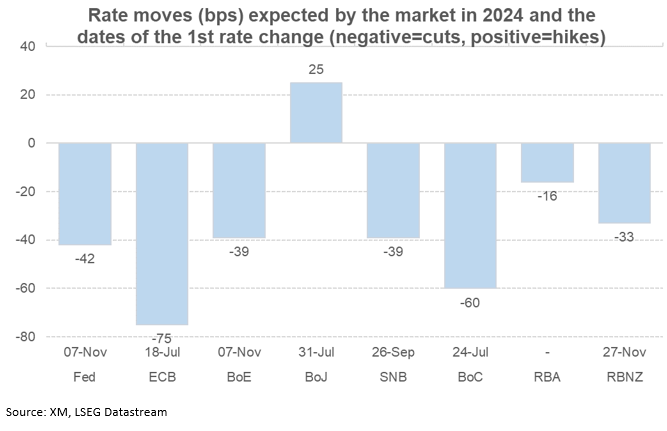
Market Continues to Price in a Plethora of Rate Cuts for 2024
- Market is still in monetary easing mode despite fewer rate cuts priced in across the board
- Divergent cut expectations for the Fed and the ECB, reflecting economic conditions
- The ECB and the BoC are seen cutting in July; the RBA might not cut rates this year
- BoJ is seen hiking again during 2024
The market is digesting both the latest geopolitical developments and the recent rally in oil prices as the countdown to the May 1 Fed meeting has begun. Compared to the start of 2024, fewer rate cuts are expected by the key central banks with the market also contemplating a non-negligible possibility of the Fed keeping its rates unchanged during 2024.
Fed and the ECB: divergent paths
The initial market expectations of around six rate cuts in 2024 for both the ECB and the Fed were quite puzzling considering the perceived health of these two economies. The economic divergence between the US and the euro area has since become more pronounced as Chinese growth continues to disappoint and despite some very tentative positive signs from the euro area business surveys.
The Fed is seen cutting its interest rates by 42bps in 2024, which translates to one full 25bps rate cut and a 68% chance for a second rate cut of similar magnitude. The first rate cut is priced for November, clearly reflecting the recent trend in US data releases. With growth expected to stay north of 2% for the first quarter of 2024 and inflation remaining elevated, there is a strong possibility that the first Fed rate cut could be pushed out even further. Also, the November elections are gradually coming into the picture, complicating the Fed’s position.
On the flip side, the continued economic growth weakness and the sizeable easing in inflationary pressures in the euro area have opened the door to the market pricing in three ECB rate cuts of 25bps each in 2024.
BoC: two rate cuts and room for more
The Bank of Canada is probably the most dovish central bank at this juncture. The significant progress made in inflation was acknowledged in the most recent BoC gathering with Governor Macklem talking about the need for further evidence of a sustainable easing inflation. When examining the domestic issues, especially the housing sector, one could say that the two rate cuts currently priced in are probably an underrepresentation of current situation and hence more rate cuts could be announced in 2024.
BoE, SNB, RBNZ: one rate cut and done for 2024?
These three diverse central banks are probably going to announce at least one rate cut in 2024. The UK continues to experience high inflation and a relatively low growth rate. Bank of England members are preparing for the much-touted rate cuts, but the threat of renewed inflationary pressures, on the back of the latest geopolitical developments supporting the recent oil price rally, is keeping them up at night.
The year started with the market expecting almost four rate cuts by the Reserve Bank of New Zealand in 2024. Similarly to other central banks, inflation is proving stickier even though recent data is pointing to a weakness in consumer spending. Somewhat surprisingly, the RBNZ maintained its hawkishness at the recent meeting and poured cold water of dovish expectations. The market expects only 33bps of easing in 2024.
The Swiss National Bank surprised the market with its March rate cut. The low inflation forecasts for both 2025 and 2026 could mean that the SNB is not done yet. Hence, the market is currently fully pricing in another 25bps rate cut by September with around 56% chance of one additional move by year-end.
RBA: could it keep rates unchanged for 2024?
The Reserve Bank of Australia was the last one to hike in 2023 and the market is only assigning a 64% probability for a 25bps rate cut in 2024. Such a move though could become even more improbable if China finally manages to return to growth, influencing its main trading partners and the commodity markets.
BoJ: the market wants more
The first rate hike since 2007 has opened the market’s appetite for further rate moves, which matches Governor’s Ueda current thinking. The market is pricing in at least another two 10bps rate hikes in 2024 with the current yen weakness, and its impact on imported inflation, potentially offering the Bank of Japan an excuse to do even more down the line.
ECB’s Cipollone to consider easing if June and July data confirm inflation progress
During a conference today, ECB Executive Board member Piero Cipollone emphasized the importance of incoming data in the months of June and July in shaping ECB's approach to ease its current restrictive measures.
"If we see that the incoming data...will confirm our confidence that inflation is really (moving) to target, it will be appropriate to remove some of the restriction that we put in place," he stated.
However, Cipollone also expressed concerns regarding the volatility in the commodity markets, particularly the price of oil, which poses a significant risk to inflation. As Eurozone is a large, open economy with substantial dependence on energy imports, fluctuations in oil prices remain a major concern for ECB.
Sunset Market Commentary
Markets
Fed Chair Powell yesterday rubberstamped a delay of the inaugural Fed rate cut as inflation doesn’t provide the confidence needed to ease policy anytime soon. Yields yesterday still gained a few bps, but today markets came to a short term evaluation point. US yields change between -5 bps (5 & 10-y) and -3 bps (2-y). With markets positioned for a first Fed rate cut in September (90% discounted) and trading indecisive on a second additional cut by year-end, probably new ‘outspoken’ data is needed to start a next directional move. 5% looks like a hard barrier for the US 2-y yield. Upside inflationary risks due to geopolitical developments (e.g. higher prices for oil or other commodities) might affect yields at longer maturities first as the bar is high for markets to contemplate additional Fed rate hikes. Even with today’s ‘pause’, the technical picture/trend in US long-term yields (10-y 4.63% and 30-y 4.75%) is still pointing north. EMU March CPI was confirmed at 0.8% M/M and 2.4% Y/Y for headline and 2.9% for core. For now, EMU inflation doesn’t obstruct the ECB’s intention to start cutting rates in June. However, as is the case in the US, the path for EMU inflation might become more bumpy after the April figure. Changes to German yields stay limited with the 2-y adding 1 bp while the very long end (30-y) declines modestly (-2.5 bps). Question remains how much room there is for the ECB (and many other CB’s) to start and continue an autonomous easing cycle as the Fed’s on hold for longer. Markets currently discount ECB rate cuts at the meetings with new projections (June, September, December). The here risk remains for further push-backs, leaving the downside in EMU yields well protected. EMU swap yields yesterday tested/briefly pierced the top of this year’s sideways consolidation pattern (2-y 3.31%, 10-y 2.83%). Yields at longer maturities stay low if the ECB would be pushed to a higher/less easy for longer scenario later this year. Equities try a cautious rebound after their recent setback (Eurostoxx +0.9%, S&P 500 +0.4%). Still, higher real yields probably set the stage for more sell-on-upticks price action. Oil eases further below $90/b ($89.25). The dollar also takes a pause after the recent rally (DXY 106.25, EUR/USD 1.0635, USD/JPY 154.65).
UK March inflation data this morning eased further, but at a slower than expected pace. Headline inflation rose 0.6% M/M and 3.2% Y/Y (from 3.4%). Core inflation also slowed less than expected to 4.2%. Services inflation stays stubbornly high at 6% Y/Y. At the March BOE meeting, MPC members Mann and Haskel no longer pushed for an additional 25 bps hike, focusing the debate on the timing of rate cuts. Today’s (core) data suggest, that it won’t be easy for the BoE to start cutting rates before summer. BoE’s Greene admits that the UK inflation is headed for a bumpy road. Sterling briefly gained post the CPI data, but again trades in well-known territory near EUR/GBP 0.854.
News & Views
South African inflation in March eased a little more than expected. Prices rose 0.8% M/M (consensus 0.9%). Yearly CPI eased to 5.3%. Core gauges eased marginally from 5% to 4.9%. The central bank (SARB) raised the policy rate 10 consecutive times and kept it at 8.25% since May. With CPI above the 4.5% midpoint of the target range for more than a year, today’s numbers are unlikely to trigger a rate cut anytime soon. Moreover, inflation is expected to pick up in Q2 on stronger oil prices. The SARB expects inflation to moderate towards target by end of 2025. The prospect of the Fed keeping rates higher for longer should also deter the SARB from cutting quickly. Even as the fall-out of king dollar on the ZAR stayed limited compared to other EM peers, the rand does trade weak in a broader perspective. USD/ZAR yesterday regained the 19 barrier. This compares to the all-time ZAR low of 19.92 in June 2023.
The Hungarian forint outperforms CE peers today. Regional currencies perform better after a recent beating driven by risk aversion and soaring core bond yields. But comments from the central bank’s chief economist may have helped HUF. Zsolt Kuti in an interview with the business news website Portfolio said the role of the forint has become more important in setting monetary policy. This importance is driven by the risk of euroization, its effect on inflation – which he forecasts to be above 4% from May to the end of the year - and debt as well as on growth, he said. EUR/HUF eases to 393.14 currently, down from >395. The Polish zloty is second today. The government late yesterday announced it will raise the price cap on electricity prices by about 20% from July on. While the effects on inflation remain to be seen (guesstimates go as high as adding 1 ppt), it probably cements the case for the central bank to keep rates steady through 2024. EUR/PLN dropped from 4.37 at the open to around 4.35 currently.
BoE’s Greene: Middle East poses energy and supply side risks
BoE MPC member Megan Greene expressed concerns today during a seminar about the economic repercussions of ongoing tensions in the Middle East. Highlighting the region's significance, Greene pointed out the risks associated with an energy price shock and other supply side disruptions, which could complicate the inflationary landscape further.
"I do think that what's going on in the Middle East does pose a risk," Greene remarked. "I'm worried about the sort of an energy price shock and other supply side shock, which obviously follow a number of supply side shocks we've seen over the past couple of years, and what that might do to inflation expectations."
Greene also addressed the challenges involved in reducing inflation to the Bank's target of 2%, noting that the final steps in this process are particularly challenging. "The 'last mile' of the journey towards hitting the 2% inflation target was the hardest part," she stated.
EURGBP Maintains Bearish Bias Amid Pennant Formation
- EURGBP tests uptrend line as it resumes slide
- Risks are tilted to the downside
- But pennant pattern suggests more consolidation
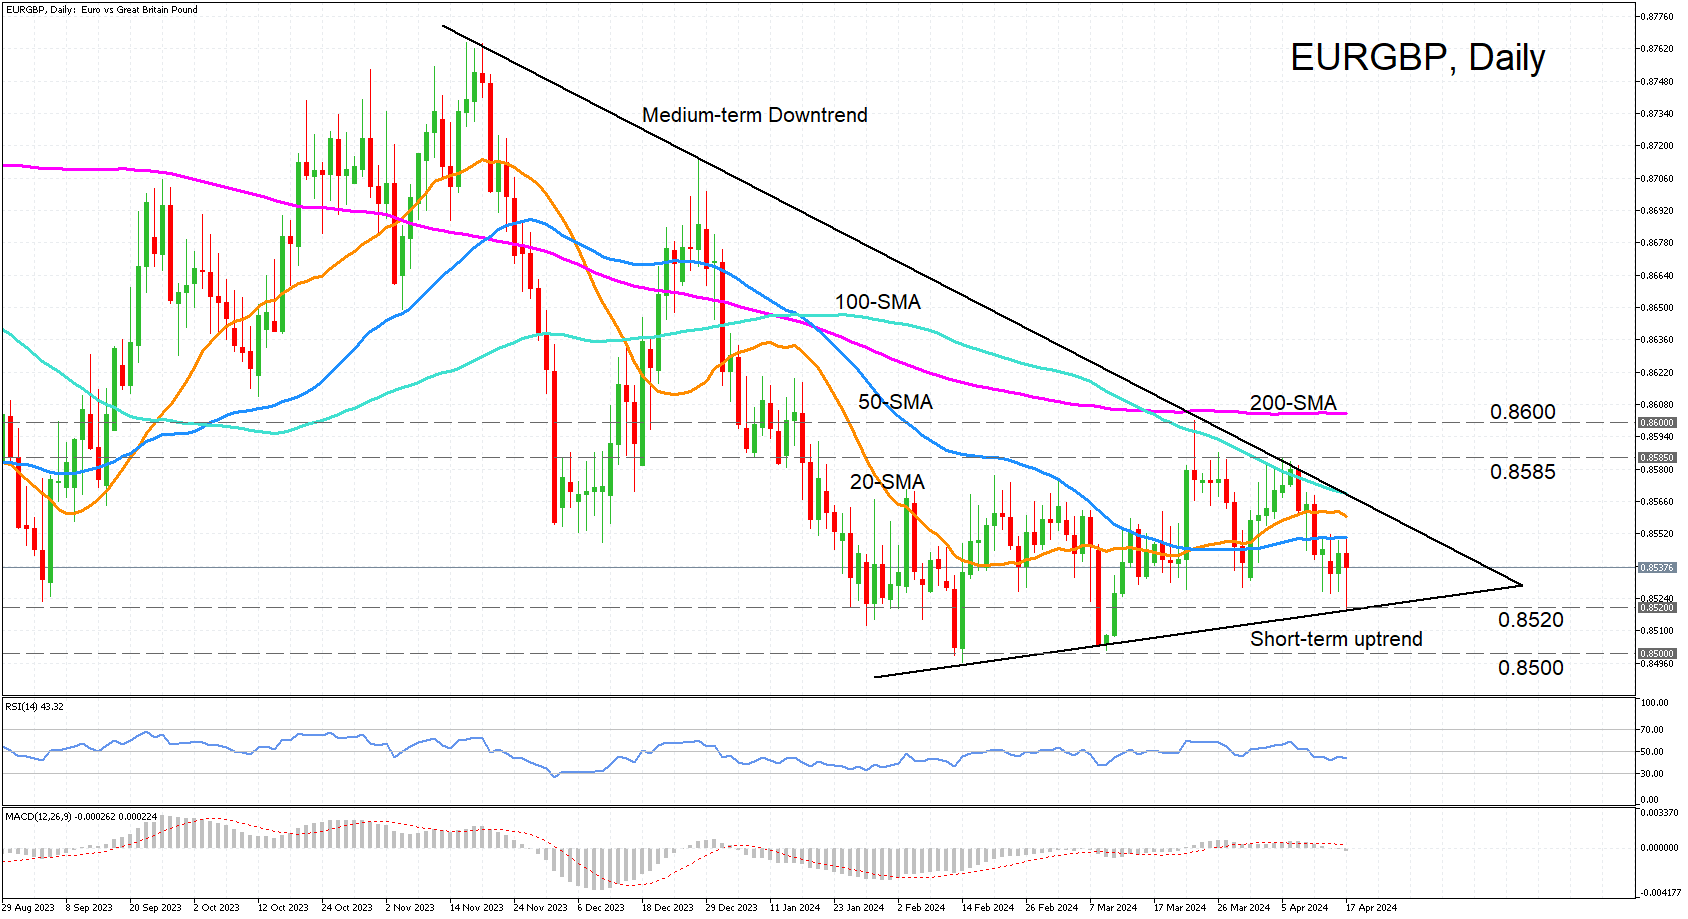
EURGBP has been drifting lower after its latest attempt to break above the medium-term descending trendline failed, peaking at 0.8585. The price briefly touched the short-term uptrend line just below 0.8520 earlier today before bouncing higher.
But as it remains below its 20- and 50-day simple moving averages (SMA), the risks are tilted to the downside, and this is supported by the momentum indicators. The RSI is hovering below the 50 neutral level, while the MACD is still in negative territory below its red signal line.
Should the price spike lower again and break below the downtrend line, attention will likely turn to the 0.8500 level, after which the path is clear until the 0.8400 mark. A drop below the February trough of 0.8496 would signal the resumption of the medium-term downtrend.
However, if EURGBP manages to clear its immediate upside hurdles, which consist of the 50-, 20- and 100-day SMAs, this would help shift the medium-term outlook to a more positive one. But overcoming the 100-day SMA, which is converging with the descending trendline, could prove difficult, while a further climb above the 200-day SMA, slightly above 0.8600, is vital for a more sustainable uptrend.
Overall, despite the bearish bias, the price action could continue to develop within what appears to be a pennant pattern, and this opens the prospect of an upside breakout in the near term.